

Abstract
Background:
Despite the importance of adequate hospital nurse staffing, California is the only state with minimum nurse-to-patient ratio mandates. The health care workforce is historically “countercyclical”—exhibiting growth during economic recessions when employment in other sectors is shrinking.
Purpose:
This study was to examine how staffing mandates impact hospital nurse staffing during economic recessions.
Method:
We compared hospital nurse staffing in California and in other states over 20 years to examine differences before and after the California mandate and, within the postmandate period, before, during, and after the Great Recession of 2008.
Findings:
Staffing differences increased during the postmandate period due to faster growth in California staffing compared to other states, except during the Great Recession, when staffing remained stable in California but declined in other states.
Discussion:
State legislators deliberating staffing mandates should consider the protective factor such policies provide during economic recessions and the implications for the quality and safety of care.
Keywords: Hospitals, Workforce, Nursing staff, Economic recession, Health policy
Introduction
The Great Recession of 2008 drove a decline in the growth rate of health care spending and a reduction in capital investments by health care providers as households, governments, and businesses faced economic hardship (Martin et al., 2011). National unemployment rates increased from 5.0 percent in December 2007 to 9.5 percent in June 2009 (U.S. Bureau of Labor Statistics, 2012). However, the health care industry historically experiences employment growth during recessions. Nursing jobs are no exception to this “countercyclical” trend (Dolfman et al., 2017), but how this impacts actual hospital staffing levels during recessions is unknown. Nurses represent a significant portion of hospital operating budgets (Kane & Siegrist, 2002). Financial pressures prompt hospitals to limit growth in staff, as noted during the introduction of the Balanced Budget Act of 1997 and prospective payment systems (Bazzoli et al., 2004).
California hospitals faced the economic challenges of the recession with the added pressure of Assembly Bill (AB) 394 (Reiter et al., 2012), which imposed mandatory nurse-to-patient ratios by specialty. For example, the bill required medical-surgical floors to have at least 1 nurse for every 6 patients, a nurse-to-patient ratio that transitioned to 1:5 over an 18-month period. In addition to restricting how hospitals can legally respond in the face of nursing shortages and financial strain (i.e., their austerity measures cannot reduce nurse staffing below the mandated minimum), full implementation and compliance with the mandate was estimated to cost each hospital $700,000 to $800,000 (Spetz, 2004).
Hospitals disapproved of the law as a unilateral one-size-fits-all mandate that ignored individual facilities’ needs. It was only after years of extensive lobbying efforts by nursing unions that AB 394 was passed in 1999 and implemented January 1, 2004. California remains the first and only state to pass legislation mandating comprehensive minimum nurse-to-patient ratios in hospitals. However, research has repeatedly shown that adequate nurse staffing is associated with critical patient outcomes, including mortality (Aiken et al., 2014; Aiken et al., 2010; Needleman et al., 2011), failure to rescue (Aiken et al., 2002), other adverse events and length of stay (Needleman et al., 2002). Therefore, the costs of implementing staffing requirements—in California or other states—may be offset by the expenses associated with near misses and adverse events that would be avoided (Dall et al., 2009; Rothschild et al., 2009). Average length of stay in community hospitals has declined over recent decades (American Hospital Association, 2018) while patient comorbidities have increased (Clark et al., 2018), both adding more pressure on nursing staff and increasing care demands.
California remains the only state with a strict minimum nurse-to-patient ratio, but interest in staffing legislation has gained momentum and other states, including Massachusetts and Illinois, have since introduced legislation for minimum staffing ratios, although none have passed (Tung, 2019). The potential for widespread impact of staffing laws and continued debate about ratios makes studying the California staffing mandate a research priority. Previous studies have evaluated the California staffing mandate in terms of nurse staffing levels and skill mix (McHugh et al., 2012; McHugh et al., 2011). No studies have addressed the mandate in the context of macroeconomic changes, and few recent studies are available on the topic despite its importance and relevance to current policy development.
Recessions are inevitable byproducts of global economic fluctuations and hospitals will face budget constraints in future years. Whether and how these laws interact with economic recessions to help or hinder hospitals is an important consideration during legislative proceedings in states looking to emulate California. This study provides evidence for these deliberations. The objective was to compare nurse staffing in California hospitals to those in other states not subject to a state-level staffing mandate before, during, and after the 2008 economic recession.
Methods
Design
California is the first and, to date, only state to impose mandatory minimum RN staffing ratios on hospitals, effective January 1, 2004. Four years later, the economic recession of 2008 presented the conditions under which nurse staffing, as a hospital’s single largest operating expense, likely attracted the heightened awareness of budget-conscious administrators looking to reduce costs. These events created a natural experiment to test the mitigating effect of staffing mandates on nurse staffing in hospitals experiencing economic hardship. We compared nurse staffing in California hospitals to hospitals in other states (not subject to staffing mandates) to identify staffing trends and differences preand postmandate, as well as before, during, and after the 2008 economic recession. The approach, therefore, employed a longitudinal design, using hospital data from 1997 to 2016. The study aimed to isolate the impact of the 2008 economic recession on hospital nurse staffing in states with and without staffing mandates.
Data Sources and Sample
Data were from the American Hospital Association (AHA) and included all adult non-federal acute care hospitals available for the years 1997 to 2016. The Annual Survey through which these data were collected historically achieves a response of greater than 75% (American Hospital Association, 2020). Observations were hospitals by year.
Study variables
Nurse staffing levels were defined as registered nurse (RN) hours per patient day (HPPD), a ratio derived by hospital with reported fulltime equivalent nurses multiplied by 1,768 hours as the numerator and adjusted patient days as the denominator. The numerator is 85% of 2,080 potential hours at a rate of 40 hours per week for 52 weeks. The adjustment follows standard conventions to account for vacation and sick time (Spetz et al., 2008)
Covariates
Fully adjusted models included hospital characteristics available through the AHA database and with a history of use in nursing health services research, namely number of beds, technology status (indicator for organ transplant and open-heart surgery facilities), teaching intensity (three ordinal categories based on resident-to-bed ratio), occupancy rate, ownership status, percentage of admissions with Medicare as the primary payer, percentage of admissions with Medicaid as the primary payer, and the Herfindahl-Hirschman Index (a proxy for market competition based on hospitals’ service area market share) (Aiken et al., 2002; Aiken et al., 2010; McHugh et al., 2011; McHugh et al., 2012).
Analysis
Fixed effect regression models estimated RN HPPD difference-in-differences over the following periods: pre- and postmandate (before and after/including 2004, respectively), and (within the postmandate period) before, during, and after the 2008 economic recession. These models control for unobservable time-invariant characteristics within each hospital that may influence both the outcome and the independent variable of interest. We preprocessed the data using entropy balancing to account for the possibility that hospitals in California differ systematically from hospitals in other states. This preprocessing procedure, as with more conventional matching approaches, improves covariate balance between treatment and control groups for estimating treatment effects in observational data. There are several advantages over these other approaches. Common matching methods such as nearest neighbor matching assign a weight of 1 or 0 to observations, discarding observations to improve balance. The process is often iterative: the researcher estimates propensity scores, reviews matching diagnostics, and respecifies the propensity score model to improve balance. Entropy balancing starts with a known sample, in this case California hospitals’ baseline average characteristics, and employs a maximum entropy reweighting scheme to balance covariates to match. There is no need to evaluate matching diagnostics and because weights may vary across hospitals, the process preserves all observations (Hainmueller, 2012; Hainmueller & Xu, 2013).
For reweighting and regression analyses, some continuous variables were categorized. Number of licensed beds determined a hospital’s size (≤100, small; 101–250, medium; ≥251, large). A binary variable indicated whether or not a hospital had the technology to perform advanced procedures, such as organ transplants. The ratio of residents per hospital bed determined a hospital’s teaching intensity (0, “non-teaching”; >0 and <.25, “minor teaching”; ≥.25, “major teaching”). The continuous Herfindahl-Hirschman Index, representing the share of cases a hospital receives within the local health care market, was categorized by quartile. The entropy balancing weights included average RN HPPD for California hospitals before 2008 in addition to these covariates and those noted earlier. The weight was used in subsequent analyses and preserved the full sample, eliminating attrition bias. As a sensitivity analysis, we produced parallel models using unweighted data.
Findings
Figure 1 and 2 present graphical representations of nurse staffing over time for California and non-California hospitals. The vertical bars stemming from the horizontal axis in each figure associate the data with a timetable of events related to the California staffing mandate and the 2008 economic recession. Figure 1 presents observed RN HPPD for 1997 to 2016, demonstrating a continued rise in staffing levels across hospitals in all states, but with growth in California hospitals outpacing that of other states. This figure adds eight years of data to previous reports (McHugh et al., 2011), including the time encompassing the Great Recession and subsequent years of recovery. A notable decrease in staffing among “other” states punctuates the recession period of this figure and contrasts clearly with California’s continued, even if slowed, growth.
Figure 1 –
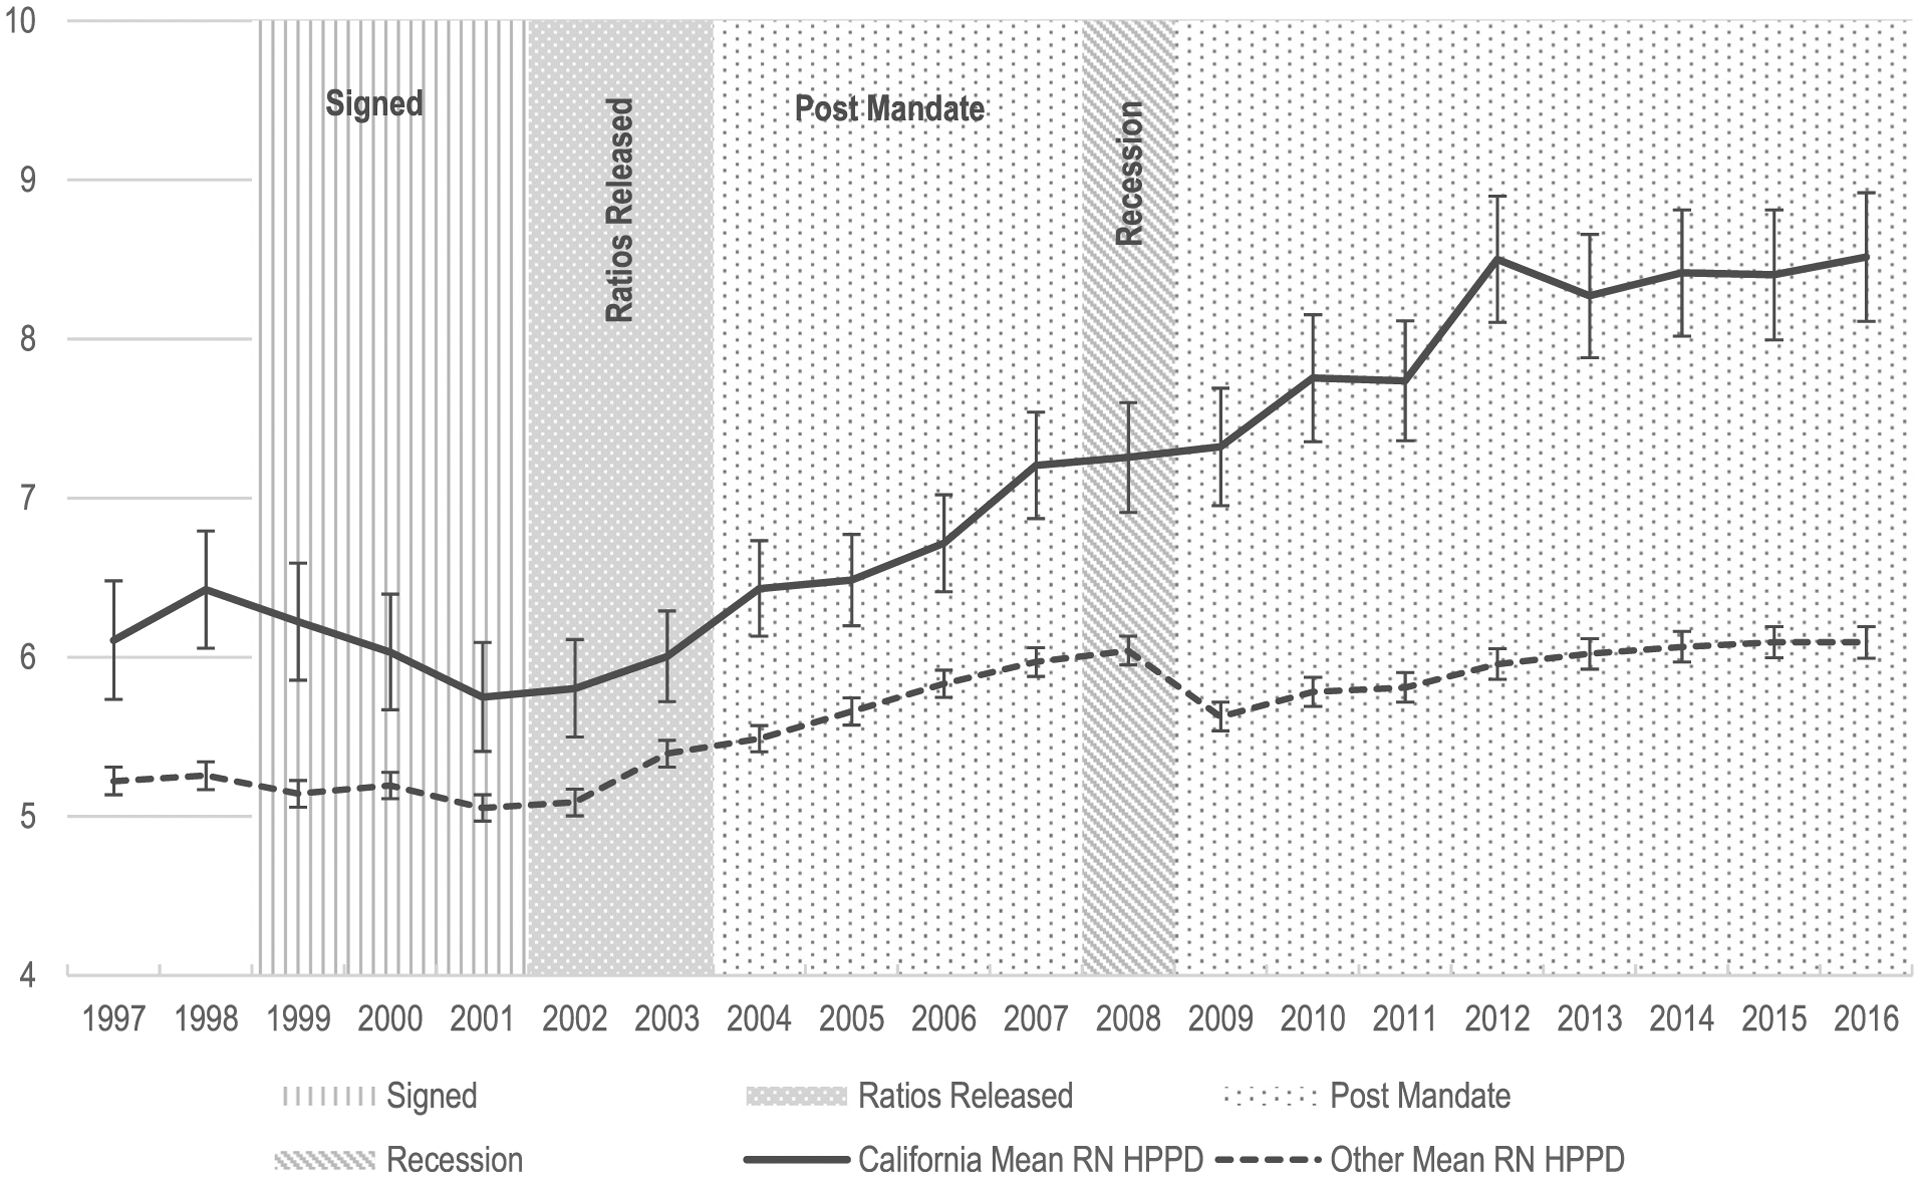
Observed RN hours per patient day.
Figure 2 –
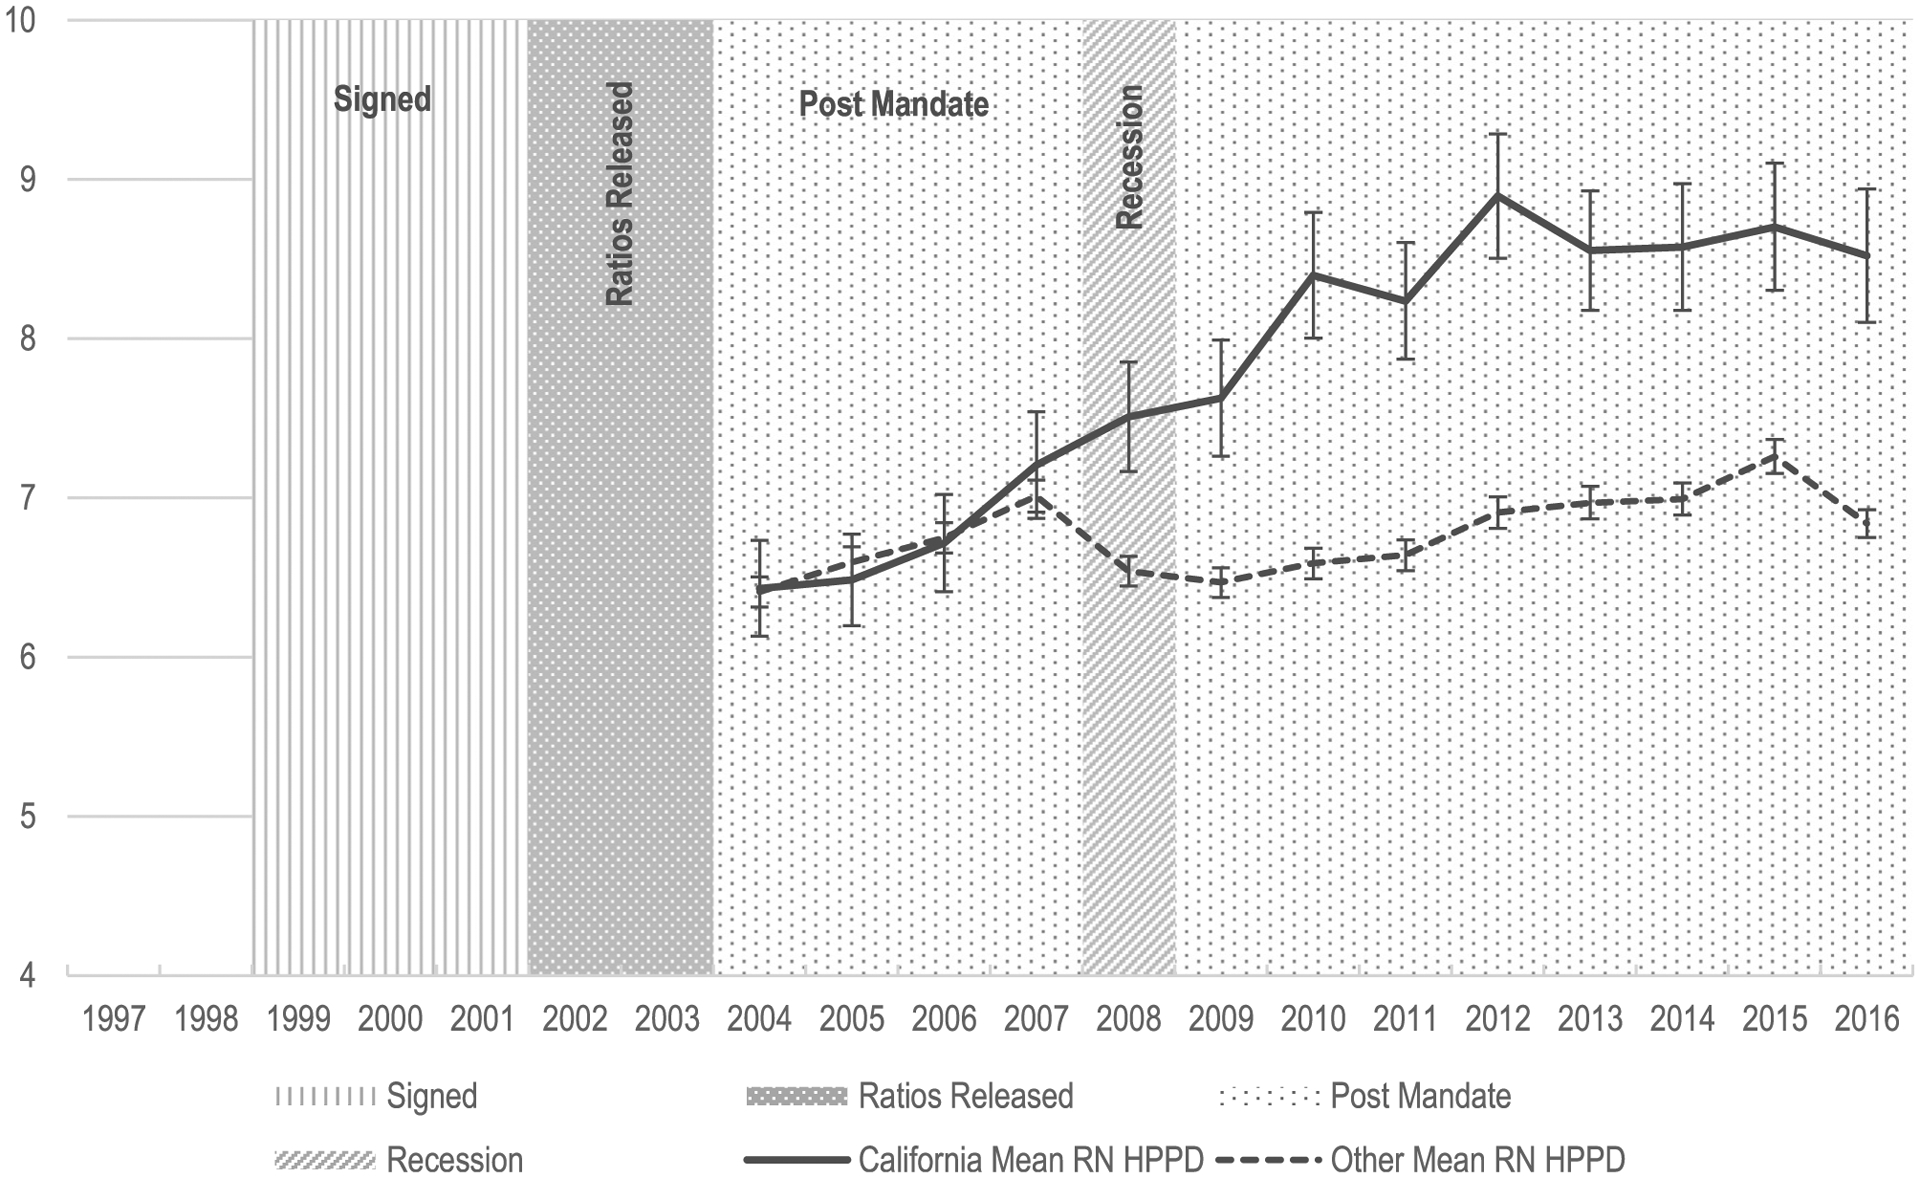
RN hours per patient day (entropy balancing).
Figure 2 examines this phenomenon more closely, using postmandate (2004–2016) data only and applying entropy balancing weights derived from the prerecession years. The effect of entropy balancing is visually apparent as the gap between trend lines for 2004 to 2007 as seen in Figure 1 is nullified by the reweighting process and these lines within the same period now overlap. This merging is a result of accounting for systematic differences between California hospitals and hospitals in other states in the postmandate/prerecession period and does not imply that there is no mandate effect. Balancing in this period highlights the impact of the recession as the trend lines later diverge reflecting the differing responses of hospitals in California and in other states with respect to nurse staffing. Both lines increase over time as before, but the economic constraints of the recession are apparent beginning in 2008. RN HPPD in California hospitals continue growing during the recession The reductions in staffing levels in other states widens this gap further. In both figures, the decline in staffing across hospitals in other states represents a loss approximately equal to growth achieved in the 4 to 5 years prior to the recession. Postrecession, RN HPPD growth resumes in other states, but growth in California continues to outpace other hospitals. As of 2016, California hospitals achieved staffing ratios that exceeded their levels at the start of the recession by 1.3 HPPD. Over the same period, however, other hospitals were still recovering from the recession’s impact on staffing, with average HPPD finally matching 2007 levels in 2014—a 6 to 7-year delay in progress.
Table 1 shows the characteristics of hospitals in California and in other states before and after entropy balancing as well as before and after 2004—the year California’s staffing mandate was implemented. In the premandate period and before balancing, the observed distribution of California hospitals across all facility characteristics was significantly different in virtually every category from that of other hospitals. California hospitals were larger, not for-profit, teaching hospitals with high-tech capabilities and staffing that exceeded that of hospitals in other states by nearly one RN HPPD. Entropy balancing resolved these differences such that at baseline, the treatment and control groups were not statistically different from one another in any of the measured categories. In the postmandate period, these differences remained null except for RN HPPD, where California hospitals exceeded other hospitals by 1.2 RN HPPD.
Table 1 –
Descriptive Statistics of Hospitals in California and Other States Pre- and Postmandate and Entropy Balancing.
| Premandate (1997–2003) | Postmandate (2004–2016) | ||||||
|---|---|---|---|---|---|---|---|
| Before Balancing | After Balancing | After Balancing | |||||
| Characteristic | Format | Calif. | Other | Calif. | Other | Calif. | Other |
| RN hours per patient day | mean | 6.03* | 5.19 | 6.03 | 6.03 | 7.90* | 6.73 |
| Bed size: | |||||||
| <100 beds | % | 28* | 45 | 28 | 28 | 28 | 28 |
| 100–250 beds | % | 40* | 32 | 40 | 40 | 40 | |
| >250 beds | % | 32 | 22 | 32 | 32 | 32 | 32 |
| Teaching status: | |||||||
| None | % | 64* | 82 | 64 | 64 | 64 | 64 |
| Minor | % | 30* | 13 | 30 | 30 | 30 | 30 |
| Major | % | 6.0 | 4.7 | 6.0 | 6.0 | 6.0 | 6.0 |
| High-tech | % | 37* | 24 | 37 | 37 | 37 | 37 |
| For-profit | % | 79* | 89 | 79 | 79 | 79 | 79 |
| Patients per bed | mean | 0.98* | 1.04 | 0.98 | 0.98 | 0.98 | 0.98 |
| Share of Medicare patients | % | 40 | 50 | 40 | 40 | 40 | 40 |
| Share of Medicaid patients | % | 24 | 17 | 24 | 24 | 24 | 24 |
| HHI: | |||||||
| <25 percentile | % | 55* | 29 | 55 | 55 | 55 | 55 |
| 25–49 percentile | % | 25 | 26 | 25 | 25 | 25 | 25 |
| 50–74 percentile | % | 20 | 22 | 20 | 20 | 20 | 20 |
| ≥75 percentile | % | 0.5* | 23 | 0.5 | 0.5 | 0.5 | 0.5 |
| Number of observations | 1,562 | 22,648 | 1,562 | 22,648 | 3,471 | 41,062 | |
Indicates that the treated group is different from the control group at p < .05.
Table 2 presents coefficients from fixed effect models representing the RN HPPD difference-in-differences over time and testing the significance of the difference in trends observed in each of the figures. The pre- and postmandate periods are deconstructed into discrete episodes that mirror the figures. The time before 2004 consists of a “Pre-Mandate” period (1997–2001) and a “Ratios Released” period (2002–2003), during which the ratios were released and known to hospitals but before the mandate was implemented and enforced. The postmandate period was broken down to reflect the moments before (2004–2007), during (2008–2009) and after (2010–2016) the recession. The coefficients are the results of interactions with California and represent the change in RN HPPD attributed to California above and beyond that observed in other states. The reference categories in this table are California hospitals during the baseline period (either 1997–2001 premandate period or 2004–2007 prerecession period) and other states during and after these periods. The change in RN HPPD among hospitals in California was no different than among other states during the entire premandate period (Panel A). After the mandate was implemented in 2004, California hospitals increased their staffing to levels that exceeded those of California hospitals before the mandate and other hospitals before and after the mandate. This difference was significant before, during, and after the recession within the postmandate period. The effect size for the balanced sample more than doubled over time from 0.5 HPPD (30 minutes) in the prerecession period (standard error 0.1; p < .001) to 0.7 HPPD (42 minutes) during the recession (standard error 0.1; p < .001) to 1.3 HPPD (78 minutes) in the postrecession period (standard error 0.1; p < .001). These analyses were also conducted without entropy balancing and achieved similar results, which are displayed in the first column of Panel B.
Table 2 –
Difference-in-Differences and Period Fixed-Effect Estimates.
| Unweighted Controls | Entropy Balancing | ||||
|---|---|---|---|---|---|
| Premandate | Postmandate | ||||
| PANEL A: Premandate | |||||
| CA x Premandate | (1997–2001) | (ref.) | (ref.) | - | |
| CA x Ratios released | (2002–2003) | −0.12 (0.09) | −0.11 (0.09) | - | |
| PANEL B: Postmandate | |||||
| CA x Prerecession | (2004–2007) | 0.31* (0.08) | 0.47* (0.10) | (ref.) | |
| CA x Recession | (2008–2009) | 0.64* (0.10) | 0.73* (0.14) | 0.43* (0.11) | |
| CA x Postrecession | (2010–2016) | 1.13* (0.08) | 1.26* (0.10) | 1.00* (0.09) | |
“Unweighted” model controls for hospital bed size, teaching status, whether hospital is high-tech, hospital ownership, ratio of patients per bed, percentage of Medicare patients, percentage of Medicaid patients, and the HHI market competition index; “Entropy Balancing” models balance these same covariates for California and other states using a maximum entropy reweighting scheme employed as a data preprocessing technique.
p < .001
Discussion
These findings suggest that nurse staffing mandates increase RN HPPD above and beyond the national trend and may act as a safety net to protect these more robust staffing levels from deteriorating in challenging economic times. Prior to the implementation of California’s staffing ratios, changes in RN HPPD over time in California hospitals were comparable to those of other states. In the years following implementation of the mandate, staffing levels increased across all hospitals, but RN HPPD gains in California were substantially larger than in other states and the difference increased over time. This difference was attributed to California’s ability to maintain postmandate nurse staffing levels during the 2008 economic recession while other hospitals witnessed a decline in RN HPPD.
In the postrecession period, growth in RN HPPD resumed across all hospitals in our study, but California hospitals continued to diverge from the baseline and increase nurse staffing levels at a faster rate than other hospitals. The difference in staffing over this final period of the analysis amounted to more than doubling the gains achieved in the period immediately following the implementation of mandatory ratios. Such results indicate that the nurse staffing mandate in California not only stimulated growth in RN HPPD but also shielded nurse staffing from the effects of a recession.
Recessions are a natural, if not predictable, part of macroeconomic ebb and flow. Recessions represent an overall decline in the national economy, but the health care industry is historically counter-cyclical. The Great Recession of 2008 was no exception. Nursing employment experienced “steady and notable growth” between 2007 and 2010 in contrast to the rise in national unemployment during the same period (Dolfman et al., 2017). However, factors such as loss of employer sponsored health care coverage, reduction of government funding, and the overall detrimental impact of the 2008 recession constrained overall health care employment growth to a slower rate than in the past three recessions (Wood, 2011), adding to the debate on whether the nursing profession is truly “recession proof” (Gallo, 2009).
Nurses represent a large portion of hospital operating budgets. In the setting of economic recession, hospitals exercising fiscal restraint may be disinclined to increase their investment in nursing. Instead, they may make budget cuts. Our data suggest that RN HPPD are sensitive to recessions, especially in the absence of nurse staffing mandates. We find that RN HPPD decrease in hospitals without a staffing mandate and stagnate in hospitals with the mandate.
This study adds to existing literature on the impact of the California nurse mandate and betters our understanding of the impact of the 2008 recession on nurse staffing ratios. This buffering effect is important to patient safety and wellbeing, given the abundance of research linking nurse staffing to patient outcomes such as 30-day mortality. Some states have laws or regulations that address hospital nurse staffing (such as staffing committees or public reporting of staffing levels), but California remains the only state that requires a minimum nurse-to-patient ratio by unit type. Whether and how these other forms of legislation impact staffing is unknown and a subject for future research. States considering nurse staffing legislation should count the buffer against economic recessions among the benefits of such mandates.
Strengths and limitations
We used entropy balancing to improve the comparability of “California” and “other” hospital groups and difference-in-differences models to evaluate the policy effect of California’s staffing mandate. There are at least two limitations related to this approach. First, our combination of longitudinal data and entropy balancing does not account for potential unobserved time-varying variables that could differ between California and other hospitals. Second, while difference-in-differences models are widely accepted for policy analyses such as this, a recent evaluation of matching in the context of this method cautioned that entropy balancing techniques may introduce bias, specifically regression to the mean (Daw & Hatfield, 2018). Acknowledging this possibility, we conducted a sensitivity analysis, producing parallel models using unweighted data, and achieved equivalent results.
Implications
The countercyclical nature of nursing alone is insufficient to protect investments in nurse staffing and associated patient interests during economic recessions. Our findings demonstrate that nurse staffing mandates may act as a safeguard to ensure an adequate nursing workforce at the patient bedside. The California staffing mandate continues to stimulate growth in RN HPPD and helped protect nurse staffing investments during the 2008 economic recession. Policymakers deliberating staffing mandates should consider the protective factor such legislation provides during economic recessions. Nurse staffing mandates abroad have aimed to improve patient outcomes as in California (McHugh et al., 2020). How these foreign mandates mitigate the impact of economic recessions on nurse staffing in their respective countries remains unknown. The data in this study represent hospitals across the United States, but the generalizability to other countries may be limited and the subject of future research.
Staffing is a function of many factors, not all associated with the need for staffing, acuity of patients, or regulatory environments. Administrative choices and priorities, valuation of nursing, risk tolerance, labor market conditions, hospital financial conditions, past practices, and institutional precedent all contribute to staffing variations across hospitals. This is a part of the reason for instituting minimum ratio policies: they allow for variation but impose a minimum standard, limiting variation in the direction that evidence suggests negatively affects nursing practice. On average, California hospitals are better staffed than hospitals in other states, but this is not always true of individual hospitals. There are examples of hospitals outside of California that are better staffed than some California hospitals. Furthermore, estimates suggest that about half of California hospital medical-surgical units were already in compliance with the mandate at the time of its passage (Spetz, 2004). These show that good staffing can be accomplished without a mandate. The fact that the other half of California hospitals, even safety net hospitals (McHugh et al., 2012), were able to respond to comply with an unfunded mandate shows that hospitals can adjust their budgets and reprioritize as needed. We do not know how each hospital chose to adjust to comply with the mandate. Further analysis to better understand how California hospitals managed to maintain nurse staffing during an economic recession is warranted. We do know, however, that one response that was feared did not occur. There was initially concern that hospitals would prefer LVNs over RNs as a way of cutting costs but meeting the requirements; that did not happen (McHugh et al., 2011).
Conclusions
California’s nurse staffing mandate—the only one of its kind in the United States—demonstrated its potential to mitigate the impact of a national economic recession on hospital nurse staffing levels. The role of safe nurse staffing levels in achieving improved patient outcomes is well documented. Protecting investments in nursing staff and the associated quality, safety, and outcomes of care during vulnerable times of economic stress are important considerations for policymakers pursuing nurse staffing mandates.
Acknowledgments
Malia Meyer, for her assistance preparing this manuscript.
This work was supported by the National Institute of Nursing Research (grant number T32-NR-00714 to Linda Aiken).
REFERENCES
- Aiken LH, Clarke SP, Sloane DM, Sochalski J, & Silber JH (2002). Hospital nurse staffing and patient mortality, nurse burnout, and job dissatisfaction. JAMA, 288(16), 1987–1993, doi: 10.1001/jama.288.16.1987. [DOI] [PubMed] [Google Scholar]
- Aiken LH, Sloane DM, Bruyneel L, Van den Heede K, Griffiths P, Busse R, Diomidous M, Kinnunen J, Kozka M, Lesaffre E, McHugh MD, Moreno-Casbas MT, Rafferty AM, Schwendimann R, Scott PA, Tishelman C, Achterberg TV, & Sermeus W (2014). Nurse staffing and education and hospital mortality in nine European countries: A retrospective observational study. The Lancet, 383(9931), 1824–1830, doi: 10.1016/S0140-6736(13)62631-8. [DOI] [PMC free article] [PubMed] [Google Scholar]
- Aiken LH, Sloane DM, Cimiotti JP, Clarke SP, Flynn L, Seago JA, Spetz J, & Smith HL (2010). Implications of the California nurse staffing mandate for other states. Health Services Research, 45(4), 904–921. [DOI] [PMC free article] [PubMed] [Google Scholar]
- American Hospital Association. (2018). Trendwatch Chart-book 2018: Trends affecting hospitals and health systems. https://www.aha.org/system/files/2018-07/2018-aha-chartbook.pdf
- American Hospital Association. (2020). Data collection methods: American Hospital Association. AHA Data & Insights. https://www.ahadata.com/data-collection-methods/ [Google Scholar]
- Bazzoli GJ, Lindrooth RC, Hasnain-Wynia R, & Needleman J (2004). The balanced budget act of 1997 and US hospital operations. Inquiry, 41(4), 401–417, doi: 10.5034/inquiryjrnl_41.4.401. [DOI] [PubMed] [Google Scholar]
- Clark AV, LoPresti CM, & Smith TI (2018). Trends in inpatient admission comorbidity and electronic health data: Implications for resident workload intensity. Journal of Hospital Medicine, 13(8), 570–572, doi: 10.12788/jhm.2954. [DOI] [PubMed] [Google Scholar]
- Dall TM, Chen YJ, Seifert RF, Maddox PJ, & Hogan PF (2009). The economic value of professional nursing. Medical Care, 47(1), 97–104. [DOI] [PubMed] [Google Scholar]
- Daw JR, & Hatfield LA (2018). Matching and regression to the mean in difference-in differences analysis. Health Services Research, 53(6), 4138–4156, doi: 10.1111/1475-6773.12993. [DOI] [PMC free article] [PubMed] [Google Scholar]
- Dolfman ML, Insco M, & Holden RJ (2017). Nursing and the great recession. Monthly Labor Review, 140(1). [Google Scholar]
- Gallo K (2009). Is nursing recession-proof? MCN: The American Journal of Maternal/Child Nursing, 34(5), 274, doi: 10.1097/01.NMC.0000360415.54906.92. [DOI] [PubMed] [Google Scholar]
- Hainmueller J (2012). Entropy balancing for causal effects: A multivariate reweighting method to produce balanced samples in observational studies. Political analysis, 20(1), 25–46. [Google Scholar]
- Hainmueller J, & Xu Y (2013). Ebalance: A Stata package for entropy balancing. Journal of Statistical Software, 54(7), 1–18. [Google Scholar]
- Kane NM, & Siegrist RB (2002). Understanding rising hospital inpatient costs: Key components of cost and the impact of poor quality. https://pdfs.semanticscholar.org/05e2/640b427a5e112918e5ad1fcefe1b11488bf5.pdf
- Martin A, Lassman D, Whittle L, & Catlin A (2011). Recession contributes to slowest annual rate of increase in health spending in five decades. Health Affairs, 30(1), 11–22, doi: 10.1377/hlthaff.2010.1032. [DOI] [PubMed] [Google Scholar]
- McHugh MD, Aiken LH, Windsor C, Douglas C, & Yates P (2020). Case for hospital nurse-to-patient ratio legislation in Queensland, Australia, hospitals: An observational study. BMJ Open, 10(9) e036264, doi: 10.1136/bmjopen-2019-036264. [DOI] [PMC free article] [PubMed] [Google Scholar]
- McHugh MD, Brooks Carthon M, Sloane DM, Wu E, Kelly L, & Aiken LH (2012). Impact of nurse staffing mandates on safety-net hospitals: Lessons from California. The Milbank Quarterly, 90(1), 160–186, doi: 10.1111/j.14680009.2011.00658.x. [DOI] [PMC free article] [PubMed] [Google Scholar]
- McHugh MD, Kelly LA, Sloane DM, & Aiken LH (2011). Contradicting fears, California’s nurse-to-patient mandate did not reduce the skill level of the nursing workforce in hospitals. Health Affairs, 30(7), 1299–1306, doi: 10.1377/hlthaff.2010.1118. [DOI] [PMC free article] [PubMed] [Google Scholar]
- Needleman J, Buerhaus P, Mattke S, Stewart M, & Zelevinsky K (2002). Nurse-staffing levels and the quality of care in hospitals. New England Journal of Medicine, 346(22), 1715–1722, doi: 10.1056/NEJMsa012247. [DOI] [PubMed] [Google Scholar]
- Needleman J, Buerhaus P, Pankratz VS, Leibson CL, Stevens SR, & Harris M (2011). Nurse staffing and inpatient hospital mortality. New England Journal of Medicine, 364(11), 1037–1045, doi: 10.1056/NEJMsa1001025. [DOI] [PubMed] [Google Scholar]
- Reiter KL, Harless DW, Pink GH, & Mark BA (2012). Minimum nurse staffing legislation and the financial performance of California hospitals. Health Services Research, 47(3pt1), 1030–1050, doi: 10.1111/j.1475-6773.2011.01356.x. [DOI] [PMC free article] [PubMed] [Google Scholar]
- Rothschild JM, Bates DW, Franz C, Soukup JR, & Kaushal R (2009). The costs and savings associated with prevention of adverse events by critical care nurses. Journal of Critical Care, 24(3), doi: 10.1016/j.jcrc.2007.12.021471. e1–e7. [DOI] [PubMed] [Google Scholar]
- Spetz J (2004). California’s minimum nurse-to-patient ratios: The first few months. JONA: The Journal of Nursing Administration, 34(12), 571–578. [DOI] [PubMed] [Google Scholar]
- Spetz J, Donaldson N, Aydin C, & Brown DS (2008). How many nurses per patient? Measurements of nurse staffing in health services research. Health Services Research, 43(5p1), 1674–1692. [DOI] [PMC free article] [PubMed] [Google Scholar]
- Tung L (2019). Why mandated nurse-to-patient ratios have become one of the most controversial ideas in health care. whyy.org. https://whyy.org/segments/why-mandated-nurse-to-patient-ratios-have-become-one-of-the-most-controversial-ideas-in-health-care/. [Google Scholar]
- U.S. Bureau of Labor Statistics. (2012). BLS spotlight on statistics: The recession of 2007–2009. http://www.bls.gov/spotlight/2012/recession/pdf/recession_bls_spotlight.pdf.
- Wood CA (2011). Employment in health care: A crutch for the ailing economy during the 2007–09 recession. Monthly Labor Review, 134(4), 13–18. [Google Scholar]