Abstract
Alginate oligosaccharide (AOS) has the function to inhibit tumor progression and the sulfated modification can enhance the antitumor activity. To date, the function and mechanism of sulfated AOS (AOS-SO4) in tumors remain largely elusive. We prepared AOS by the enzymatic degradation of alginate, collected AOS-SO4 by sulfating following the canonical procedure. Using these materials, in vitro assays showed that both AOS and AOS-SO4 elicited antitumor effects in osteosarcoma cells. Sulfated modification significantly enhanced the antitumor activity. In addition, AOS-SO4 had obvious effects on cell cycle arrest, apoptosis, and autophagy induction in vitro and in vivo. Mechanistically, we observed that AOS-SO4 treatment triggered proapoptotic autophagy by inhibiting MEK1/ERK/mTOR signaling. The ERK activator reversed AOS-SO4-induced autophagy. More importantly, we found that KSR1 interacted with MEK1 and functioned as a positive regulator of MEK1 protein in osteosarcoma cells. High KSR1 expression was significantly associated with poor survival in osteosarcoma patients. Together, these results suggest that AOS-SO4 has a better antitumor effect in osteosarcoma by inhibiting MEK1/ERK/mTOR signaling, which is KSR1-dependent; thus, AOS-SO4 can be a new potential therapeutic candidate for the treatment of osteosarcoma.
Subject terms: Bone cancer, Chemotherapy
Introduction
Osteosarcoma is the most frequent primary bone tumor in children and adolescents. The overall incidence is 3.4 per million per year worldwide [1]. According to Surveillance, Epidemiology and End Results–US National Cancer Institute (SEER) statistics, new incidents have been rising by 0.4% per year in the last decade [2]. With the introduction of neoadjuvant chemotherapy, standard multiagent chemotherapy combined with surgical resection yields long-term survival rates of 70% [3]. However, during the past three decades, the survival rate has basically progressed slowly [4]. Metastatic disease either at diagnosis or at the time of recurrence portends a poor prognosis with a survival of 20–30% [5, 6]. For the treatment of osteosarcoma, multidrug resistance is a common problem, and there has been no successful targeted treatment of osteosarcoma. Therefore, it is urgent to optimize treatment strategies and develop new therapeutic agents for osteosarcoma patients.
Alginate is a natural carbohydrate polymer and consists of β-D-mannuronic acid and α-L-guluronic acid linked via 1,4-glycosidic bonds [7]. Alginate exists widely in various brown seaweeds. Alginate and alginate-derived polymannuronate (PM) and polyguluronate (PG) can be further depolymerized into AOS with various structures through enzymatic digestion, acid hydrolysis, and oxidative reductive free-radical depolymerization [8]. AOS, as a water-soluble functional oligomer, has been regarded as a non-toxic and biodegradable polymer. Furthermore, AOS displays a wide variety of physiological activities such as immunomodulatory [9], neuroprotective [10], anti-inflammatory [11], antioxidant [12], and antitumor [13] effects. Alginate oligosaccharide (AOS degree- polymerized, DP = 2–10) has been demonstrated to attenuate the progression of human prostate cancer cells through the suppression of the Hippo/YAP/c‐Jun pathway [14]. In addition, Chen [15] reported that AOS (DP = 2–5) could suppress osteosarcoma progression and might be used as a potential drug for osteosarcoma therapy. Researchers report that sulfated oligosaccharides have better antitumor activity. The sulfated oligosaccharide from sargassum fusiform has been found to have the ability to enhance antitumor activities in Sarcoma 180 tumors [16, 17]. Whether sulfate modification can improve the antitumor activity of AOS has not been reported. Thus, in this study, we wanted to compare the antitumor activity of AOS and AOS-SO4 and investigate the underlying mechanism of AOS-SO4.
Autophagy is a highly conserved catabolic process that includes the formation of phagophores and autophagosomes and fusion with lysosomes [18, 19]. The role of autophagy in tumor progression is complex. Several studies have suggested that apoptosis and autophagy are interrelated and affect each other [20, 21]. In recent years, several natural organic compounds have been reported to exert their anticancer activities by inducing autophagy in tumor cells [22, 23]. MEK/ERK is an important pathway that promotes cell survival and is involved in the regulation of autophagy in mammalian cells [24, 25]. ERK and its upstream kinase MEK enhance autophagy by promoting the production of the Beclin1 protein [26]. mTOR kinase inhibits multiple autophagy-promoting proteins via phosphorylation and has been shown to be the most crucial effector and therapeutic target [27]. Some pathways, including the Akt and MEK/ERK signaling pathways, can activate mTOR kinase and inhibit autophagy [28]. KSR1, as a crucial scaffolding protein, has been shown to promote cell proliferation and oncogenic potential by enhancing signaling activation through the RAS/RAF pathway [29]. Several studies have shown that KSR1 acts downstream of RAS as a molecular scaffold for the Raf/MEK/ERK kinase cascade and interacts with MEK to promote the activation of MEK and ERK [30]. To date, the function of KSR1 in osteosarcoma remains unknown, especially whether KSR1 plays a critical role in AOS-SO4-mediated antitumor activity.
Therefore, according to previous research on the antitumor effect of AOS and the relationship between the occurrence of osteosarcoma and autophagy, we reasonably speculated that AOS-SO4 had better antitumor activity and that AOS-SO4 inhibited the progression of osteosarcoma by inducing autophagy. Here, our study will demonstrate the antitumor effect of AOS-SO4 on osteosarcoma and find the internal connection between AOS-SO4 and autophagy.
Results
Characterization of AOS
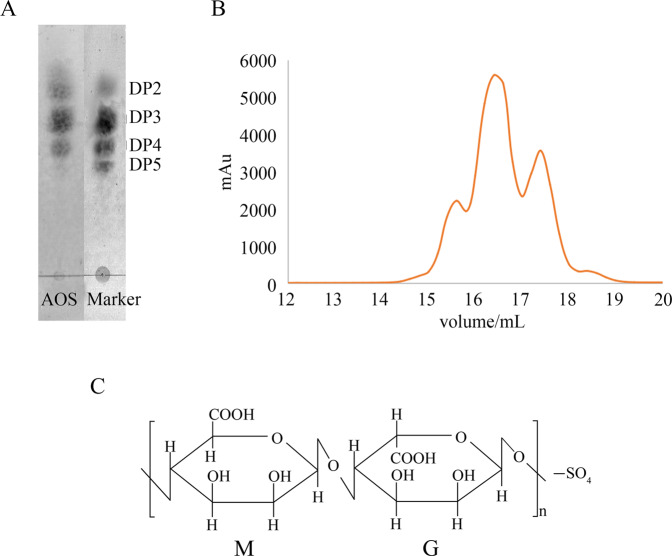
The thin-layer chromatography (TLC) assay and the size exclusion chromatography assay were used to identify the composition of AOS. The TLC assay qualitatively showed the fraction distribution (Fig. 1A). The molecular weight marker was made by the lab, which was confirmed by mass spectrometry. The resulting AOS fraction distribution analysis showed that the product contains tetramers (13.3%), trimers (58.1%), and dimers (28.6%), which was determined by size exclusion chromatography [31], as shown in Fig. 1B. The sulfur content of AOS-SO4 is ~11.77% (w/w), which was determined using the oxygen flask combustion-chemical titration method. A schematic representation of the molecular structure of AOS and AOS-SO4 prepared by enzymatic degradation is shown in Fig. 1C.
Fig. 1. Characterization of AOS.
A The composition of AOS was identified by TLC assay. B Size exclusion chromatography was performed using an ÄKTA purifier system. The prepared alginate oligosaccharides were loaded onto a Sephadex G-15 column monitored at 235 nm, which was eluted with 0.2 M ammonium bicarbonate at a flow rate of 0.3 ml/min. C Schematic representation of the molecular structure of AOS and sulfated AOS (AOS-SO4) prepared by enzymatic degradation.
AOS-SO4 has better antitumor activity in osteosarcoma cells in vitro
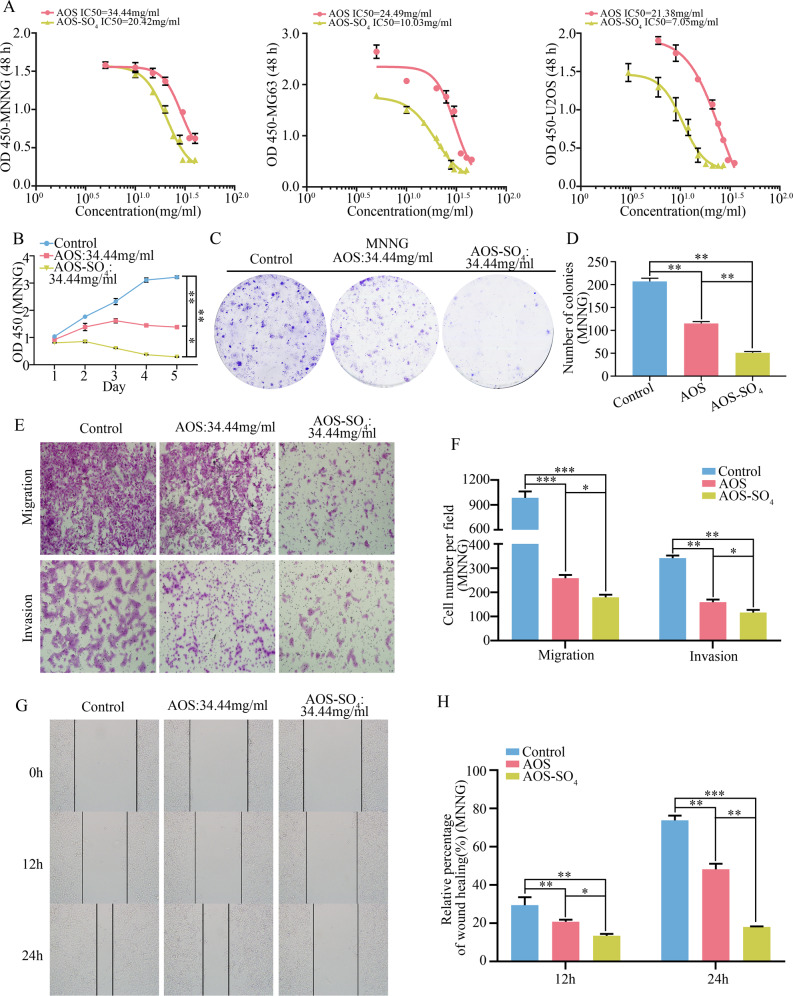
We investigated the growth inhibitory effect of AOS and AOS-SO4 against osteosarcoma cells (MNNG, MG63, and U2OS) in vitro. The half-maximal inhibitory concentration (IC50) values of AOS and AOS-SO4 at 48 h in the three cell lines were analyzed by GraphPad Prism 8 (Fig. 2A). For AOS, the IC50 values were 34.44 mg/ml, 24.49 mg/ml, and 21.38 mg/ml; for AOS-SO4, they were 20.42 mg/ml, 10.03 mg/ml, and 7.05 mg/ml (MNNG, MG63, and U2OS, respectively). Then, we used the same concentration of AOS (34.44 mg/ml) to compare the antiproliferative capacity of both compounds. The results showed that AOS and AOS-SO4 significantly inhibited the growth of osteosarcoma cells and the effect of AOS-SO4 was more effective than AOS (Fig. 2B; Supplementary Fig. 1, A, and B). Similarly, findings from the colony formation assay showed that AOS-SO4 more attenuated the formation of cell colonies than AOS (Fig. 2C and D; Supplementary Fig. 1C–E). Furthermore, transwell assays and wound-healing assays were conducted to determine whether AOS and AOS-SO4 inhibited the migration and invasion of tumor cells. AOS and AOS-SO4 significantly suppressed the migration and invasion of osteosarcoma cells and the effect of AOS-SO4 was more effective than AOS (Fig. 2E and F; Supplementary Fig. 1, F–I), and the wound gap was wider in the AOS-SO4 treatment group in MNNG cells (Fig. 2G and H). All these results suggested that osteosarcoma cells displayed effectiveness against AOS and AOS-SO4 in a concentration-dependent manner. More importantly, AOS-SO4 had a lower IC50 and better antitumor activity than AOS. This result demonstrated that sulfated modification of AOS exhibited a stronger antitumor effect in growth and metastasis in vitro.
Fig. 2. AOS-SO4 has better antitumor activity in osteosarcoma cells in vitro.
A In vitro osteosarcoma cells were treated with AOS and AOS-SO4 at different concentrations (the range was from 0 to 45 mg/ml) for 48 h, and the IC50 was calculated. B A CCK-8 assay was used to detect the proliferation of osteosarcoma cells after treatment with AOS and AOS-SO4. C, D Colony formation assays in osteosarcoma cells after treatment with AOS and AOS-SO4 (magnification, ×40). E, F Transwell migration and invasion assays in osteosarcoma cells after treatment with AOS and AOS-SO4 (magnification, ×200). G, H A wound-healing assay was used to determine cell migration after treatment with AOS and AOS-SO4, and the wound migration distance was calculated (magnification, ×200). Data are shown as the means ± SD from at least three independent experiments. Statistical analysis was performed using Student’s t-test. Error bars represent the SEM. **P < 0.01; ***P < 0.001.
AOS-SO4 affects the osteosarcoma cell cycle and apoptosis in vitro and inhibits osteosarcoma cell growth and metastasis in vivo
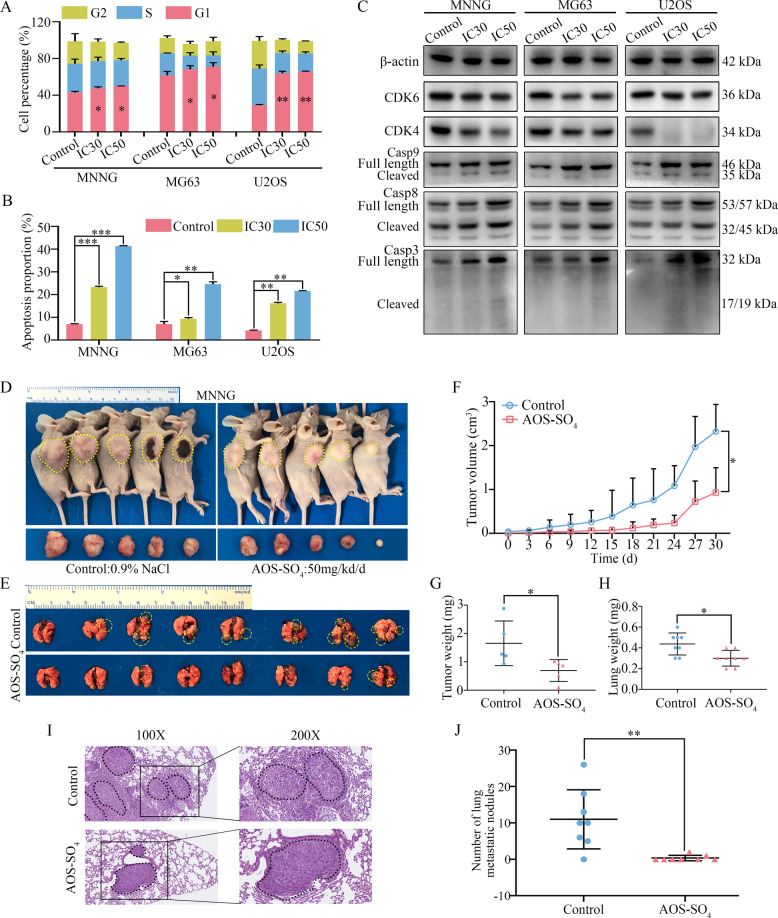
Next, we focused on the antitumor activity of AOS-SO4 in vitro and in vivo. The IC30 of AOS-SO4 at 48 h in three cell lines (MNNG: 13.27 mg/ml; MG63: 4.85 mg/ml; U2OS: 3.46 mg/ml) was calculated. First, flow cytometry was used to evaluate cell cycle distribution. As shown in Fig. 3A, osteosarcoma cells were arrested at G1 phase after treatment with the IC30 and IC50 AOS-SO4 for 48 h (Supplementary Fig. 2A). Annexin V‐FITC/PI double‐staining analysis showed that the percentages of apoptotic cells were dramatically increased after incubation with the IC30 and IC50 AOS-SO4 for 48 h (Fig. 3B; Supplementary Fig. 2B). Western blot analysis demonstrated that the expression of cyclin-dependent kinase 4 (CDK4) and cyclin-dependent kinase 6 (CDK6), which were the main cell cycle regulators in the G1 phase, was significantly downregulated after treatment with the IC30 and IC50 AOS-SO4 (Fig. 3C; Supplementary Fig. 2C). Meanwhile, after treatment with AOS-SO4, the expression of cleaved caspase‐9, ‐8, and ‐3 was increased after exposure to AOS-SO4 (Fig. 3C; Supplementary Fig. 2C). Then, we established a subcutaneous transplantation model and a lung metastasis model by transplanting MNNG cells into nude mice subcutaneously or injecting them into the lateral tail veins of nude mice to confirm the potential antitumor effect of AOS-SO4 in vivo. A week after injection, the mice were randomly divided into two groups: control (0.9% NaCl) and AOS-SO4 (50 mg/kg/d), followed by gavage with AOS-SO4 every other day for 30 days (subcutaneous transplantation model) or 45 days (lung metastasis model). The results demonstrated that AOS-SO4 inhibited tumor growth and lung metastasis (Fig. 3D and E). AOS-SO4 significantly decreased the tumor volume (Fig. 3F) and tumor weight (Fig. 3G) and had no effect on the bodyweight of the mice (Supplementary Fig. 2D) in the subcutaneous transplantation model. In addition, the lung weight of the AOS-SO4 group was lower due to fewer lung metastatic nodules (Fig. 3H). AOS-SO4 significantly decreased the number of lung metastatic nodules (Fig. 3I and J) and had no effect on the bodyweight of the mice in the lung metastasis model (Supplementary Fig. 2E). HE stained the heart, liver, spleen, lung, and kidney and the results showed that there was no toxicity in AOS-SO4-treated mice (Supplementary Fig. 3A). Taken together, we concluded that AOS-SO4 dramatically hindered the tumorigenesis and lung metastasis of osteosarcoma cells in vitro and in vivo.
Fig. 3. AOS-SO4 affects the osteosarcoma cell cycle and apoptosis in vitro and inhibits osteosarcoma cell growth and metastasis in vivo.
A Flow cytometry histograms of the cell cycle in each phase after treatment with AOS-SO4 showing G1 phase arrest. B Flow cytometry histograms of cell apoptosis distribution after treatment with AOS-SO4 for 48 h. C After treatment with AOS-SO4, proteins were extracted from three cultured osteosarcoma cells and probed with appropriate dilutions of specific antibodies. Representative results of CDK4, CDK6, full length and cleavage of caspase‐9, ‐8, and ‐3 protein levels were determined by western blot analysis. D Photograph of tumor-bearing mice (injected by MNNG cell) and photograph of tumors after the mice were euthanized. E Lung metastasis formed by MNNG cells in the AOS-SO4 treatment and control groups. F Growth curve drawn by measuring tumor volumes on the indicated days. G Diagram showing the tumor weights in the subcutaneous tumor model. H Diagram showing the lung weights in the control group and AOS-SO4 treatment group. I HE staining of lung samples obtained from nude mice after injection with MNNG cells. J Statistical analysis of lung metastasis nodules in the AOS-SO4 and control groups. Data are shown as the means ± SD from at least three independent experiments. Statistical analysis was performed using Student’s t-test. Error bars represent the SEM. *P < 0.05; **P < 0.01; ***P < 0.001.
AOS-SO4 promotes autophagy in osteosarcoma cells
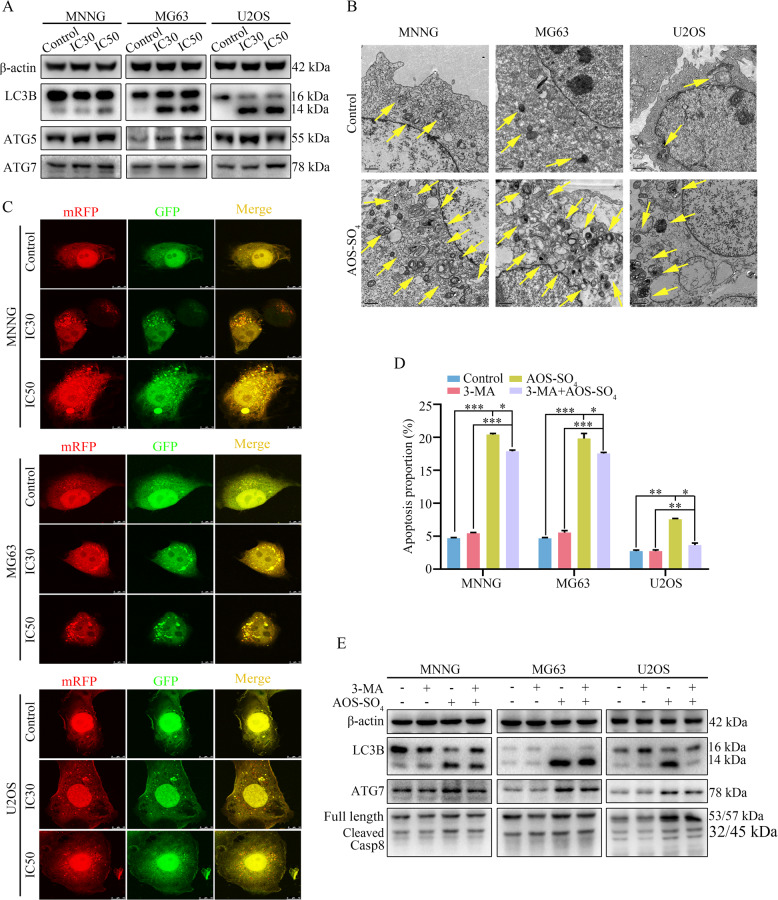
To further elucidate the biological functions of AOS-SO4 in osteosarcoma, we examined the autophagy-inducing activity of AOS-SO4 in osteosarcoma cell lines. Autophagy-related proteins were analyzed using western blotting, and the results revealed that AOS-SO4 caused a significant increase in microtubule-associated proteins 1 A/1B; (LC3B), autophagy-related protein 5 (ATG5), and autophagy-related protein7 (ATG7) (Fig. 4A; Supplementary Fig. 3B). In addition, to directly demonstrate autophagosome formation, we used transmission electron microscopy (TEM) to observe numerous large autophagic vacuoles in the cytoplasm, in which the vacuolar contents were degraded, providing evidence for the impact of AOS-SO4 in the regulation of autophagic formation in osteosarcoma after treatment with the IC30 and IC50 of AOS-SO4 (Fig. 4B). Next, we utilized the mRFP-GFP-LC3 adenovirus construct to further confirm autophagy induction by forming puncta. In the present study, after infection with the mRFP-GFP-LC3 adenovirus, we observed the successful introduction of this adenovirus, showing both fluorescent proteins (Fig. 4C; Supplementary Fig. 3C). The numbers of yellow and free red puncta were both significantly higher after treatment with AOS-SO4, indicating increased autophagosomes and autolysosomes. In addition, the autophagy inhibitor 3-methyladenine (3-MA) was applied to osteosarcoma cells, and AOS-SO4-induced apoptosis was blocked by 3-MA (Fig. 4D; Supplementary Fig. 3D). As shown in Fig. 4E and Supplementary Fig. 3E, 3-MA diminished LC3B, ATG7, and cleavage of caspase‐8 induced by AOS-SO4. Therefore, these data suggested that AOS-SO4 promoted autophagy in osteosarcoma cells.
Fig. 4. AOS-SO4 promotes autophagy in osteosarcoma cells.
A After treatment with AOS-SO4 for 48 h, the protein levels of LC3B, ATG5, and ATG7 were assayed by western blot in osteosarcoma cells. B In parallel, autophagosome-like structures (indicated by the yellow arrows) were assayed by TEM. C LC3 puncta were analyzed by the mRFP-GFP-LC3 construct. D Osteosarcoma cells were treated with AOS-SO4 for 48 h with or without 3-MA (0.5 mM, 2 h), and flow cytometry was used to analyze apoptosis. E Representative blots of LC3B, ATG7, and Casp8 in MNNG, MG63, and U2OS cells after treated with AOS-SO4 for 48 h with or without 3-MA. Data are shown as the means ± SD from at least three independent experiments. Statistical analysis was performed using Student’s t-test. Error bars represent the SEM. *P < 0.05; **P < 0.01; ***P < 0.001.
AOS-SO4 promotes autophagy and induces apoptosis through the inactivation of the MEK1/ERK/mTOR signaling pathway
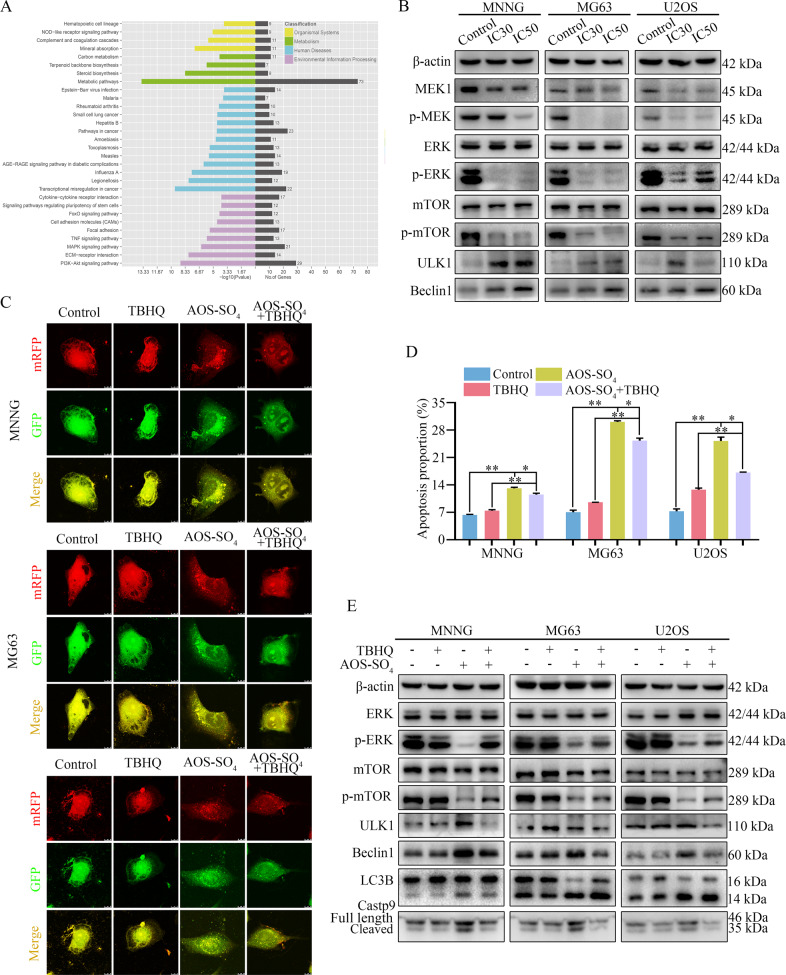
To explore the underlying signaling pathway affected by AOS-SO4, RNA-seq analysis was performed in MNNG cells. The volcano plot analysis revealed that 757 upregulated and 1083 downregulated genes were identified and quantified (Supplementary Fig. 4A). Then, 16 upregulated genes and 11 downregulated genes were chosen to verify the results of the RNA-seq analysis, and the changes were shown in the heat map (Supplementary Fig. 4, B and C). Next, Kyoto Encyclopedia of Genes and Genomes (KEGG) pathway analysis was performed based on RNA-Seq data. The results showed that AOS-SO4 was related to the MAPK signaling pathway, which plays a pivotal role in autophagy (Fig. 5A). Additionally, combined with mTOR, the MEK/ERK/mTOR signaling pathway has been recognized as a central signaling pathway coordinating autophagy. Next, we examined the changes in key node proteins of this pathway and autophagy-related proteins by western blotting. The results showed that the proteins p-MEK, p-ERK, and p-mTOR were significantly downregulated, and the autophagy-related proteins unc-51-like kinase 1 (ULK1) and Beclin1 were upregulated (Fig. 5B; Supplementary Fig. 4D). Moreover, we used the ERK activator tert-butylhydroquinone (TBHQ) to determine the role of MEK1/ERK/mTOR signaling in AOS-SO4-mediated antitumor activity. When TBHQ was combined with AOS-SO4, autophagic flux analysis showed that the numbers of yellow and free red puncta were both decreased (Fig. 5C; Supplementary Fig. 5A), and flow cytometry showed that apoptosis was reduced (Fig. 5D; Supplementary Fig. 5B). The expression of p-ERK, p-mTOR, ULK1, Beclin1, LC3B, and cleavage of caspase‐9 was significantly restored (Fig. 5E; Supplementary Fig. 5C). These results implied that TBHQ treatment restored AOS-SO4-induced cell autophagy and apoptosis. Thus, AOS-SO4 promoted cell autophagy and induced apoptosis through the inactivation of the MEK1/ERK/mTOR pathway.
Fig. 5. AOS-SO4 promotes autophagy and induces apoptosis through the MEK1/ERK/mTOR signaling pathway.
A KEGG pathway analysis of the differentially expressed genes in AOS-SO4-treated MNNG cells and control cells. B Representative blots showing the protein expression of MEK1, p-MEK1 ERK, p-ERK, mTOR, p-mTOR, and LC3B after treatment with AOS-SO4. C Osteosarcoma cells were treated with AOS-SO4 for 48 h with or without TBHQ, and LC3 puncta were analyzed by the mRFP-GFP-LC3 construct. D Apoptosis was assessed by flow cytometry analysis after treatment with AOS-SO4 for 48 h with or without TBHQ. E Representative blots of p-ERK, p-mTOR, ULK1, Beclin1, LC3B, and Casp9 in MNNG, MG63, and U2OS cells after treated with AOS-SO4 for 48 h with or without TBHQ. Data are shown as the means ± SD from at least three independent experiments. Statistical analysis was performed using Student’s t-test. Error bars represent the SEM. *P < 0.05; **P < 0.01.
AOS-SO4 suppresses osteosarcoma cell growth through the MEK1/ERK/mTOR signaling pathway in vivo
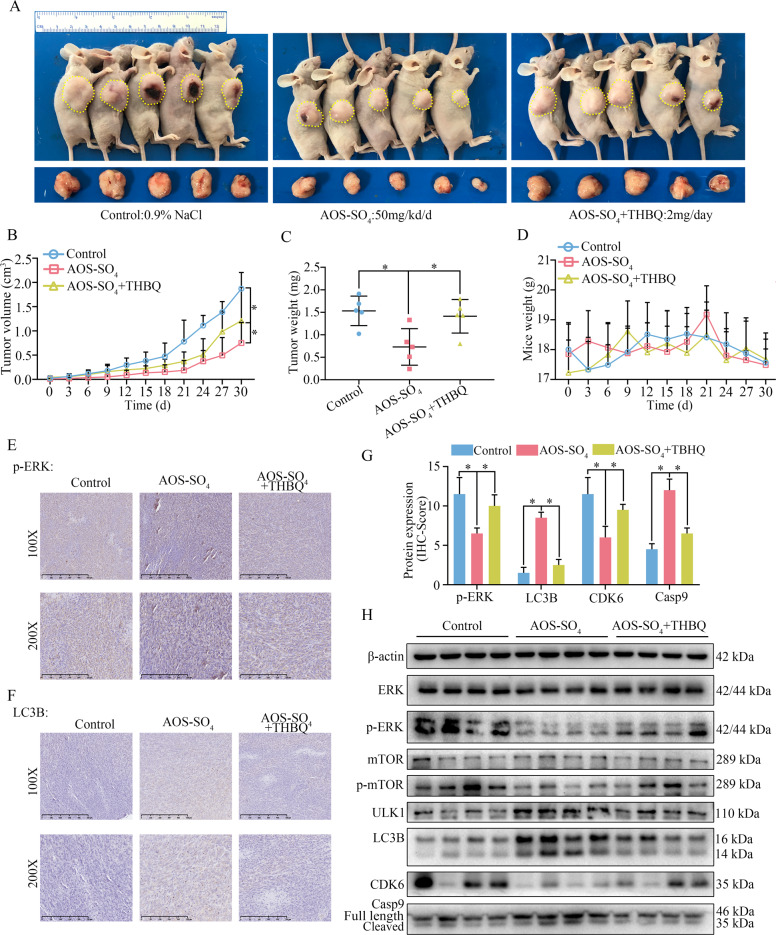
According to the previous description, we established a tumor xenograft model by transplanting MNNG cells into nude mice subcutaneously. A week later, the mice were randomly divided into three groups: control (0.9% NaCl), AOS-SO4 (50 mg/kg/d), and AOS-SO4 (50 mg/kg/d) + TBHQ (2 mg/d), followed by gavage every other day for 30 days. The results demonstrated that TBHQ treatment could restore the tumor growth inhibited by AOS-SO4 (Fig. 6A). TBHQ significantly restored the tumor volume and tumor weight and had no effect on the bodyweight of the mice (Fig. 6B–D). Next, three groups of specimens were fixed in formalin for IHC staining, and four samples of each group were submerged in liquid nitrogen for cryo-etching for western blot analysis. The immunohistochemistry (IHC) analysis indicated that CDK6 and p-ERK were lower and that the staining of LC3B and caspase-9 was higher in the AOS-SO4 group than in the control group. TBHQ treatment restored these results (Fig. 6E–G; Supplementary Fig. 5, D and E). In addition, western blot results showed that CDK6, p-ERK, and p-mTOR proteins were markedly downregulated; ULK1, LC3B, and cleavage of caspase‐9 were upregulated in the AOS-SO4 group compared with the control (Fig. 6H; Supplementary Fig. 6A). Equally, the TBHQ restored these results. Taken together, we concluded that AOS-SO4 suppressed osteosarcoma cell growth and promoted autophagy through the MEK1/ERK/mTOR signaling pathway in vivo.
Fig. 6. AOS-SO4 inhibits osteosarcoma cell growth through the MEK1/ERK/mTOR pathway in vivo.
A Photograph of tumor-bearing mice and photograph of tumors after the mice were euthanized in the control group, AOS-SO4 group and AOS-SO4 + THBQ group. B Growth curve drawn by measuring tumor volumes on the indicated days. C Diagram showing the tumor weights in the subcutaneous tumor model. D Diagram showing the mouse weight in the subcutaneous tumor model. E, F Representative images of p-ERK and LC3B staining in the subcutaneous tumor model. G The quantification of IHC staining about the protein expression of p-ERK, LC3B, CDK6, and Casp9. H Protein levels of proliferation, apoptosis, autophagy, and phosphorylated ERK and mTOR in tumor tissues in the three groups. Statistical analysis was performed using Student’s t-test. Error bars represent the SEM. *P < 0.05.
KSR1 interacts with MEK1 in osteosarcoma cells and is a prognostic marker for osteosarcoma
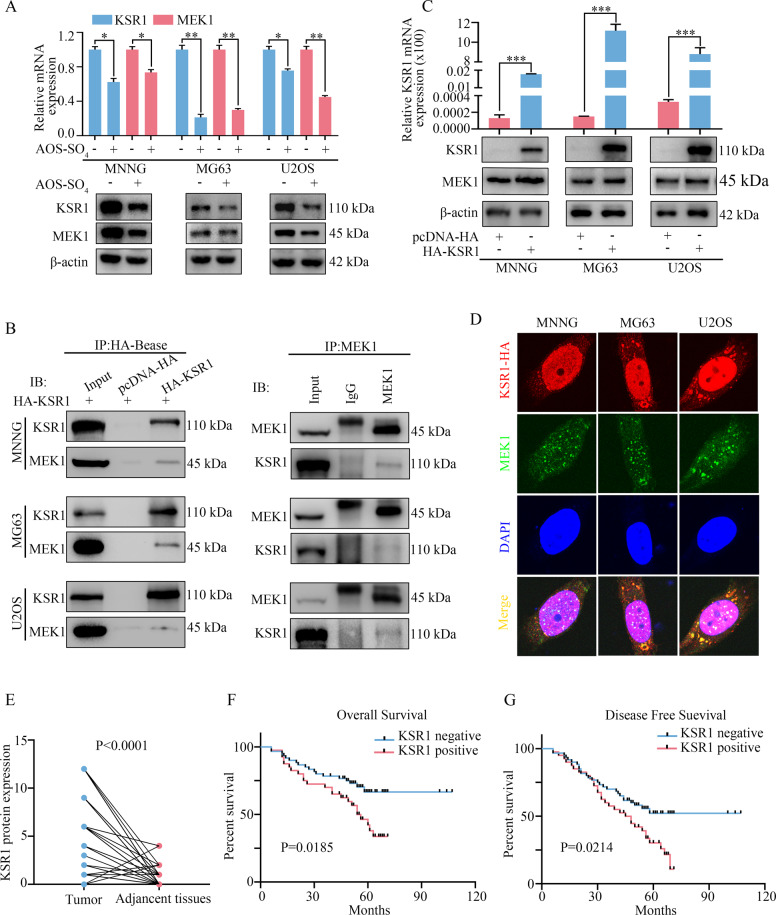
To further determine how AOS-SO4 regulated the MEK1/ERK/mTOR pathway in osteosarcoma, the protein interacting with MEK1 was searched in PubMed. Several researchers have reported that the kinase suppressor of ras 1 (KSR1) interacts with MEK1 and that KSR1 also plays a critical role in autophagy formation. Meanwhile, the STRING website revealed that KSR1 interacted with MEK1/2 (https://www.string-db.org/). Therefore, we detected the mRNA and protein expression of KSR1 and MEK1 after AOS-SO4 treatment. The results revealed that the mRNA and protein expression of KSR1 and MEK1 were significantly decreased (Fig. 7A). To further determine the interaction of KSR1 and MEK1, we constructed a pcDNA 3.1-HA-KSR1 plasmid. Coimmunoprecipitation Co-IP and western blot analysis were performed, and the results revealed that MEK1 coimmunoprecipitated with the KSR1 protein in osteosarcoma cells (Fig. 7B). In addition, after transfection with HA-tagged KSR1 in osteosarcoma cells, the mRNA and protein expression of KSR1 and MEK1 was significantly upregulated (Fig. 7C). Therefore, KSR1 could positively regulate the expression of MEK1 in osteosarcoma cells. Furthermore, the confocal analysis revealed that KSR1 and MEK1 were colocalized in osteosarcoma cells (Fig. 7D). These results indicated that KSR1 specifically interacted with MEK1 in osteosarcoma cells. To determine the clinicopathological significance of KSR1 in osteosarcoma patients, we performed an IHC analysis of KSR1 in a tissue microarray that included an independent set of 100 pairs of osteosarcoma tissues and adjacent nontumor tissues. The data of 100 osteosarcoma patients were shown in Supplementary Table 1. Representative IHC images of KSR1 expression were shown in Supplementary Fig. 6C. Immunohistochemical scores were scored in accordance with the percentage of positive cells under the microscope and the intensity of staining, and the results showed that the scores of KSR1 in tumor tissues were higher than the scores of KSR1 in adjacent tissues (Fig. 7E). Importantly, univariate analysis showed that KSR1 expression negatively correlated with overall survival and disease-free survival in 100 osteosarcoma patients (P < 0.05; Fig. 7F and G).
Fig. 7. KSR1 interacts with MEK1 in osteosarcoma cells and is a prognostic marker for osteosarcoma.
A The relative mRNA and protein expression levels of KSR1 and MEK1 after treatment with AOS-SO4. B Immunoprecipitation was carried out using anti-HA antibody and anti-MEK1 antibody, and specific associations between KSR1 and MEK1 were analyzed by western blot in osteosarcoma cells transfected with plasmids encoding HA-tagged KSR1. C The relative KSR1 mRNA expression and the KSR1 and MEK1 protein expression were detected after transfection with the pcDNA 3.1-HA-KSR1 plasmid. pcDNA 3.1-HA was used as a negative control. D Immunofluorescence analysis was performed using anti-HA and anti-MEK1 antibodies. DAPI was used as a control for nuclear staining. E KSR1 protein expression in 100 pairs of osteosarcoma tissues and adjacent nontumor tissues. F, G The effects of KSR1 expression level on overall survival and disease-free survival of patients with osteosarcoma. Data are shown as the means ± SD from at least three independent experiments. Statistical analysis was performed using Student’s t-test (A, C, E) and Log-rank test (F, G). Error bars represent the SEM. *P < 0.05, **P < 0.01; ***P < 0.001.
KSR1 overexpression restores the induction of autophagy and inhibition of the MEK1/ERK/mTOR signaling pathway by AOS-SO4 treatment
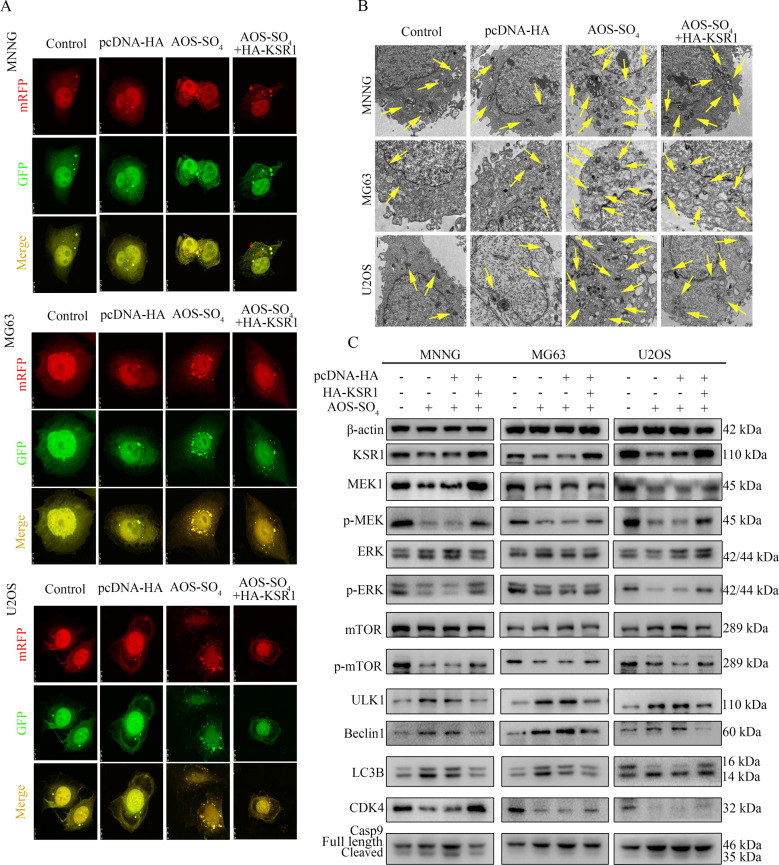
Finally, to test the role of KSR1 in AOS-SO4-mediated antitumor activity, we examined the activity of autophagy in HA-tagged KSR1-transfected cells after AOS-SO4 treatment. After infection with the mRFP-GFP-LC3 adenovirus, the numbers of yellow and free red puncta in the HA-KSR1 + AOS-SO4 group were both significantly lower than the numbers of yellow and free red puncta in the AOS-SO4 group, indicating that autophagosomes and autolysosomes decreased (Fig. 8A; Supplementary Fig. 6B). In addition, we observed that there were fewer autophagic vacuoles in the cytoplasm in the HA-KSR1 + AOS-SO4 group than in the AOS-SO4 group (Fig. 8B). Additionally, western blot analysis revealed that KSR1 overexpression restored the downregulation of MEK1, p-MEK, p-ERK, p-mTOR, and CDK4, and the upregulation of ULK1, Beclin1, LC3B, and cleavage of caspase‐9 caused by AOS-SO4 treatment (Fig. 8C; Supplementary Fig. 6D). These results revealed that KSR1 overexpression restores the induction of autophagy and inhibition of the MEK1/ERK/mTOR signaling pathway by AOS-SO4 treatment.
Fig. 8. KSR1 overexpression restores the induction of autophagy and inhibition of the MEK1/ERK/mTOR signaling pathway by AOS-SO4 treatment.
A Osteosarcoma cells were treated with AOS-SO4 for 48 h with or without transfection with HA-KSR1, and LC3 puncta were analyzed by the mRFP-GFP-LC3 construct. B Autophagosome-like structures (indicated by the yellow arrows) were assayed by TEM. C Protein levels of proliferation, apoptosis, autophagy, and KSR1, MEK1, and p-ERK in cells treated with AOS-SO4 for 48 h with or without transfection with the HA-KSR1 plasmid. Data are shown as the means ± SD from at least three independent experiments.
In conclusion, sulfated alginate oligosaccharide exerts antitumor activity and autophagy induction by inactivating MEK1/ERK/mTOR signaling in a KSR1-dependent manner in osteosarcoma.
Discussion
Osteosarcoma is the most common type of primary bone cancer and affects children and adolescents worldwide. The most important problem is that survival rates have changed little over the past decades because no effective new drug can be used [32, 33]. AOS is a natural extract and has many biological functions, such as antitumor properties [14], regulation of immune responses [34], and reduced lipid levels [35]. AOS has been found to be widely used in the agricultural, food, and pharmaceutical industries [36]. In this study, AOS was prepared by the enzymatic degradation of alginate. Then, the oligosaccharide was sulfated to obtain AOS-SO4. The resulting alginate oligosaccharide fraction distribution analysis showed that the product contained tetramers (13.3%), trimers (58.1%), and dimers (28.6%), as determined by size exclusion chromatography, and the sulfurous content was ~11.77% (w/w).
AOS has been reported to be able to effectively inhibit the proliferation of osteosarcoma [15]. Sulfated derivatives of AOS have more potent antitumor activity [16, 17]. However, whether AOS-SO4 has better antitumor activity and the underlying mechanism have not been reported in osteosarcoma. In the current study, we first reported that AOS-SO4 had better antitumor activity than AOS in osteosarcoma. The flow cytometry assay demonstrated that AOS-SO4 induced cell cycle arrest in the G1 phase and promoted apoptosis in osteosarcoma cells. Furthermore, in subcutaneous tumors, the size and weight of the tumors formed by MNNG cells were found to be significantly decreased after treatment with AOS-SO4. In addition, in the lung metastasis model, there was a significant decrease in lung metastasis nodules in the AOS-SO4 group. From these results, we concluded that AOS-SO4 could inhibit the proliferation and metastasis and promote apoptosis of osteosarcoma in vitro and in vivo.
Accumulated data indicate that autophagy behaves as a two-edged sword in cancer, providing protection or causing damage to cells [20, 21]. Autophagy plays an adaptive role in protecting organisms from various types of pathological damage [37]. Autophagy is a highly regulated process involving several key mediators. Several autophagy-related genes (Atg) participate in this process. Beclin1 is a mammalian-specific Atg (also aided by ATG7 and ATG10) that plays an important role in autophagy and the development of tumors [38]. An additional protein participating in autophagy regulation is cytosolic microtubule-associated protein light chain 3 (LC3), which is an important marker of autophagy. During autophagy, LC3-I is hydrolyzed and converted to LC3-II [39]. Therefore, the ratio of LC3-II/LC3-I expression could reflect the level of autophagy. Our experimental results showed that the LC3-II/LC3-I ratio was upregulated, which confirmed that autophagy was promoted after AOS-SO4 treatment. In addition, TEM and autophagic flux experiments indicated that autophagosomes and autophagic flux were increased in AOS-SO4-treated osteosarcoma cells. Furthermore, we used the autophagy inhibitor 3-MA to further explore the mechanism of autophagy. 3-MA inhibits autophagy by inhibiting the formation of autophagosomes. After adding 3-MA, LC3B and Atg7 expressions were downregulated compared with AOS-SO4 treatment alone. Notably, the apoptosis rate of the AOS-SO4 + 3-MA group decreased synchronously, possibly because autophagy enhanced caspase-dependent cell death and induced cell death. The 3-MA inhibited autophagy from the initial stage, thus reducing cell death.
To further explore the underlying mechanism, RNA-seq analysis and bioinformatics analysis revealed that AOS-SO4 was related to the MAPK signaling pathway. The MAPK/mTOR pathway is commonly known to be related to autophagy and apoptosis [40, 41]. And, our results showed that AOS-SO4 inhibited the MEK1/ERK/mTOR signaling pathway. The MEK/ERK/mTOR signaling pathway is a classical pathway that not only promotes angiogenesis and cell progression but also plays an important role in various human malignant tumors [25]. To further test whether apoptosis and autophagy induced by AOS-SO4 were related to the MEK1/ERK/mTOR pathway, we added TBHQ (an ERK activator). The results showed that apoptosis was downregulated, and the levels of apoptosis-related proteins and autophagy-related proteins were decreased after TBHQ was added to AOS-SO4-treated cells. In addition, the autophagic flux was lower than the autophagic flux of AOS-SO4 treatment alone. Similarly, AOS-SO4 inhibited osteosarcoma cell growth through the MEK1/ERK/mTOR pathway in vivo. All these findings indicated that AOS-SO4 exerted antitumor activity through the MEK1/ERK/mTOR signaling pathway.
To further determine how AOS-SO4 regulated the MEK1/ERK/mTOR pathway in osteosarcoma, we searched related literature and the STRING website and reported that MEK1 interacted with KSR1, which is also an important autophagy regulator. KSR1 is a scaffold protein of the Raf/MEK/ERK pathway [42]. KSR1 plays an important role in regulating several cellular mechanisms to promote cell proliferation and survival, including participation in metabolic regulation, cell cycle re-initiation following DNA damage repair, and translational regulation of key mediators of a transformed phenotype [43, 44]. To date, the function of KSR1 in osteosarcoma has not yet been reported. In our research, Co-IP, western blot, and confocal analyses showed that KSR1 specifically interacted with MEK1 and that they were colocalized in osteosarcoma cells. In addition, the IHC analysis of KSR1 in a tissue microarray that included an independent set of 100 pairs of osteosarcoma tissues and adjacent nontumor tissues indicated that KSR1 was a prognostic marker for osteosarcoma patients. High KSR1 expression correlated with short overall survival and disease-free survival in osteosarcoma patients. Furthermore, autophagic flux, TEM, and western blot analysis demonstrated that KSR1 overexpression could restore the antitumor activity of AOS-SO4 in osteosarcoma cells. Therefore, the rescue assay revealed that induction of autophagy and inhibition of the MEK1/ERK/mTOR signaling pathway by AOS-SO4 treatment could be reversed by KSR1 overexpression, indicating that the activity of AOS-SO4 was KSR1-dependent.
Our results indicated that sulfated modification could enhance the antitumor activity of AOS. AOS-SO4 exerted antitumor effects and promoted autophagy by inactivating the MEK1/ERK/mTOR signaling pathway, which was KSR1-dependent. Our results show that AOS-SO4 might be a potentially novel candidate to treat osteosarcoma patients.
Materials and methods
Preparation and sulfation of AOS
Alginate was purchased from Shanghai Yuanye Co., Ltd. The alginate viscosity was 4500 cp at a 2% (w/v) concentration at 25 °C, and the M/G ratio of alginate was 0.6, as determined by NMR analysis. Alginate oligosaccharide was prepared by the enzymatic degradation of alginate using alginate lyase AlyB [31]. Alginate was dissolved in Tris-HCl buffer (50 mM, pH 7.5) with 200 mM NaCl at a concentration of 2% (w/v), followed by the addition of alginate lyase. Then, the reaction mixture was incubated at 25 °C. The reaction was terminated by heating at 100 °C for 5 min, and the sample was lyophilized after centrifugation. The resulting alginate oligosaccharides were evaluated by TLC assay and size exclusion chromatography. Then, oligosaccharide was sulfated following the canonical procedure [45]. Briefly, the resulting oligosaccharide was added to the reaction mixture (containing sulfur chloride in pyridine). Then, the reaction mixture was warmed to 100 °C for 1 h. Then, sodium hydroxide solution was added to the reaction mixture for neutralization. The final product was purified using a Sephadex G-15 column. The sulfurous content was determined using the oxygen flask combustion-chemical titration method [45].
Cell viability assay
Osteosarcoma cells were incubated in 96-well plates for 24 h at a density of 5 × 10³ cells/well with 200 µL culture medium. Then, the cells were treated with different doses of AOS and AOS-SO4 (the range was from 0 to 45 mg/ml, with 5 mg/ml intervals). After 48 h, cell viability was detected by Cell Counting Kit-8 assay (CCK-8; Dojindo, Kumamoto, Japan). Ten microliters of CCK-8 working solution were added to each well for ~2 h, and the absorbance value of each well was measured at 450 nm with an enzyme-labeled instrument. Then, GraphPad Prism 8 software was used to calculate the half-maximal inhibitory concentration (IC50) of AOS and AOS-SO4.
Flow cytometry analysis of apoptosis and cell cycle distribution
Cells were seeded in six-well plates (3 × 10⁵ cells/well) and then exposed to the IC30 and IC50 of AOS-SO4, 3-MA, and TBHQ or their combinations. After 48 h, cells were collected, washed, and stained according to the manufacturer’s guidelines (Annexin V-FITC Apoptosis Detection Kit; Beyotime, China). Then, the samples were read on a flow cytometer (BD Biosciences, Franklin Lakes, NJ, USA). For the cell cycle assay, cells were treated as mentioned above, collected according to the manufacturer’s guidelines (Cell Cycle and Apoptosis Analysis Kit; Beyotime, China), and analyzed by flow cytometry.
Animal experiment
Female BALB/c nude mice (20 g/mouse) were used in animal studies, and all animals were maintained in specific pathogen-free (SPF) conditions. MNNG cells were injected subcutaneously into the left scapula of nude mice (1 × 10⁶ cells/mouse). The mice were randomized into the following two groups: (1) 0.9% NaCl group (0.9% NaCl in 200 µL, po/day/mouse); (2) AOS-SO4 group (AOS-SO4 50 mg/kg/day), or three groups: (1) 0.9% NaCl group (0.9% NaCl in 200 µL, po/day/mouse); (2) AOS-SO4 group (AOS-SO4 50 mg/kg/day); and (3) AOS-SO4 + TBHQ group (AOS-SO4 50 mg/kg/day + THBQ 2 mg/day). For lung metastasis studies, the mice were tail vein-injected with 2 × 10⁶ MNNG cells. After 1 week, the mice were randomized into two groups as mentioned above. The body weights and tumor volumes of the mice were measured every 3 days. After 30/45 days, the mice were euthanized, and the xenograft tumors from each animal were weighed and analyzed. The lung tissues of each animal were weighed and fixed in 10% formalin for histological analysis. The fixed samples were embedded in paraffin and made into tissue sections. Some sections were stained with hematoxylin and eosin (HE), and others were stained with immunohistochemistry (IHC). All animal experiments were housed and performed according to the guidelines approved by the Shanghai Medical Experimental Animal Care Commission.
mRFP-GFP-LC3-expressing cell generation and fluorescent LC3 puncta analysis
To perform image-based analysis for autophagy, cells were infected with tandem GFP-RFP-LC3 adenovirus for 24 h according to the manufacturer’s instructions [46]. mRFP-GFP-LC3 adenoviral vectors were purchased from HanBio Technology (Shanghai, China). Then, cells were treated and imaged for green fluorescent protein (GFP) and red fluorescent protein (RFP) by using a Fluoview FV1000 microscope (Olympus, Tokyo, Japan).
Statistical analysis
All data were presented as the average of three independent experiments. Statistical analysis was conducted with Graghpad Prism 8 software (San Diego, CA, USA). Differences between experimental groups and control groups were calculated by Student’s t-test. The overall survival and disease-free survival of patients were calculated by the Log-rank test. Correlation analysis of KSR1 protein expression in relation to clinicopathologic was calculated by Chi-square test. And P < 0.05 was considered statistically significant (*P < 0.05; **P < 0.01; ***P < 0.001).
Supplementary information
Acknowledgements
We should acknowledge the Shanghai Biobond Pharmaceutical Co. Ltd for the sulfation modification.
Author contributions
DC: Conceptualization, methodology. ZP and XW: Data curation, writing—original draft preparation. HG and ZL: Visualization, investigation. SL, KZ, and QL: Data curation, formal analysis. WL: Supervision, software, validation. DC and QY: Writing—-reviewing and editing, funding acquisition.
Funding
This work was supported by the grants from the National Natural Science [grant numbers 81872182, 81802685], the Shanghai Sailing Program [grant number 18YF1418700], and Shenkang Three-year Action Plan [grant number SHDC2020CR3019A].
Data availability
All data generated or analyzed during this study are included in this published article.
Competing interests
The authors declare no competing interests.
Footnotes
Publisher’s note Springer Nature remains neutral with regard to jurisdictional claims in published maps and institutional affiliations.
These authors contributed equally: Zhen Pan, Xiao-juan Wei.
Contributor Information
Wei-zhi Liu, Email: liuweizhi@ouc.edu.cn.
Qing-cheng Yang, Email: tjyqc@163.com.
Dong-dong Cheng, Email: 1988noodle@163.com.
Supplementary information
The online version contains supplementary material available at 10.1038/s41389-022-00390-x.
References
- 1.Whelan JS, Davis LE. Osteosarcoma, chondrosarcoma, and chordoma. J Clin Oncol. 2018;36:188–93. doi: 10.1200/JCO.2017.75.1743. [DOI] [PubMed] [Google Scholar]
- 2.Czarnecka AM, Synoradzki K, Firlej W, Bartnik E, Sobczuk P, Fiedorowicz M, et al. Molecular biology of osteosarcoma. Cancers. 2020;12:2130. [DOI] [PMC free article] [PubMed]
- 3.Li Z, Li X, Xu D, Chen X, Li S, Zhang L, et al. An update on the roles of circular RNAs in osteosarcoma. Cell Prolif. 2021;54:e12936. doi: 10.1111/cpr.12936. [DOI] [PMC free article] [PubMed] [Google Scholar]
- 4.Cersosimo F, Lonardi S, Bernardini G, Telfer B, Mandelli GE, Santucci A, et al. Tumor-associated macrophages in osteosarcoma: from mechanisms to therapy. Int J Mol Sci. 2020;21:5207. [DOI] [PMC free article] [PubMed]
- 5.Wu CC, Beird HC, Andrew Livingston J, Advani S, Mitra A, Cao S, et al. Immuno-genomic landscape of osteosarcoma. Nat Commun. 2020;11:1008. doi: 10.1038/s41467-020-14646-w. [DOI] [PMC free article] [PubMed] [Google Scholar]
- 6.Gianferante DM, Mirabello L, Savage SA. Germline and somatic genetics of osteosarcoma—connecting aetiology, biology and therapy. Nat Rev Endocrinol. 2017;13:480–91. doi: 10.1038/nrendo.2017.16. [DOI] [PubMed] [Google Scholar]
- 7.Guo JJ, Ma LL, Shi HT, Zhu JB, Wu J, Ding ZW, et al. Alginate ōligosaccharide prevents acute doxorubicin cardiotoxicity by suppressing oxidative stress and endoplasmic reticulum-mediated apoptosis. Marine Drugs. 2016;14:231. [DOI] [PMC free article] [PubMed]
- 8.Zhao Y, Zhang P, Ge W, Feng Y, Li L, Sun Z, et al. Alginate oligosaccharides improve germ cell development and testicular microenvironment to rescue busulfan disrupted spermatogenesis. Theranostics. 2020;10:3308–24. doi: 10.7150/thno.43189. [DOI] [PMC free article] [PubMed] [Google Scholar]
- 9.Han ZL, Yang M, Fu XD, Chen M, Su Q, Zhao YH, et al. Evaluation of prebiotic potential of three marine algae oligosaccharides from enzymatic hydrolysis. Marine Drugs. 2019;17:173. [DOI] [PMC free article] [PubMed]
- 10.Bi D, Yao L, Lin Z, Chi L, Li H, Xu H, et al. Unsaturated mannuronate oligosaccharide ameliorates β-amyloid pathology through autophagy in Alzheimer’s disease cell models. Carbohydr Polym. 2021;251:117124. doi: 10.1016/j.carbpol.2020.117124. [DOI] [PubMed] [Google Scholar]
- 11.Hu Y, Feng Z, Feng W, Hu T, Guan H, Mao Y. AOS ameliorates monocrotaline-induced pulmonary hypertension by restraining the activation of P-selectin/p38MAPK/NF-κB pathway in rats. Biomed Pharmacother. 2019;109:1319–26. doi: 10.1016/j.biopha.2018.10.109. [DOI] [PubMed] [Google Scholar]
- 12.Guo JJ, Xu FQ, Li YH, Li J, Liu X, Wang XF, et al. Alginate oligosaccharide alleviates myocardial reperfusion injury by inhibiting nitrative and oxidative stress and endoplasmic reticulum stress-mediated apoptosis. Drug Des Dev Ther. 2017;11:2387–97. doi: 10.2147/DDDT.S142118. [DOI] [PMC free article] [PubMed] [Google Scholar]
- 13.Yang Y, Ma Z, Yang G, Wan J, Li G, Du L, et al. Alginate oligosaccharide indirectly affects toll-like receptor signaling via the inhibition of microRNA-29b in aneurysm patients after endovascular aortic repair. Drug Des Dev Ther. 2017;11:2565–79. doi: 10.2147/DDDT.S140206. [DOI] [PMC free article] [PubMed] [Google Scholar]
- 14.Han Y, Zhang L, Yu X, Wang S, Xu C, Yin H, et al. Alginate oligosaccharide attenuates α2,6-sialylation modification to inhibit prostate cancer cell growth via the Hippo/YAP pathway. Cell Death Dis. 2019;10:374. doi: 10.1038/s41419-019-1560-y. [DOI] [PMC free article] [PubMed] [Google Scholar] [Retracted]
- 15.Chen J, Hu Y, Zhang L, Wang Y, Wang S, Zhang Y, et al. Alginate oligosaccharide DP5 exhibits antitumor effects in osteosarcoma patients following surgery. Front Pharmacol. 2017;8:623. doi: 10.3389/fphar.2017.00623. [DOI] [PMC free article] [PubMed] [Google Scholar]
- 16.Xing M, Cao Q, Wang Y, Xiao H, Zhao J, Zhang Q, et al. Advances in research on the bioactivity of alginate oligosaccharides. Marine Drugs. 2020;18:144. [DOI] [PMC free article] [PubMed]
- 17.Hu X, Jiang X, Hwang H, Liu S, Guan H. Antitumour activities of alginate-derived oligosaccharides and their sulphated substitution derivatives. Eur J Phycol. 2004;39:67–71. doi: 10.1080/09670260310001636695. [DOI] [Google Scholar]
- 18.Liu G, Pei F, Yang F, Li L, Amin AD, Liu S, et al. Role of autophagy and apoptosis in non-small-cell lung cancer. Int J Mol Sci. 2017;18:367. [DOI] [PMC free article] [PubMed]
- 19.Kimmelman AC, White E. Autophagy and tumor metabolism. Cell Metab. 2017;25:1037–43. doi: 10.1016/j.cmet.2017.04.004. [DOI] [PMC free article] [PubMed] [Google Scholar]
- 20.Li B, Zhou P, Xu K, Chen T, Jiao J, Wei H, et al. Metformin induces cell cycle arrest, apoptosis and autophagy through ROS/JNK signaling pathway in human osteosarcoma. Int J Biol Sci. 2020;16:74–84. doi: 10.7150/ijbs.33787. [DOI] [PMC free article] [PubMed] [Google Scholar]
- 21.Wang G, Zhang T, Sun W, Wang H, Yin F, Wang Z, et al. Arsenic sulfide induces apoptosis and autophagy through the activation of ROS/JNK and suppression of Akt/mTOR signaling pathways in osteosarcoma. Free Radic Biol Med. 2017;106:24–37. doi: 10.1016/j.freeradbiomed.2017.02.015. [DOI] [PubMed] [Google Scholar]
- 22.Deng S, Shanmugam MK, Kumar AP, Yap CT, Sethi G, Bishayee A. Targeting autophagy using natural compounds for cancer prevention and therapy. Cancer. 2019;125:1228–46. doi: 10.1002/cncr.31978. [DOI] [PubMed] [Google Scholar]
- 23.Poillet-Perez L, White E. Role of tumor and host autophagy in cancer metabolism. Genes Dev. 2019;33:610–9. doi: 10.1101/gad.325514.119. [DOI] [PMC free article] [PubMed] [Google Scholar]
- 24.Zhu L, Ding R, Yan H, Zhang J, Lin Z. ZHX2 drives cell growth and migration via activating MEK/ERK signal and induces Sunitinib resistance by regulating the autophagy in clear cell Renal Cell Carcinoma. Cell Death Dis. 2020;11:337. doi: 10.1038/s41419-020-2541-x. [DOI] [PMC free article] [PubMed] [Google Scholar]
- 25.Li W, Li Y, Guan Y, Du Y, Zhao M, Chen X, et al. TNFAIP8L2/TIPE2 impairs autolysosome reformation via modulating the RAC1-MTORC1 axis. Autophagy. 2021;17:1410–25. doi: 10.1080/15548627.2020.1761748. [DOI] [PMC free article] [PubMed] [Google Scholar]
- 26.Zhang F, Yan T, Guo W, Sun K, Wang S, Bao X, et al. Novel oncogene COPS3 interacts with Beclin1 and Raf-1 to regulate metastasis of osteosarcoma through autophagy. J Exp Clin cancer Res. 2018;37:135. doi: 10.1186/s13046-018-0791-6. [DOI] [PMC free article] [PubMed] [Google Scholar]
- 27.Chude CI, Amaravadi RK. Targeting autophagy in cancer: update on clinical trials and novel inhibitors. Int J Mol Sci. 2017;18:1279. [DOI] [PMC free article] [PubMed]
- 28.Roskoski R., Jr Targeting oncogenic Raf protein-serine/threonine kinases in human cancers. Pharmacol Res. 2018;135:239–58. doi: 10.1016/j.phrs.2018.08.013. [DOI] [PubMed] [Google Scholar]
- 29.Zhao H, Zheng B. Dual targeting of autophagy and MEK in KRAS mutant cancer. Trends Cancer. 2019;5:327–9. doi: 10.1016/j.trecan.2019.04.003. [DOI] [PubMed] [Google Scholar]
- 30.Mann KM, Ying H, Juan J, Jenkins NA, Copeland NG. KRAS-related proteins in pancreatic cancer. Pharmacol Ther. 2016;168:29–42. doi: 10.1016/j.pharmthera.2016.09.003. [DOI] [PubMed] [Google Scholar]
- 31.Lyu Q, Zhang K, Zhu Q, Li Z, Liu Y, Fitzek E, et al. Structural and biochemical characterization of a multidomain alginate lyase reveals a novel role of CBM32 in CAZymes. Biochim Biophys Acta Gen Subj. 2018;1862:1862–9. doi: 10.1016/j.bbagen.2018.05.024. [DOI] [PubMed] [Google Scholar]
- 32.Chen G. The relationship between the expression of TAM, survivin and the degree of necrosis of the tumor after cisplatin treatment in osteosarcoma. Eur Rev Med Pharmacol Sci. 2017;21:490–7. [PubMed] [Google Scholar]
- 33.Sun X, Wei Q, Cheng J, Bian Y, Tian C, Hu Y, et al. Enhanced Stim1 expression is associated with acquired chemo-resistance of cisplatin in osteosarcoma cells. Hum Cell. 2017;30:216–25. doi: 10.1007/s13577-017-0167-9. [DOI] [PMC free article] [PubMed] [Google Scholar]
- 34.Fang W, Bi D, Zheng R, Cai N, Xu H, Zhou R, et al. Identification and activation of TLR4-mediated signalling pathways by alginate-derived guluronate oligosaccharide in RAW264.7 macrophages. Sci Rep. 2017;7:1663. doi: 10.1038/s41598-017-01868-0. [DOI] [PMC free article] [PubMed] [Google Scholar]
- 35.Wang X, Liu F, Gao Y, Xue CH, Li RW, Tang QJ. Transcriptome analysis revealed anti-obesity effects of the Sodium Alginate in high-fat diet -induced obese mice. Int J Biol Macromol. 2018;115:861–70. doi: 10.1016/j.ijbiomac.2018.04.042. [DOI] [PubMed] [Google Scholar]
- 36.Zhu Y, Wu L, Chen Y, Ni H, Xiao A, Cai H. Characterization of an extracellular biofunctional alginate lyase from marine Microbulbifer sp. ALW1 and antioxidant activity of enzymatic hydrolysates. Microbiol Res. 2016;182:49–58. doi: 10.1016/j.micres.2015.09.004. [DOI] [PubMed] [Google Scholar]
- 37.Kim HJ, Kang S, Kim DY, You S, Park D, Oh SC, et al. Diallyl disulfide (DADS) boosts TRAIL-mediated apoptosis in colorectal cancer cells by inhibiting Bcl-2. Food Chem Toxicol. 2019;125:354–60. doi: 10.1016/j.fct.2019.01.023. [DOI] [PubMed] [Google Scholar]
- 38.Niu J, Yan T, Guo W, Wang W, Zhao Z. Insight into the role of autophagy in osteosarcoma and its therapeutic implication. Front Oncol. 2019;9:1232. doi: 10.3389/fonc.2019.01232. [DOI] [PMC free article] [PubMed] [Google Scholar]
- 39.Yue Z, Guan X, Chao R, Huang C, Li D, Yang P, et al. Diallyl disulfide induces apoptosis and autophagy in human osteosarcoma MG-63 cells through the PI3K/Akt/mTOR pathway. Molecules. 2019;24:2665. [DOI] [PMC free article] [PubMed]
- 40.Zhu J, Xia R, Liu Z, Shen J, Gong X, Hu Y, et al. Fenvalerate triggers Parkinson-like symptom during zebrafish development through initiation of autophagy and p38 MAPK/mTOR signaling pathway. Chemosphere. 2020;243:125336. doi: 10.1016/j.chemosphere.2019.125336. [DOI] [PubMed] [Google Scholar]
- 41.Zhang Q, Wang X, Cao S, Sun Y, He X, Jiang B, et al. Berberine represses human gastric cancer cell growth in vitro and in vivo by inducing cytostatic autophagy via inhibition of MAPK/mTOR/p70S6K and Akt signaling pathways. Biomed Pharmacother. 2020;128:110245. doi: 10.1016/j.biopha.2020.110245. [DOI] [PubMed] [Google Scholar]
- 42.Neilsen BK, Frodyma DE, Lewis RE, Fisher KW. KSR as a therapeutic target for Ras-dependent cancers. Expert Opin Ther Targets. 2017;21:499–509. doi: 10.1080/14728222.2017.1311325. [DOI] [PMC free article] [PubMed] [Google Scholar]
- 43.Simanshu DK, Nissley DV, McCormick F. RAS proteins and their regulators in human disease. Cell. 2017;170:17–33. doi: 10.1016/j.cell.2017.06.009. [DOI] [PMC free article] [PubMed] [Google Scholar]
- 44.Basu SK, Lee S, Salotti J, Basu S, Sakchaisri K, Xiao Z, et al. Oncogenic RAS-induced perinuclear signaling complexes requiring KSR1 regulate signal transmission to downstream targets. Cancer Res. 2018;78:891–908. doi: 10.1158/0008-5472.CAN-17-2353. [DOI] [PMC free article] [PubMed] [Google Scholar]
- 45.Xia Z, Yu G, Guan H, Nan Y, Zhang Z, & Li H. Preparation of low-molecular-weight polyguluronate sulfate and its anticoagulant and anti-inflammatory activities. Carbohydr Polym. 2007;69:272–9.
- 46.Yu T, Guo F, Yu Y, Sun T, Ma D, Han J, et al. Fusobacterium nucleatum promotes chemoresistance to colorectal cancer by modulating autophagy. Cell. 2017;170:548–63.e16. doi: 10.1016/j.cell.2017.07.008. [DOI] [PMC free article] [PubMed] [Google Scholar]
Associated Data
This section collects any data citations, data availability statements, or supplementary materials included in this article.
Supplementary Materials
Data Availability Statement
All data generated or analyzed during this study are included in this published article.


