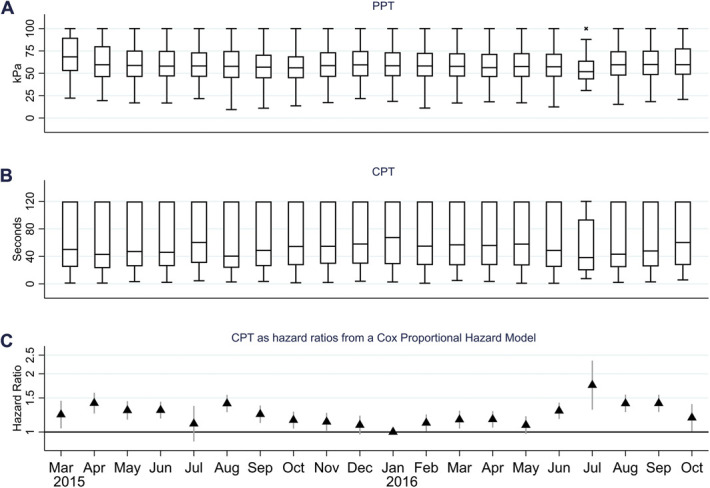
Figure 1.

Monthly variation in pressure pain tolerance (PPT) and cold pain tolerance (CPT). (A) Box plot of monthly PPT, (B) CPT as time to withdrawal in the cold pressor test, and (C) CPT as hazard ratios from a Cox proportional hazard model using time to withdrawal in the cold pressor test as survival time and month of examination as exposure and adjusted for age and sex.
