

Abstract
Hereditary angioedema (HAE) is an autosomal dominant disorder characterized by recurrent episodes of swelling of the skin, larynx, gastrointestinal tract, genitals, and extremities that can be disruptive to patient quality of life. Dysregulation of plasma kallikrein activity leads to increased production and accumulation of bradykinin in HAE and causes attacks of angioedema. Plasma kallikrein is a serine protease essential for the formation of bradykinin. Berotralstat is a potent, highly selective, orally bioavailable small‐molecule plasma kallikrein inhibitor that has been approved to prevent attacks of HAE in adults and children 12 years of age and older. Population pharmacokinetic (PK) analyses were conducted to describe the PK of berotralstat (BCX7353; Orladeyo™) and to evaluate the covariates that may explain variability in PK. The PK of berotralstat were characterized by population PK modeling of data from 13 clinical studies and a total of 771 healthy subjects and patients with HAE. The PK profile was well described by a three‐compartment model with first‐order absorption including an absorption lag time and linear elimination. Among the covariates tested, the effects of bilirubin and food were found not to be clinically significant and were removed from the model. Covariate analysis indicated significant effects of dose on bioavailability and weight on berotralstat clearance and volume. Despite the covariate effect of weight, simulations in adolescents and adults who were underweight, low weight, and overweight demonstrated similar predicted exposures to those observed at therapeutic doses in a clinical trial. Therefore, no dose adjustment is required in these HAE patient subpopulations.
Study Highlights.
WHAT IS THE CURRENT KNOWLEDGE ON THE TOPIC?
HAE is a disorder characterized by recurrent episodes of swelling of the skin, pharynx, larynx, gastrointestinal tract, genitals, and extremities. Berotralstat is an inhibitor of plasma kallikrein (a known target in HAE treatment) that has been approved in the US, Japan, the UK, and the EU to prevent HAE attacks in adults and children 12 years of age and older.
WHAT QUESTION DID THIS STUDY ADDRESS?
What are the PK characteristics of berotralstat, and what intrinsic or extrinsic factors affect PK behavior? Does the PK profile of berotralstat differ between normal weight adults with HAE and adolescents or underweight, low weight, or overweight adults with HAE?
WHAT DOES THIS STUDY ADD TO OUR KNOWLEDGE?
Body weight has a significant effect on berotralstat clearance and volume, while dose has a significant effect on relative bioavailability (higher doses predicting higher relative bioavailability). Berotralstat exposure in adolescents and adults who are underweight, low weight, and overweight is predicted to be similar to observed steady‐state exposures following a therapeutic dose of berotralstat (150 mg q.d.).
HOW MIGHT THIS CHANGE CLINICAL PHARMACOLOGY OR TRANSLATIONAL SCIENCE?
Findings offer a quantitative description of berotralstat PK and support the use of 150 mg q.d. across a range of populations and covariates.
INTRODUCTION
Hereditary angioedema (HAE) is an autosomal dominant disorder characterized by recurrent episodes of swelling of the skin, pharynx, larynx, gastrointestinal tract, genitals, and extremities. 1 HAE attacks manifest as local, non‐pruritic, cutaneous, or mucosal edema that last for several hours up to multiple days. The attacks can be life‐threatening when swelling compromises the airways and can be extremely painful when located in the intestine. 1 HAE is associated with lifelong attacks of unpredictable timing, frequency, and severity that may require treatment to prevent or stop the progression of the attacks. Living with HAE significantly impairs quality of life for patients and their families. 2 , 3
The cause of angioedema attacks in HAE patients is dysregulation of kallikrein activity, which leads to increased production of bradykinin. 4 , 5 Bradykinin is a powerful vasoactive peptide that stimulates endothelial cell B2 receptors, resulting in vasodilatation and increased vascular permeability. 6 , 7 Plasma kallikrein is a serine protease integral to the contact activation pathway. 4 Kallikrein circulates in plasma as a zymogen, prekallikrein, bound to one of its main substrates, high‐molecular‐weight kininogen (HK). 8 , 9 During contact activation, prekallikrein is cleaved by activated factor XII, forming the active protease kallikrein. Kallikrein in turn cleaves HK, producing bradykinin. 4 , 6
Berotralstat is a potent, highly selective, orally bioavailable small‐molecule plasma kallikrein inhibitor that was recently approved for the prevention of angioedema attacks in adults and children aged 12 years or older with HAE. The clinical efficacy and safety of berotralstat for HAE prophylaxis has been investigated in four studies, including the phase II APeX‐1 study (NCT02870972), two phase III studies, APeX‐2 (NCT03485911) and APeX‐J (NCT03873116), and a long‐term safety study, APeX‐S (NCT03472040). 10 , 11 , 12 , 13
Including the above studies, a total of 13 clinical studies have been conducted in healthy subjects and HAE patients to characterize the clinical pharmacology and pharmacokinetics (PK) of berotralstat. Sparse and intensive PK blood sampling was performed throughout the clinical program. Non‐compartmental analysis (NCA) of early‐phase data suggested a moderately long terminal half‐life (median of 93 h), and the possibility of enterohepatic recirculation based upon the occurrence of a second peak at approximately 5 h post‐dose. 14 In the current analysis, a population PK model was developed to further characterize the PK of berotralstat in healthy subjects and patients with HAE. Covariate relationships were examined, and simulations were performed to inform dosing in various HAE subpopulations, including adolescents and adults of different weight ranges.
METHODS
Clinical trial subjects
All studies included in this analysis were approved by an Institutional Review Board, conducted under Good Clinical Practice standards, and were in accordance with the Declaration of Helsinki and relevant laws and regulations in the applicable countries.
Subject‐level data from 13 phase I, II, and III clinical studies in healthy subjects and HAE patients were pooled for analysis (Table S1). Berotralstat was administered orally as a single dose from 10 to 900 mg and as daily repeat doses of 110 to 450 mg. Two formulations were developed for the clinical program: earlier studies utilized berotralstat formulated as the active pharmaceutical ingredient (API) in a hydroxypropyl methylcellulose (HPMC) capsule, while later studies used a “blend‐in‐capsule” formulation (which became the commercial formulation) of the API blended with standard excipients. The relative bioavailability study (NCT03202784) demonstrated that the HPMC capsule and the blend‐in‐capsule were bioequivalent in the blend and active pharmaceutical ingredient formulations in all PK parameters of interest (AUC0‐last, Cmax, and AUC0‐inf; Table S2).
Analysis of plasma berotralstat
PK samples were collected at specified timepoints and randomly throughout the studies. The sampling is described in Table S1. Berotralstat was extracted by protein precipitation and concentrations were quantified using validated liquid chromatography with tandem mass spectrometry methods with a lower limit of quantitation of 1.00 ng/ml and a calibration range of 1 to 1000 ng/ml. Multiple studies included in the analysis of samples were from subjects receiving placebo and had concentrations recorded as below the limit of quantification (BLQ). All methods demonstrated acceptable selectivity, accuracy, precision, and stability under the tested conditions.
Population PK modeling
Analysis datasets were generated in R version 3.4.0. PK modeling was performed in NONMEM version 7.3. The First Order Conditional Estimation with Interaction (FOCE‐I) estimation method was used for the initial models. Importance Sampling Assisted by Mean a Posteriori (IMPMAP) was used for initial base model development and covariate testing; however, use of this method resulted in frequent numerical errors resulting in early run termination. Consequently, final model parameters were estimated using the Stochastic Approximation Expectation Maximization (SAEM) method, due to its improved capability over IMPMAP to handle complex models with many parameters. Graphical analyses were performed using R Version 3.6.1. Goodness of fit (GoF) plots were generated with xpose version 0.4.4 and Visual Predictive Checks (VPCs) were conducted using Perl‐speaks‐NONMEM (PsN) version 4.9.0. Simulation datasets and analyses were run R version 3.6.1.
Base model development
Examination of structural model hypotheses concluded that a three‐compartment linear model was statistically superior to a two‐compartment linear model. Attempts to fit nonlinear models (Michaelis–Menten and enterohepatic circulation) were unsuccessful and these hypotheses were rejected. Some nonlinearity was present at higher doses (>300 mg once daily [q.d.]), where conditional weighted residuals (CWRES) were negative (i.e., observed value lower than predicted value). Testing of nonlinear elimination suggested that this bias was not due to saturable elimination. For the Michaelis–Menten elimination model, the estimates of Km were consistently higher than any observed concentrations, suggesting that the elimination was not saturable in the observed concentration range. The enterohepatic recirculation models 15 failed to complete, terminating the numerical errors. Upon inspection, the second peak was inconsistent, occurring in a minority of subjects, was small when seen, and most of the time supported by only a single datum. In addition, the timing of post‐dose meals was not recorded in any of the studies, making modeling of the gall bladder contraction timing difficult. The observed nonlinearity in dose was accounted for by adding an effect of dose on bioavailability.
Covariate model development
Following selection of a structural model, pre‐specified and exploratory covariate hypotheses were tested by forward addition and backward elimination to identify covariates with significant effects on berotralstat PK. During forward addition, pre‐specified effects of age, sex, race other than White, weight, estimated glomerular filtration rate (eGFR), and liver function tests (i.e., alanine aminotransferase [ALT], aspartate aminotransferase [AST], bilirubin) on clearance and weight, age, and race other than White on volume were evaluated. The pre‐specified effect of food on the absorption rate constant (Ka) was also tested for the initial berotralstat formulation only (API‐in‐capsule), as a well‐controlled trial indicated no effect of food on the blend‐in‐capsule formulation. Due to a possible trend in the post hoc ETA versus covariate plot, an exploratory effect of albumin on clearance was additionally evaluated.
Individual covariates were retained in the model if the residual standard error (RSE) was <0.510 (p ≤ 0.05). This resulted in retention of effects of food on Ka and bioavailability (API‐in‐capsule formulation only); weight, bilirubin, race other than White, and age on clearance; and weight, age, and race other than White on volume.
Upon backward elimination, the effects of age and race on volume and the effect of race on clearance were removed (RSE > 0.3562, p > 0.005). Forest plots were generated to assess the clinical significance of remaining covariates. While the food effect on bioavailability and Ka were statistically significant, it is noted that this finding of an effect of fasted/fed status is in contrast to well‐controlled studies which showed no food effect on the PK of berotralstat. Further, the fed/fasted data available for this analysis were of questionable quality. The vast majority (>90%) of the fasted/fed covariate values were imputed, based on an assumption that subjects in the phase III studies adhered to the protocol. Neither observed fasted/fed data, nor even patient‐reported fasted/fed data, were available for the phase III studies. The effect of bilirubin on clearance was paradoxical, in that a higher bilirubin predicted a higher clearance. These results, in conjunction with biological plausibility and the lack of effect seen in well‐controlled studies on food effect, led to removal of the effect of food on bioavailability and Ka and the effect of bilirubin on clearance.
Data assumptions
For phase II and III studies in HAE patients, data on meal content were not available at the time of modeling and were imputed as regular diet, as advised in the protocol. It is likely that some fractions of these imputations were incorrect. This likely resulted in limited power, and potentially bias, in any estimation of food effect on population PK parameters. Across studies, a small number of patients had missing values for body mass index (BMI) and eGFR; these were imputed as the median of the available data. Procedures for handling outliers and BLQ data are described in Supplemental Material, Text S1.
A covariate was considered to have a clinically significant effect if it resulted in a ≥20% change in area under the curve (AUC) at steady state (AUCss) or maximum concentration (Cmax) at steady state (Cmax,ss) across the 95% confidence interval (CI) of the covariate values in the dataset (i.e., a difference in AUC or Cmax of ≥20% when comparing parameters at the median value of a covariate versus the value at the upper or lower limit of the 95% CI for the covariate).
Model evaluation
Throughout model development, models were evaluated by numerical tests, including likelihood ratio tests and RSE, success of covariance step in NONMEM, parameter estimate correlations, and condition number. To assess final model diagnostics, GoF plots and Visual Predictive Check (VPCs) were constructed. For VPCs, 1000 simulations were conducted and predicted median and 95% prediction interval over time were compared to observed data. Additional VPCs were stratified by study and dose.
Simulations
Using the final population PK model, berotralstat concentration–time profiles were predicted and PK parameters were calculated from simulated data for adolescents (12 to 18 years) and adults from four different weight groups (underweight at 40−60 kg, low weight at 60− 80 kg, normal weight at 80−100 kg, and overweight at 100−120 kg). Simulations assumed the commercial dose of 150 mg berotralstat (single dose and at steady state) using the blend‐in‐capsule formulation; each scenario was run for 1000 simulated patients with HAE. Mean and variance for weight in adults were derived from the population PK analysis dataset, and simulated weight values were generated from a log normal distribution. Weight and the variance of weight in adolescents were derived from Centers for Disease Control and Prevention (CDC) weight‐for‐age charts and were log‐transformed; simulated log (adolescent weights) were drawn from a normal distribution and transformed back from the log scale, resulting in a log normal distribution of weights for adolescents. 16
RESULTS
Data summary
A total of 771 subjects with 10,437 PK records were included in the analysis. Approximately half of the population comprised patients with HAE, while the other half comprised healthy subjects. A small number of otherwise healthy subjects had varying degrees of renal and hepatic impairment. Subjects’ age ranged from 12 to 74 years, with a mean (standard deviation) of 38.1 (13.9) years. Sixteen subjects were 17 years of age or younger. Weight ranged from 40.1 to 150 kg, and slightly more than half the subjects were male (53.7%). Most of the subjects were White (83.3%); other racial groups included Asian (8.7%), Black/African American (4.5%), Other (2.7%), Native American (0.4%), and Pacific Islander (0.4%) subjects. Demographics for the analysis population are summarized in Table S3.
Final model and model evaluation
Berotralstat PK was best described by a three‐compartment model with first‐order absorption with an absorption lag time and linear elimination (Figure 1). Between‐subject variability (BSV) was included on clearance, volume of distribution, Ka, and absorption lag time; residual (unexplained) variability was modeled by a combined additive and proportional error model. A between‐study random effect was included on clearance. Covariate effects in the final model included weight on clearance and volume and dose on relative bioavailability. The relationship between dose and bioavailability is given in equation (1)
| (1) |
where F1 is the relative bioavailability for an oral dose, Dose is the administered dose, Median Dose is the median of the doses (300 mg), and THETA(11) is an estimated parameter.
FIGURE 1.
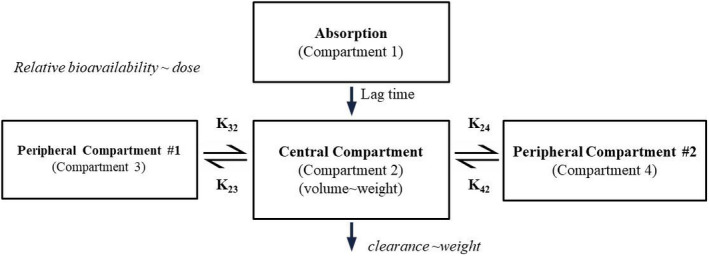
Final population pharmacokinetic (PK) model schematic for berotralstat. The pharmacokinetics were described by a three‐compartment linear model, with first‐order absorption, and an absorption lag time. Bioavailability is a function of dose, with higher doses predicting lower bioavailability. Clearance and central volume of distribution were functions of weight
These effects were both statistically and clinically significant according to the pre‐defined criteria for assessing significance.
Several covariate hypotheses showed statistical significance, including effects of bilirubin on clearance and food on Ka and bioavailability. Further assessment by Forest plots indicated that these effects were not clinically significant and, hence, were removed from the model. Removal of the bilirubin effect was further supported by its physiologically implausible interpretation of higher bilirubin values resulting in higher clearance. The final Forest plots for clinically significant covariates (weight and dose) are presented in Figure 2.
FIGURE 2.
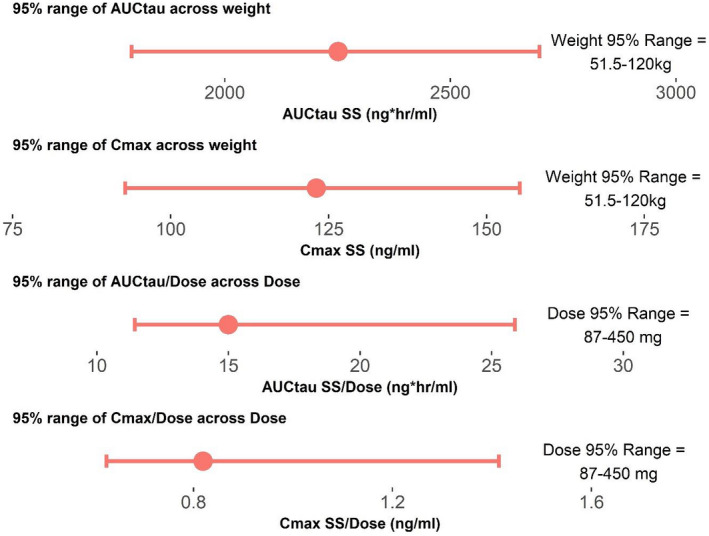
Forest plots to assess effects of weight and dose on area under the curve (AUC) and maximum concentration (Cmax). AUCtau = area under the curve for berotralstat concentration at steady state for one dose interval (150 mg q.d.). Cmax SS = maximum concentration at steady state at 150 mg q.d. dosing. AUCtau/Dose is the dose‐corrected AUC, Cmax SS/Dose is the dose‐corrected Cmax. Upper plot is the predicted range of AUCtau across the 95% interval for weight. The second plot is the predicted range for the Cmax across the 95% interval for weight. The third plot is the dose‐corrected AUC across the 95% interval for dose, and the lower plot is the predicted 95% interval for dose‐corrected Cmax across the 95% interval for dose. The center red dot is the expected value for the parameter at the median value for covariates (weight and dose). The upper and lower limits of the red lines are the expected values for the parameters at the upper and lower 95% interval for covariates
PK parameter estimates for the final population PK model are summarized in Table 1. Numerical evaluation showed convergence of the final model with a successful covariance step; the model passed the correlation test (absolute value of off diagonal elements of the correlation matrix <0.95) and had a condition number of 31.9, all suggesting good model performance. Basic GoF plots, VPCs for all data, and VPC for single‐dose studies (Figure 3) suggested a reasonable fit of the final model to the data, signifying that the model was adequate for subsequent simulations.
TABLE 1.
Population pharmacokinetic parameter estimates for the final berotralstat model in healthy subjects and patients with hereditary angioedema
| Parameter (units) | Parameter estimate (RSE%) |
|---|---|
| Clearance (L/h) | 47.3 (2.4) |
| Volume (L) | 1650 (2.49) |
| Additive error (ng/ml) | 0.483 (3.75) |
| Proportional error | 0.286 (0.404) |
| Ka (1/h) | 1.12 (0.0891) |
| K23 (1/h) | 0.0812 (2.32) |
| K32 (1/h) | 0.0309 (2.52) |
| Absorption lag time (h) | 0.468 (2.15) |
| K24 (1/h) | 0.00281 (17.7) |
| K42 (1/h) | 0.00136 (25.4) |
| Bioavailability as a function of dose | 0.497 (5.51) |
| Volume as a function of weight | 1.00 (8.28) |
| Clearance as a function of weight | 0.480 (14.3) |
Abbreviations: Ka, absorption rate constant; RSE, relative standard error.
Note: Clearance and volume were estimated for a 75.2 kg subject (the median weight across all studies).
K23 indicates rate constant from the central compartment (Compartment 2) to peripheral compartment #1 (Compartment 3); K24 indicates rate constant from the central compartment (Compartment 2) to peripheral compartment #2 (Compartment 4); K42 indicates rate constant from the peripheral compartment #2 (Compartment 4) to the central compartment (Compartment 2).
FIGURE 3.
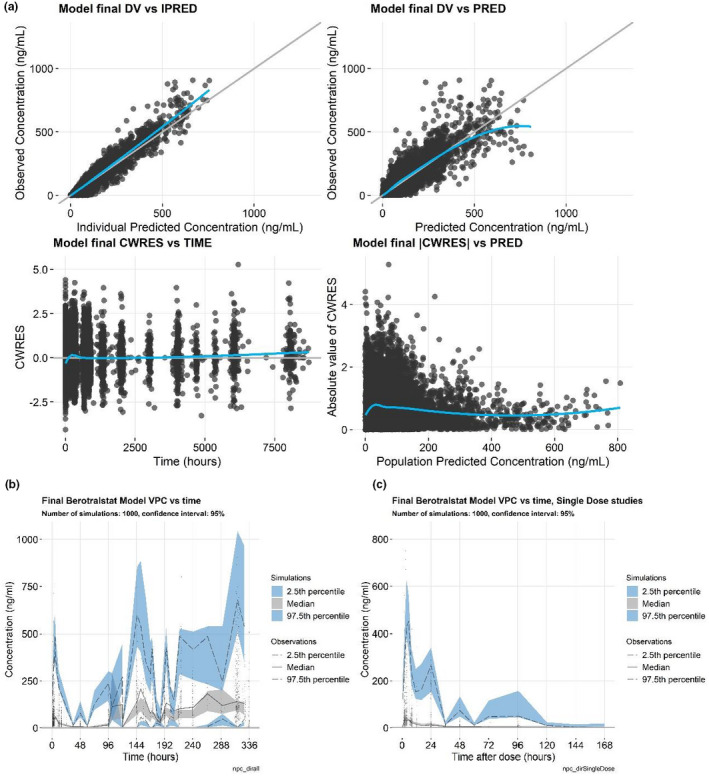
Goodness‐of‐fit plots. (a) Visual predictive checks (VPCs), (b) VPC for the single‐dose studies, and (c) for the final berotralstat population pharmacokinetic model. Goodness‐of‐fit plots include the individual predicted values versus the observed values (a, upper left), population predicted values versus the observed values (a, upper right), time versus the conditional weighted residual (CWRES; a, lower left), the population predicted concentration versus the absolute value of the CWRES (a, lower right), a VPC of time versus concentration (b), and VPC of time after dose versus concentration (c)
The final model included three compartments and was linear. The terminal half‐life was estimated to be 566 h, in contrast to the results of NCA (93 h). The shorter half‐life estimate by NCA methods was based on relatively short‐duration studies (phase I and II). The compartmental model described here included data up to 8000 h and, therefore, identified a longer terminal phase that was not seen in shorter studies.
Simulations
Simulated berotralstat concentration–time profiles following single and steady‐state doses of 150 mg once daily (q.d.) for HAE adolescents and HAE adults of varying weights are presented in Figure 4. Underweight was defined as 40–60 kg, low weight as 60–80 kg, normal weight as 80–100 kg, and overweight as 100–120 kg. Adolescent weight distribution was derived from the CDC tables 17 for ages 144 to 216 months. Median predicted concentrations in adolescents were similar to those predicted in underweight adults, with almost equal geometric mean values for predicted AUC0‐24 and Cmax between the two groups (Table 2).
FIGURE 4.
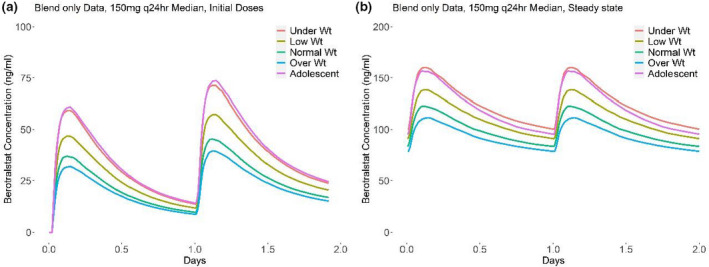
Predicted pharmacokinetic profiles for key weight groups following (a) initial dose of berotralstat and (b) at steady state. (a) Predicted median concentration profile after the initial two doses for different weight groups. (b) Predicted median concentration profile at steady state for different weight groups. Underweight was defined as 40–60 kg, low weight as 60–80 kg, normal weight as 80–100 kg, and overweight as 100–120 kg. Adolescent weight distribution was derived from the CDC tables 17 for ages 144 to 216 months
TABLE 2.
Predicted geometric means (percentage coefficient of variation) of pharmacokinetic parameters and accumulation ratio for berotralstat 150 mg q.d. dose by population, based on all data
| Population | AUC, initial dose (ng*h/ml) | Cmax, initial dose (ng/ml) | AUC, steady state (ng*h/ml) | Cmax, steady state (ng/ml) | Accumulation ratio |
|---|---|---|---|---|---|
| Underweight adults (40–60 kg) | 816 (31.3) | 67 (34.4) | 2574 (36.7) | 155 (33.9) | 3.15 |
| Low weight adults (60–80 kg) | 644 (31.2) | 51 (33.9) | 2211 (38.3) | 129 (35.6) | 3.43 |
| Normal weight adults (80–100 kg) | 509 (30.1) | 40 (32.5) | 1951 (37.0) | 111 (34.3) | 3.83 |
| Overweight adults (100–120 kg) | 438 (32.0) | 34 (34.0) | 1818 (36.9) | 101 (34.7) | 4.15 |
| Adolescents (12–18 years) | 820 (34.4) | 67 (38.2) | 2515 (38.6) | 153 (36.8) | 3.07 |
Abbreviations: AUC, area under the curve; Cmax, maximum concentration; q.d., once daily.
DISCUSSION
As a once‐daily oral therapy, berotralstat provides an effective alternative to current targeted prophylactic therapies for patients with HAE that could eliminate the treatment burden associated with alternative therapies, which require intravenous or subcutaneous administration of protein‐based prophylactic treatments. In this analysis, population PK modeling was conducted to characterize the PK of berotralstat, a small‐molecule inhibitor of plasma kallikrein that has been approved in the US, Japan, the UK, the EU, and the UAE as an oral treatment to prevent recurring angioedema attacks in adults and adolescents with HAE. Berotralstat PK was well described by a three‐compartment model with first‐order absorption including an absorption lag time and linear elimination. Several covariate hypotheses showed statistical significance, including effects of bilirubin on clearance and food on Ka and bioavailability, but were later removed from the model based on Forest plot analysis suggesting a lack of clinical significance. Removal of the bilirubin effect was further supported by its physiologically implausible interpretation of higher bilirubin values predicting higher clearance.
The observed three‐compartment model suggested a different terminal half‐life than was found in the single‐dose studies by NCA. The true terminal half‐life was not observed in the NCAs, likely due to late samples being BLQ (and therefore mostly removed in the NCA) and to the duration of sampling being too short to quantify the true terminal half‐life. For the tested two‐compartment models in the present analysis, the terminal half‐life was similar to the estimates from the NCA (90 to 100 h), and the second half‐life in the three‐compartment model was also similar to the NCA estimate from the single‐dose studies.
The final model therefore included only the effects of weight on clearance and volume, and of dose on bioavailability, where higher doses predicted higher berotralstat bioavailability. While statistically significant, the effect of dose on bioavailability has little relevance as berotralstat is given at a single dose level (150 mg q.d.). This effect was detected only due to having data available across a very wide range of doses (10 to 900 mg). A clinically significant effect (relative bioavailability 20% greater than 150 mg dose) is observed at doses greater than 300 mg. Saturable (Michaelis–Menten) elimination was examined as an explanation for this dose effect. The parameter estimates for Km with the saturable elimination model were consistently very high, suggesting that the elimination is not saturable in the range of observed concentrations. A more consistent explanation for the observation is a high bioavailability for doses greater than 300 mg. No mechanistic explanation for this is available.
In healthy volunteer studies where the plasma concentrations were available for single and multiple doses of 150 mg, a three‐ to four‐fold accumulation was noted. This degree of accumulation was expected due to the long elimination half‐life of berotralstat. The terminal half‐life estimated using the final PK model was 566 h, in contrast with the results of NCA (93 h). The phase I PK studies were not designed to quantify this longer third‐phase terminal half‐life and instead, identified the second half‐life as the terminal half‐life. Identifying the true terminal half‐life in an NCA would require an extended period of PK sampling (i.e., weeks to months) and multiple doses, as berotralstat concentrations in the terminal phase approached the lower limit of quantification (1 ng/ml). The accumulation ratio based on simulations (n = 1000) for the final model across the examined population ranges from 3.07 to 4.15 (Table 2). For comparison, the weighted mean accumulation ratio across two phase I studies (BCX7353‐101 and BCX7353‐106) and six dosing regimens (125 mg, 150 mg, 250 mg, 350 mg, 450 mg, and 500 mg q.d.) is 4.13 (range 3.03−5.85). Thus, the accumulation ratio predicted by the three‐compartment model is similar to that observed in the phase I data that suggested a terminal half‐life of 93 h. We therefore conclude that the very long terminal half‐life has no clinical implications, as compared to the previous estimate of 93 h, as the accumulation ratio is not importantly different.
The most frequent treatment‐emergent adverse events (TEAEs) in the clinical trials were abdominal pain, vomiting, diarrhea, back pain, and gastroesophageal reflux disease. 12 These symptoms were generally mild and transient, with a pattern of remitting with continued treatment. No drug‐related serious TEAEs were reported in any of the clinical trials used in this analysis. 11 , 13
Despite the statistical significance of weight in the population PK model, berotralstat was safe and generally well‐tolerated in clinical trials, with few dose‐ and exposure‐related safety findings. Across the wide distribution of subject weights in the berotralstat phase II and III studies, defined as low (40 to <70 kg), medium (>70 to 87.5 kg), and high (>87.5 to 150 kg) weight categories, there was a similar percentage of subjects within each weight category with berotralstat concentrations greater than four times the kallikrein half‐maximal effective concentration (data on file). Hence, although there are differences in the mean concentrations across the weight groups and weight is a known covariate that has been shown to affect exposure in the population PK model, the concentrations after a 150 mg dose are within the efficacious window of concentrations that were targeted for kallikrein inhibition for most subjects, even in the highest weight group.
These findings, in combination with the predicted exposures in this analysis, suggest that in adolescents and adults, age and weight do not affect berotralstat exposure to a clinically significant extent. As such, no dose adjustments are required for adolescents or underweight, low weight, or overweight adults.
CONFLICTS OF INTEREST
M.C. and W.P.S. are current employees at BioCryst Pharmaceuticals, Inc. A.M. and S.M. were previously employed by BioCryst Pharmaceuticals, Inc. M.S. is a compensated consultant to BioCryst Pharmaceuticals, Inc.
AUTHOR CONTRIBUTIONS
M.S. wrote the manuscript. A.M., M.C., and W.P.S. designed the research. A.M., M.S., and M.C. performed the research. A.M., M.C., W.P.S., M.S., and S.C.M. analyzed the data. M.S. contributed new analytical tools.
Supporting information
Supplementary Material
ACKNOWLEDGMENTS
The authors thank Tara Hun‐Dorris and Kusumam Joseph from BioCryst Pharmaceuticals, Inc. and Anginelle Alabanza from Nuventra, Inc. for help with writing the manuscript.
Mathis A, Sale M, Cornpropst M, Sheridan WP, Ma SC. Population pharmacokinetic modeling and simulations of berotralstat for prophylactic treatment of attacks of hereditary angioedema. Clin Transl Sci. 2022;15:1027‐1035. doi: 10.1111/cts.13233
Funding information
This study was funded by BioCryst Pharmaceuticals, Inc.
REFERENCES
- 1. Longhurst H, Cicardi M. Hereditary angio‐oedema. Lancet. 2012;379:474‐481. [DOI] [PubMed] [Google Scholar]
- 2. Busse PJ, Christiansen SC, Riedl MA, et al. US HAEA medical advisory board 2020 guidelines for the management of hereditary angioedema. J Allergy Clin Immunol Pract. 2021;9:132‐150 e133. [DOI] [PubMed] [Google Scholar]
- 3. Maurer M, Magerl M, Ansotegui I, et al. The international WAO/EAACI guideline for the management of hereditary angioedema‐The 2017 revision and update. Allergy. 2018;73:1575‐1596. [DOI] [PubMed] [Google Scholar]
- 4. Kaplan AP, Joseph K. The bradykinin‐forming cascade and its role in hereditary angioedema. Ann Allergy Asthma Immunol. 2010;104:193‐204. [DOI] [PubMed] [Google Scholar]
- 5. Zuraw BL, Christiansen SC. HAE pathophysiology and underlying mechanisms. Clin Rev Allergy Immunol. 2016;51:216‐229. [DOI] [PubMed] [Google Scholar]
- 6. Kaplan AP, Joseph K. Pathogenesis of hereditary angioedema: the role of the bradykinin‐forming cascade. Immunol Allergy Clin North Am. 2017;37:513‐525. [DOI] [PubMed] [Google Scholar]
- 7. De Maat S, Hofman ZLM, Maas C. Hereditary angioedema: the plasma contact system out of control. J Thromb Haemost. 2018;16:1674‐1685. [DOI] [PubMed] [Google Scholar]
- 8. Mandle RJ, Colman RW, Kaplan AP. Identification of prekallikrein and high‐molecular‐weight kininogen as a complex in human plasma. Proc Natl Acad Sci U S A. 1976;73:4179‐4183. [DOI] [PMC free article] [PubMed] [Google Scholar]
- 9. Kaplan JE, Parham DL, Soto‐Torres L, et al. Adherence to guidelines for antiretroviral therapy and for preventing opportunistic infections in HIV‐infected adults and adolescents in Ryan White‐funded facilities in the United States. J Acquir Immune Defic Syndr. 1999;21:228‐235. [DOI] [PubMed] [Google Scholar]
- 10. Hwang JR, Hwang G, Johri A, Craig T. Oral plasma kallikrein inhibitor BCX7353 for treatment of hereditary angioedema. Immunotherapy. 2019;11:1439‐1444. [DOI] [PubMed] [Google Scholar]
- 11. Zuraw B, Lumry WR, Johnston DT, et al. Oral once‐daily berotralstat for the prevention of hereditary angioedema attacks: a randomized, double‐blind, placebo‐controlled phase 3 trial. J Allergy Clin Immunol. 2021;148:164‐172 e169. [DOI] [PubMed] [Google Scholar]
- 12. Aygoren‐Pursun E, Bygum A, Grivcheva‐Panovska V, et al. Oral plasma kallikrein inhibitor for prophylaxis in hereditary angioedema. N Engl J Med. 2018;379:352‐362. [DOI] [PubMed] [Google Scholar]
- 13. Ohsawa I, Honda D, Suzuki Y, et al. Oral berotralstat for the prophylaxis of hereditary angioedema attacks in patients in Japan: a phase 3 randomized trial. Allergy. 2021;76:1789‐1799. [DOI] [PMC free article] [PubMed] [Google Scholar]
- 14. BioCryst Pharmaceuticals Inc . ORLADEYO US Prescribing Information. 2020. [Google Scholar]
- 15. de Greef R. Email: Enterohepatic Recirculation Model. A. Boeckmann. Nonmem Users Network Archive. Buffalo, NY: Cognigen; 1998. [Google Scholar]
- 16.Centers for Disease Control and Prevention (CDC) . Clinical Growth Charts. 2009. [Google Scholar]
- 17. Centers for Disease Control and Prevention (CDC) Clinical growth chart for ages 144 to 216 months. https://www.cdc.gov/growthcharts/data/zscore/wtage.csv
Associated Data
This section collects any data citations, data availability statements, or supplementary materials included in this article.
Supplementary Materials
Supplementary Material