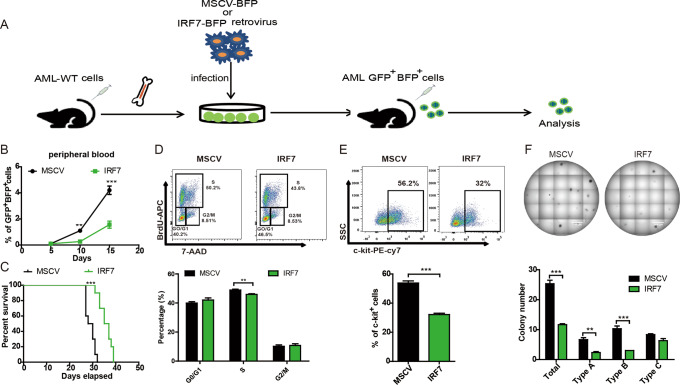
Fig. 3. AML-IRF7 mice exhibit decreased disease progression.
A Schematic overview of the development of the AML-MSCV and AML-IRF7 models. B, C Equal numbers of AML-MSCV and AML-IRF7 cells were transplanted into recipient mice. The percentage of peripheral blood GFP+BFP+ cells was monitored every 5 days (n = 4) (B), and the survival of mice is shown in Kaplan–Meier curves (n = 10) (C). D–F The mice were intravenously injected with AML-MSCV or AML-IRF7 cells and sacrificed at the middle stage of AML. D BrdU and 7-AAD staining was performed. Representative results are shown (upper), and the percentages of G0/G1, S, and G2/M phase AML cells are plotted (lower). E The expression of c-kit in AML cells was analyzed. Representative results are shown (upper), and the percentage of c-kit+ AML cells is plotted (lower). F Secondary colony formation experiments were performed by seeding 500 sorted AML cells per well into 24-well plates. Representative results are shown (upper), and the colony numbers are plotted (lower). Data are presented as mean ± S.E.M. Unpaired Student’s t test, one-way ANOVA tests and Kaplan–Meier estimates were used. **p < 0.01; ***p < 0.001.

