Abstract
Purpose
Tuberculosis (TB) is a life threatening global infection. However, not only does TB have a high global prevalence, but it is also associated with several comorbidities. Depression is one of the most common and lethal comorbidities of TB patients. Therefore, in order to prevent depression in TB patients more effectively, it is necessary to investigate the factors associated with depression in TB patients by studying the pooled effect of each factor statistically. By concluding the associated factors through statistical analysis, it not only offers accurate guidance for further studies about programs targeted at preventing depression in TB patients, but provides health-care workers useful suggestions and warnings when treating TB patients.
Methods
We searched the published literatures from PubMed, Web of Science, EMBASE, and Cochrane Library to collect studies. The meta-analysis included articles from observational studies, including cross-sectional studies, cohort studies and case control studies that had information about factors associated with depression in tuberculosis patients. When the heterogeneity is defined as significant (I2>50%), a random-effect model with 95% confidence interval (CI) was used to estimate risk factors; otherwise, a fixed-effect model was used to combine the effect. A sensitivity test was conducted to examine which one of the studies may have potential bias that can affect the validity and reliability of the result. The funnel plots and Begg’s and Egger’s statistical tests were performed to assess the publication bias. Subgroup analysis was performed according to the prespecified variables in each group.
Results
Totally, 25 studies were included in the meta-analysis. The studies were conducted in various countries around the world between 2011 and 2021, representing the situation in the previous ten years. The final associated factors include female gender [OR=1.319, 95% CI=1.132–1.536, p<0.001], poor social support [OR=4.109, 95% CI=1.431-11.799, p<0.01], marriage status [OR=1.362, 95% CI=1.154–1.608, p<0.001], low education level [OR=1.921, 95% CI=1.475–2.503, p<0.001], residence in rural areas [OR=1.408, 95% CI=1.122–1.767, p<0.01], retreatment status [OR=2.515, 95% CI=1.226–5.159, p<0.01], and having perceived stigma[OR=4.131, 95% CI=1.412–12.088, p<0.05].
Conclusion
Depression prevention programs targeted at women TB patients are supposed to be carried out. Patients in retreatment status are supposed to be paid more attention of their psychological health by caring about their mental status. More social support is ought to be given to tuberculosis patients to reduce their chance of getting depressed. It is necessary to provide patients with a lower education level with psychological related courses to help them learn about their mental status. For patients living in rural areas, governments are supposed to offer psychotherapy for treatment as well as enhancing living condition. Suitable psychotherapy programs and plans is ought to be studied to eradicate perceived stigma of TB patients.
Keywords: risk factors, tuberculosis, depression, meta-analysis
Introduction
Tuberculosis (TB) is a serious global emergency that continues to be one of the leading causes of death caused by a single infectious pathogen. According to a recent report, the global TB incidence in 2019 is 10 million, with 8.8 million (88%) adults and 1.2 million (12%) children (aged 15 years).1 Despite the fact that the COVID-19 pandemic dethroned TB as the top infectious disease cause of death, TB is expected to remain a persistent global public health threat in the coming decades.1 Furthermore, numerous comorbidities occur in TB, including some mental disorders such as anxiety and depression, which can have a negative impact on quality of life and be potentially lethal.2,3 Depression, or depression disorder, is one of the most common psychological comorbidities due to its high prevalence among mental disorders. In a recent meta-analysis, the prevalence of depression in TB patients was found to be 45.19% (95% CI=38.04–51.37).4 Aside from its high prevalence, depression in TB patients can have serious consequences, including suicidal thoughts.5,6 The impact of TB-related depression is presented in a variety of ways. First and foremost, depression has a negative impact on the outcomes of TB treatment by causing patients to behave negatively during the treatment process.7,8 Furthermore, TB patients experiencing depression episodes were reported to be unwilling to make social contact, avoiding social responsibilities, and hence losing their sense of identity as a result of social isolation.9
To effectively take precautions against occurrence of depression in TB patients, studying the related risk factors is necessary. Previous research took place in different countries over the world have listed out some risk factors. For example, Human Immune deficiency Virus (HIV) infection, pain, poor social support, and perceived stigma, and alcoholism10–13 are all corroborated as potentially risk factor for depression. Other social characteristics like gender, age and level of education are identified as well.12
However, although the pooled average prevalence of depression among tuberculosis patients has been researched and pooled data showing which factor may correlate with greater prevalence has been reported by the recent research,4 we still have limited knowledge about whether a certain factor can cause some difference statistically in a general scale rather than in a certain region or country after searching numerous databases. Only statistically significant difference exist, can a certain factor be deemed as a risk factor which hence requires greater focus on studying corresponding precautions. Therefore, in order to target the risk factors more accurately, we are motivated to conduct this systematic review and meta-analysis to find the statistically associated factors, rather than the ones concluded merely by comparing their pooled contribution to the prevalence of depression.
Materials and Methods
Search Strategy
We first systematically confirmed the targeted electronic databases to be examined in order to comprehensively identify related studies with data to use. The final databases searched included PubMed, EMBASE.com, Cochrane library and Web of Science.
In the specific searching process, we first used an or operator to combine the MeSH term “Tuberculosis” and derivative keywords “Tuberculoses”, “Kochs Disease”, “Koch’s Disease”, “Koch Disease”, “Mycobacterium tuberculosis Infection”, “Infection, Mycobacterium tuberculosis”, “Infections, Mycobacterium tuberculosis”, “Mycobacterium tuberculosis Infections” in title and abstract, also combined by an or operator. In the same vein, the second step was to use MeSH term “Depression” and “Depression disorder” combined by an or operator with keywords in title and abstract “Depressions”, “Depressive Symptoms”, “Depressive Symptom”, “Symptom, Depressive”, “Symptoms, Depressive”, “Emotional Depression”, “Depression, Emotional”, “Depressions, Emotional”, “Emotional Depressions” “Depressive Disorders”, “Depressive Neuroses”, “Depressive Neurosis”, “Endogenous Depression”, “Depressive Syndrome”, “Neurotic Depression”, “Melancholia”, “Melancholias”, “Unipolar Depression”. In the end, an and operator was used to combine the two steps mentioned above to search the articles.
After collecting the articles, we examined all of the included studies by scanning titles and abstracts against the selection criteria. Two reviewers independently reviewed half of the total articles and checked one another’s work after finishing. When discrepancy occurred, a third reviewer would review again and the decision was made after discussion among the whole team.
Eligibility Criteria
The selection criteria of our study are as follows: (a) all participants are tuberculosis infected. (b) observational studies including cross-sectional studies, case-control studies, and cohort studies. (c) studies published in the English language since the database’s inception. (d) participants in the study group have depression (mild, moderate, or severe), whereas participants in the control groups do not have depression. Studies were excluded from evaluation if any of the following conditions were met: (a) review and meta-analysis articles; (b) conference abstract articles, case reports, guidelines, and letters, which report no usable data; (c) any other studies that are completely irrelevant to our research theme; (d) intervention strategies are applied, as our targeted articles are observational studies; (e) studies without available data that can be collected for the studies; (h) there is no full texts available.
Data Extraction
The following are the basic parameters of data collected from each included article: the name of the authors (the first author was listed); the year of publication; country where the study was performed; study types; depression measurement; sample sizes of study groups and control groups; and risk factors identified in the articles. Meanwhile, gender, social support, education, marriage status, BMI, case status, residence, treatment phase, and perceived stigma were all statistically significant risk factors (ORs and 95% CIs). If the data contained adjusted OR statistics, we would use them as estimates; otherwise, the crude OR would be extracted. If no OR statistics were provided, we recorded the number of participants in the study and control groups who had or did not have the specific factor and manually computed the crude OR.
A standardized data extraction checklist was used for collecting the data by two reviewers which was later verified by the third reviewer and discrepancies were compromised by our further discussion with one another.
Quality Assessment
The quality of the cross-sectional studies was assessed using the Joanna Briggs Institute Meta–Analysis of Statistics Assessment and Review Instruments (JBI–MAStARI)14 for observational cross–sectional studies. This assessment instruments values each study based on 10 criteria. For each criterion, if not at all meeting the criteria, a score of zero was assigned, if the criteria were mentioned but not described in detail, a score of one was assigned and if the criteria were specifically, comprehensively, and accurately described in the study, then a score of two is assigned. The total score of each study was ranging from 0 to 20 which was computed by adding up each single score of the corresponding criterion and the studies scored 14 and above were defined as the good quality ones.
For the quality assessment of the cohort studies, we used the Newcastle-Ottawa Scale (NOS)15 which assessed the articles based on 3 general criteria which include 9 clauses in total. For each criterion, if “yes”, we assigned a score of one. The total score of each study was ranging from 0 to 9 by summing up the scores gained from each item. The articles scored 6 and above were defined as high quality.
The quality assessment were conducted by three reviewers independently and discrepancies about certain articles would be discussed among the reviewers who together gave the final score of the articles.
Statistical Analysis
The extracted statistical data of the risk factors from identified studies were combined in a meta-regression analysis using Version 15 of STATA software.
Meta-analysis and heterogeneity test were first performed for each analysis, and statistics I2 were used to represent the extent of the inconsistency among the results due to the internal heterogeneity of the included studies. I2 higher than 50% and p<0.05 was deemed as significant heterogeneity and hence a random-effects model was applied for analysis. Instead, a fixed-effect model was utilized to combine the data. An estimate with a p-value less than 0.05 was defined as significant. The combined estimates heterogeneity test values I2, as well as the corresponding p-value, were reported for each forest plot.
The sensitivity analysis was performed for each group of data in order to examine the validity of each article and find out which one of them may elicit potential bias and affect final result. Specifically, if the estimate of combined data varied so substantially that was even not within the original range of CI when having the data from one certain study omitted, then that study was deemed as having significant sensitivity and was supposed to be eliminated. Sensitivity analysis would be performed again after eliminating the study with unacceptable sensitivity and the process could not end until no study contributed to the final data had significant sensitivity.
A funnel plot and Begg’s and Egger’s statistical tests were used to illustrate the statistical significance of publication bias. As a rule of thumb, test for funnel plot asymmetry should only be used when at least 10 studies are included in the analysis.
We subsequently performed a subgroup analysis according to prespecified variables: the study types (cross-sectional study, cohort study), the depression assessment (ie, PHQ-9, HADS, CES-D), the continent (ie, Asia, Africa, Oceania) where the study took place and the regression model type (AOR, COR), which were deemed to be potential moderators.
Results
Study Selection
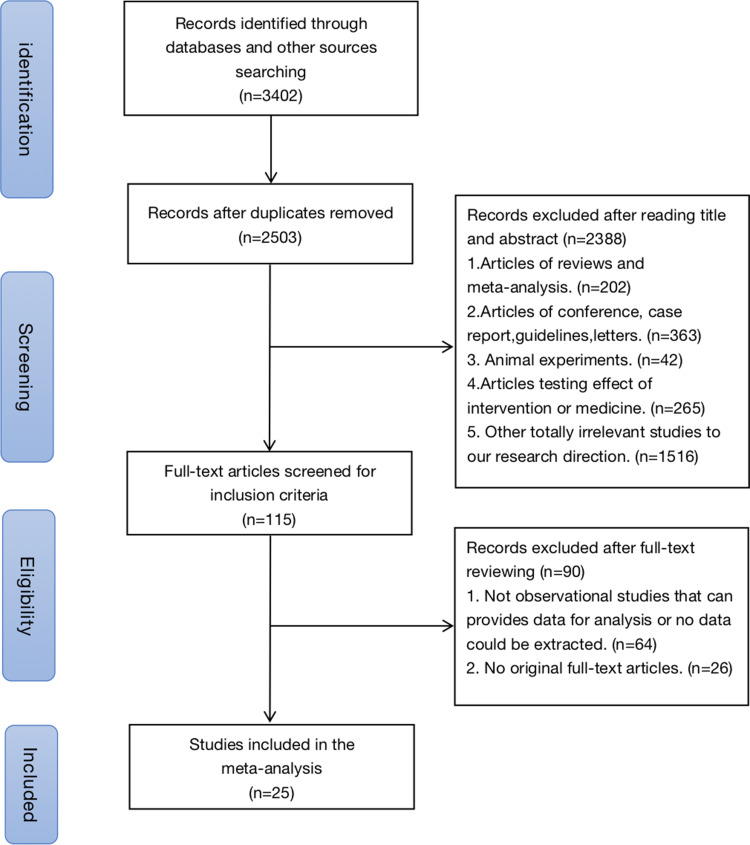
3402 studies were initially accessed from the four selected electronic databases. After removing the duplicates, there were 2503 articles left, the titles and abstracts of which were examined further. Overall 115 studies remained for full-text review after excluding the reviews and meta-analysis, conference abstracts, case reports, guidelines, letters, and some discursive studies. Following our review, 25 studies met all of the criteria and were included in our study.2,3,5,16–37 The flow chart for the selection procedures and the specific exclusion reasons are presented in Figure 1.
Figure 1.
Flowchart of study selection.
Overview of Study Characteristic
The studies included in our research were conducted in various countries located in five different continents all over the world. Among them, 13 were from countries in Asia, 8 were from countries in Africa, 2 were from Brazil which is in Oceania, 1 was from Peru which locates in South America and 1 was from Romania, Europe. All of the included studies were published between 2011 and 2021, so they can represent information from the recent 10 years. As for the study type, 5 of the included studies were cohort studies while of them were cross-sectional studies. The sample size of the included studies ranges from 46 to 1342, with a total of 10,143 participants diagnosed with tuberculosis. The specific characteristic of the studies is shown in Table 1.
Table 1.
Basic Characteristics of the Included Studies
| Reference | country | Study type |
Study group (Male/ Female) |
Control group (Male/ Female) |
Age | Depression assessment | Quality |
| Ambaw et al., 201716 | Ethiopia | cross-sectional | 346 (172/174) | 298 (174/124) | PHQ-9 | High quality (15) | |
| Naidu et al., 202017 | South Africa | cohort study | 21 (3/18) | 179 (36/143) | MINI-Plus | High quality (7) | |
| Mohammedhussein et al., 202018 | Ethiopia | cross-sectional | 229 (97/132) | 181 (114/67) | 31.85±12.42 | HADS | Low quality (13) |
| Dasa et al.,20195 | Ethiopia | cross-sectional | 209 | 194 | PHQ-9 | Low quality (13) | |
| Castro-Silva et al., 201819 | Brazil | cross-sectional | 99 (62/37) | 161 (98/63) | PHQ-9 | Low quality (13) | |
| Santos et al., 20172 | Brazil | cross-sectional | 27 (17/10) | 59 (43/16) | 44.6±15.4 | HADS | High quality (15) |
| Duko et al., 20154 | Ethiopia | cross-sectional | 181 | 236 | 34.52±11.01 | HADS | High quality (14) |
| Kehbila et al., 201620 | Cameroon | cross-sectional | 162 (60/102) | 103 (69/34) | 37±10.1 | PHQ-9 | High quality (14) |
| Molla et al., 20196 | Ethiopia | cross-sectional | 129 (63/66) | 286 (159/127) | 34.56±12.6 | PHQ-9 | High quality (15) |
| Wang et al., 20183 | China | cross-sectional | 222 (136/86) | 1030 | 44.35 | PHQ-9 | High quality (16) |
| Ugarte-Gil et al., 201322 | Peru | cohort study | 109 (52/57) | 182 (108/74) | CES-D | High quality (8) | |
| Walker et al., 201823 | Pakistan | cross-sectional | 547 (232/315) | 732 (427/305) | 31 (22-41) | PHQ-9 | High quality (14) |
| Zainuddin et al., 202024 | Indonesia | cross-sectional | 29 (16/13) | 63 (42/21) | BDI-II | Low quality (12) | |
| Walker et al., 201925 | Nepal | cross-sectional | 30 (20/10) | 105 (82/23) | 30 (23-43) | HSCL-25 | High quality (16) |
| Stoichita et al., 202126 | Romania | cohort study | 21 (11/10) | 25 (18/7) | 46±13.3 | HADS | Low quality (13) |
| Oh et al., 201727 | Korean | cohort study | 101 (46/55) | 191 (71/120) | 45.8±18.4 | ICD-10 | High quality (8) |
| Salodia et al., 202128 | India | cross-sectional | 25 (13/12) | 81 (48/33) | 30 (24-40) | PHQ-9 | High quality (7) |
| Paradesi et al., 202029 | India | cross-sectional | 68 (23/45) | 52 (16/36) | ICD-10 | High quality (16) | |
| Ige et al., 201130 | Nigeria | cohort study | 40 (14/26) | 48 (14/34) | 27.09±14.29 | HAM-D | High quality (6) |
| Singh et al., 201831 | India | cross-sectional | 124 (91/33) | 6 (2/4) | 29.45±14.49 | HAM-D | High quality (14) |
| Kuching et al., 202032 | Malaysia | cross-sectional | 18 | 217 | 43.7±16.6 | PHQ-9 | High quality (14) |
| Yohannes et al., 202033 | Ethiopia | cross-sectional | 186 | 223 | 31.9±11.85 | PHQ-9 | High quality (14) |
| Gong et al., 201834 | China | cross-sectional | 644 (404/240) | 698 (501/197) | 47.7±17.1 | CES-D | High quality (14) |
| Dong et al., 202035 | China | cross-sectional | 590 (349/241) | 507 (345/162) | 46.21±16.46 | CES-D | High quality (18) |
| Shrestha et al.,202036 | Nepal | cross-sectional | 81 (56/25) | 48 (36/12) | 36.78±15.62 | PHQ-9 | High quality (18) |
Meta-Analysis results of the Risk Factors
Gender
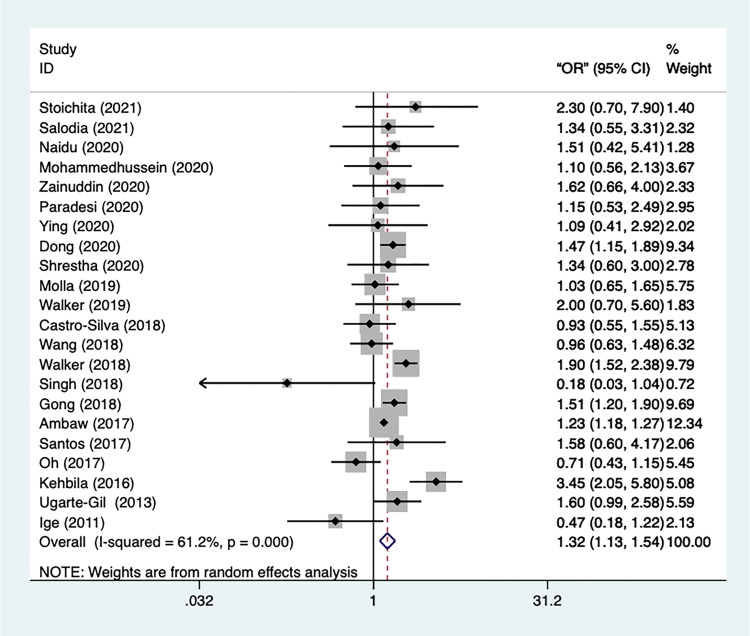
Gender (female) was found to be a risk factor for depression in tuberculosis patients in 22 studies. Figure 2 shows that the trials have a high degree of heterogeneity (I2=61.2%, p=0.000). Hence the random-effect model was applied. From the result, we could infer that female was significantly in greater risk of occurrence of depression episodes [OR=1.32, 95% CI=1.13–1.54, p=0.000]. In addition, a sensitivity test was performed, and no studies got eliminated. To examine the publication bias, Begg’s and Egger’s tests were conducted, and the result showed that there was no statistically significant publication bias (p=0.955, p=0.616).
Figure 2.
Meta-analysis of risk factor gender.
We used a random-effect model to conduct a subgroup analysis based on the study types, continent, analysis, and depression measurement. The first subgroup analysis was pre-specified according to the type of odd ratio. We can see from the results that the heterogeneity of studies using AOR is insignificant (n=5, I2=0.0%, p=0.601). Females were still statistically more likely than males to suffer from depression [OR=1.227, 95% CI=1.183–1.272, p=0.000].
The second subgroup was classified according to depression scale, and the results showed that the heterogeneity of the studies that used the HADS was miniscule (n=3, I2=0.0%, p=0.549), as were the ones that used the ICD-10 (n=2, I2=7.7%, p=0.298), CES-D (n=3, I2=0.0%, p=0.953), and HAM-D (n=2, I2=0.0%, p=0.344). However, the heterogeneity of studies with PHQ-9 was still markedly substantial (n=9, I2=75.2%, p=0.000). Furthermore, studies using PHQ-9 [OR=1.37, 95% CI=1.07–1.755, p= 0.013] and CES-D [OR=1.504, 95% CI=1.283–1.763, p= 0.000] reported that females were significantly more associated with depression than men, whereas the significance was not found in studies using HADS as a depression assessment. Nevertheless, the results of the HAM-D studies were reversed [OR=0.378, 95% CI=0.164–0.87, p= 0.022], indicating that women were significantly less likely than men to develop depression. In studies using ICD-10, a similar, albeit insignificant, result was found. Moreover, other subgroups did not show any significant estimation.
The third subgroup analysis was pre-specified by the continent where the studies took place. According to the analysis, we could notice that the heterogeneity of the studies conducted in Oceania was miniscule (n=2, I2=0.0%, p=0.342) while that of the ones processed in Asia (n=13, I2=59.4%, p=0.003) and Africa (n=5, I2=74.7%, p=0.003) were significant. There was no statistically significant evidence that women were more likely to suffer from depression than men in Asia [OR=1.232, 95% CI=0.98–1.548, p= 0.074] or Africa [OR=1.463, 95% CI=0.97–2.207, p= 0.07], and no significant estimates were reported in other subgroups.
The last subgroup was classified by study type. Both the cross-sectional studies (n=16, I2=62.6%, p=0.000) and cohort studies (n=5, I2=60.6%, p=0.038) revealed substantial heterogeneity. In cross-sectional studies, the chance of women getting depressed was significantly higher than men [OR=1.378, 95% CI=1.172–1.169, p=0.000] while no such significant result was observed in cohort study [OR=1.067, 95% CI=0.616–1.850, p= 0.816].
Social Support
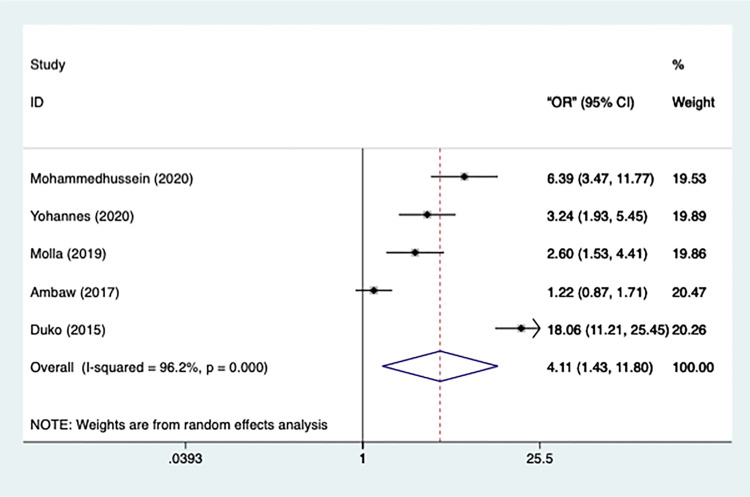
A total of 5 articles reported that a lack of strong social support was a risk factor for depression in TB patients. Figure 3 shows that the trial heterogeneity is significant (n=5, I2=96.2%, p=0.000), which is why a random-effect model was performed. Poor social support was significantly associated with the occurrence of depression [OR=4.109, 95% CI=1.431-11.799, p=0.009], implying that TB patients without stalwart social support were more likely to become depressed. In addition, a sensitivity test was conducted, and no studies got eliminated.
Figure 3.
Meta-analysis of risk factor social support.
A subgroup-analysis was performed utilizing the random-effect model according to the pre-specified variables: the depression assessment and regression model type. The first subgroup analysis is pre-specified by depression type. The results showed that the heterogeneity of the studies using HADS (n=2, I2=86.9%, p=0.006), and PHQ-9 (n=3, I2=83.1%, p=0.003) was still statistically considerable. Furthermore, the result of HADS studies indicated that the TB patients without strong social support were in a remarkably significant chance of developing depression [OR=11.023, 95% CI=3.998–30.471, p=0.000]. PHQ-9 studies yielded a similar result [OR=2.12, 95% CI=1.115–4.031, p=0.022]. No significant estimation was observed in subgroup using ICD-10.
Secondly, classified by regression model type, the heterogeneity of subgroup of studies using COR is also great (n=4, I2=88.4%, p=0.000). The results also revealed that TB patients with limited social support were significantly more likely to experience depression episodes [OR=2.773, 95% CI=1.358–5.661, p=0.005]. The outcome of a single study using AOR as well demonstrated a significant effect [OR=18.060, 95% CI=11.986, 27.212, p=0.000].
Education
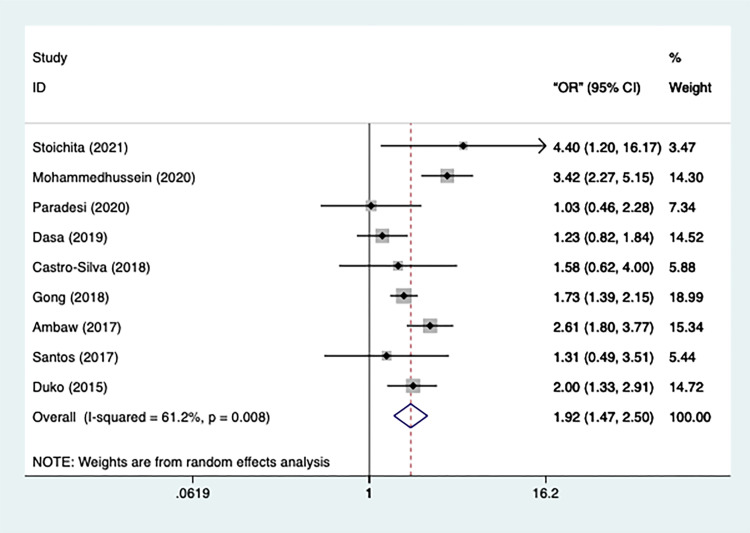
The heterogeneity of the included 9 studies was relatively high (n=9, I2=61.2%, p=0.008) which conveys that a random-effect model should be used. The results, illustrated in Figure 4, announced that TB patients without a secondary or above education were more likely to be depressed [OR=1.921, 95% CI=1.475–2.503, p=0.000]. No studies got excluded after the sensitivity analysis.
Figure 4.
Meta-analysis of risk factor education.
Subgroup analysis was carried out using a random-effect model that was pre-specified based on the depression assessment, the continent, and the study types. Classified by depression assessment, the studies in the subgroup using HADS (n=4, I2=48.4%, p=0.119) and PHQ-9 (n=4, I2=60.3%, p=0.56) as depression scale both showed an insignificant heterogeneity. According to the observations of HADS studies, TB patients with less than a secondary school education were significantly more likely to suffer from depression [OR=2.473, 95% CI=1.599–3.826, p=0.000]. The studies using PHQ-9 also showed a similar result [OR=1.758, 95% CI=1.283–2.408, p=0.000]. No significant estimation was reported by the single study using ICD-10.
A second subgroup analysis was pre-specified by the variable continent. The studies performed in Oceania had a meager heterogeneity (n=2, I2=0.0%, p=0.791), and the heterogeneity of studies held in Asia were also insignificant (n=2, I2=34.1%, p=0.218). However, the trials of the studies conducted in Africa had a wide range of results, with significant heterogeneity (n=4, I2 = 77.9%, p=0.004). The results of studies conducted in Africa [OR=2.163, 95% CI=1.425–3.284, p=0.000], Asia [OR=1.543, 95% CI=1.015–2.344, p=0.042], and Europe [OR=4, 95% CI=1.197–16.171, p=0.026] revealed that patients with secondary and higher education were significantly more likely to suffer from depression. Otherwise, the effect is not statistically significant in studies conducted in Oceania [OR=1.445, 95% CI=0.745–2.842, p=0.286].
Prespecified by study design, the subgroup studies using cross-sectional design had a significant heterogeneity (n=8, I2=63.2%, p=0.008). All cross-sectional [OR=1.886, 95% CI=1.429–2.437, p=0.000] and cohort studies [OR=4, 95% CI=1.197–16.171, p=0.026] results showed that TB patients with less than a secondary school education had a significantly higher risk of depression.
Marriage Status
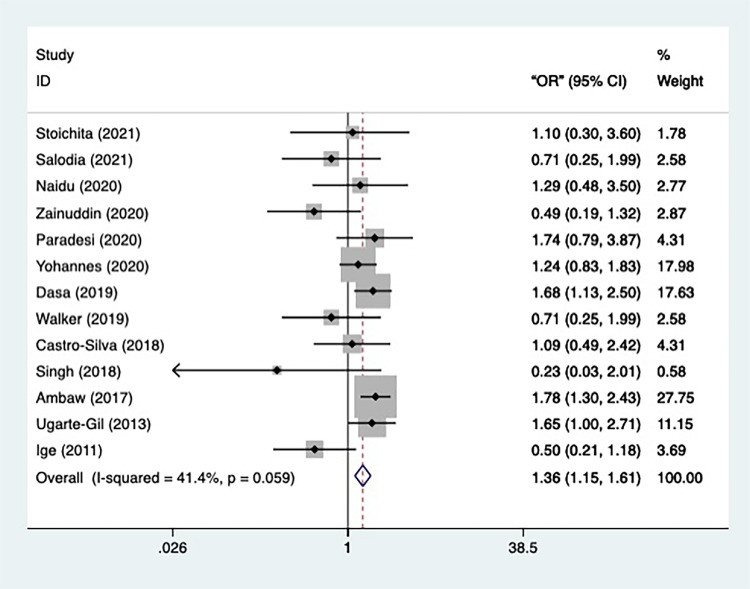
The data on the marriage status of TB patients was provided by 13 included studies. The general heterogeneity of the 13 studies was not significant (n=13, I2=41.4%, p=0.059), therefore a fixed-effect model was applied in the meta-analysis (Figure 5). Participants in marriage were found to be more likely than those in single status to develop depression [OR=1.362, 95% CI=1.154–1.608, p=0.000], indicating marriage is a potential risk factor in occurrence of depression. Furthermore, after sensitivity analysis, all studies remained. To examine the publication bias, Begg’s and Egger’s tests were conducted, and the result showed a significant publication bias (p=0.028, p=0.003).
Figure 5.
Meta-analysis of risk factor marriage status.
To begin with, subgroup analysis was conducted according to the prespecified variables: depression assessment, continent, and study type. Firstly, classified by depression assessment, the heterogeneity of studies using PHQ-9 is minor (n=5, I2=20.8%, p=0.282) and the result of the subgroups reported that the TB patients in marriage status were in a significantly greater danger of getting depressed [OR=1.498, 95% CI=1.23–1.826, p=0.000]. The same result was reported by the single study using CES-D [OR=1.649, 95% CI=1.004–2.709, p=0.048]. There was no significant effect in the remaining 1 study using HADS, 1 study using MINI-Plus, 1 study using BDI-II, 1 study using HSCL-25, and 2 studies using HAM-D.
Furthermore, classified by continent, the result of the studies that took place in Africa had meager heterogeneity (n=4, I2=0.0%, p=0.511), implying that compared with TB patients in single status, those in marriage were more likely to be depressed [OR=1.566, 95% CI=1.277–1.92, p=0.000]. The similar result was reported by the single study in South America [OR=1.649, 95% CI=1.004-2.709, p=0.048]. In studies conducted in Asia, where heterogeneity is minimal (n=6, I2=28.8%, p=0.219), no significant effect was observed. In the remaining 1 study conducted in Europe and 1 study conducted in Oceania no significant effect was observed.
At last, prespecified by study design, the heterogeneity of both the cross-sectional studies (n=6, I2=39.5%, p=0.094) and cohort studies (n=3, I2=12.2%, p=0.32) was insignificant. However, while the cohort studies found that marriage status is a risk factor for developing depression [OR=1.427, 95% CI=1.2–1.696, p=0.000], the cross-sectional study reported no marked effect.
BMI
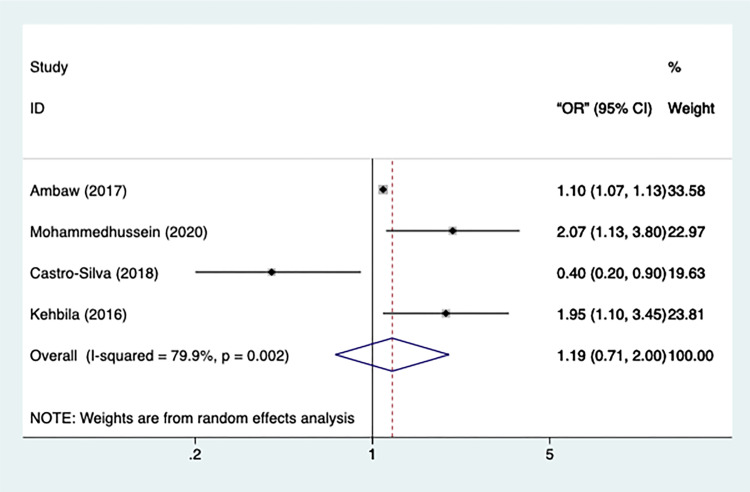
A total of 4 included studies had statistical data on BMI, with significant heterogeneity (n=4, I2=79.9%, p=0.002) (Figure 6). Therefore, a random-effect model was applied in the meta-analysis. However, only a marginally significant effect was observed in patients with a lower-than-normal BMI [OR=1.194, 95% CI=0.713 −2.002, p=0.05]. All the studies remained after performing sensitivity test.
Figure 6.
Meta-analysis of risk factor BMI.
Case Status
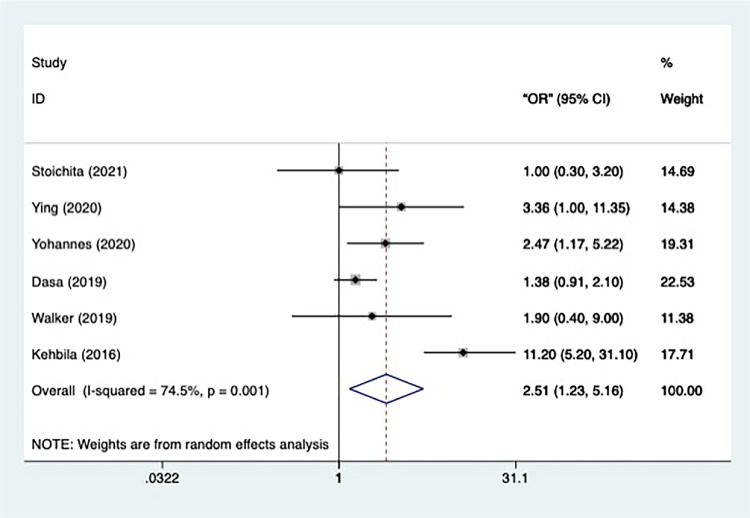
Totally, 6 studies had the data concerning the case status. Since the heterogeneity of the 6 studies was significant (n=6, I2=74.5%, p=0.001), a random-effect model was applied in the meta-analysis (Figure 7). The result informed that the retreatment TB patients were significantly more likely than the new treatment patients to have depression episodes [OR=2.515, 95% CI=1.226–5.159, p=0.001]. All the studies remained after the sensitivity analysis.
Figure 7.
Meta-analysis of risk factor case status.
Subgroup analysis was further conducted according to the prespecified variables: depression assessment, regression model type, study type and continent. The first subgroup analysis, which used depression assessment as a variable, revealed that the heterogeneity of the PHQ-9 studies is still significant (n=4, I2=83.4%, p=0.000). Those studies also reported that the TB patients in retreatment were in a larger chance of developing into depression [OR=3.197, 95% CI=1.259–8.119, p=0.015]. Other 2 studies using HADS and HSCL-25, respectively did not report a similar significant difference.
Classified by continent, the studies took place in Asia showed a minute heterogeneity (n=2, I2=0.0%, p=0.571) and reported that the TB patients in retreatment were significantly in more danger of depression than those in new treatment [OR=2.708, 95% CI=1.039–7.056, p=0.041]. However, despite significant heterogeneity (n=3, I2=88.6%, p=0.000), studies conducted in Africa reported a significant effect of risk factor retreatment as well [OR=3.192, 95% CI=1.011–10.075, p=0.048]. The rest 1 study performed in Europe did not show a marked effect.
Moreover, as re-specified by study design, the heterogeneity of the subgroup composed of cross-sectional studies was significantly significant (n=5, I2=77.9%, p=0.001), but the results also showed that TB patients in retreatment were at a higher risk of depression [OR=2.956, 95% CI=1.315–6.645, p=0.009]. The result of the remaining cohort studies did not present such a significant effect.
At last, prespecified by regression model type, the heterogeneity of studies using COR as statistical estimate was miniscule (n=4, I2=0.0%, p=0.497), and the result showed that compared to new treatment TB patients, the retreatment ones were more likely to get involved in depression [OR=1.475, 95% CI=1.023–2.126, p=0.037]. The significant effect was also proved by the result of the studies using AOR as estimate [OR=5.152, 95% CI=1.172–22.652, p=0.03], heterogeneity of which was significant (n=2, I2=84.5%, p=0.011).
Residence
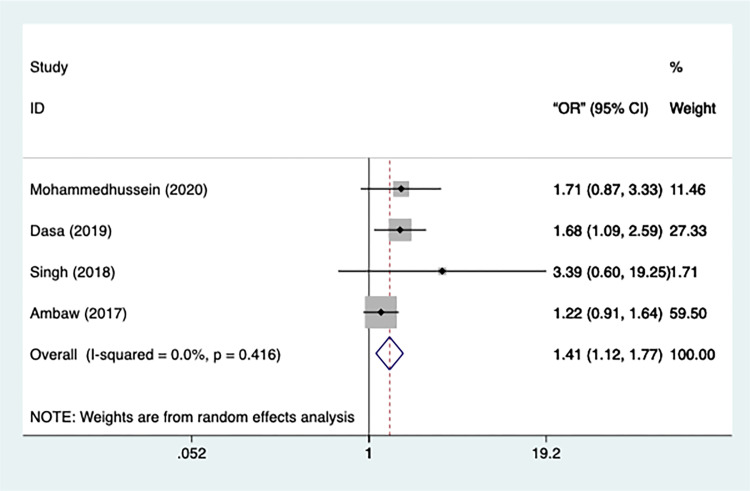
The data on the residence was provided by four studies in total. The heterogeneity of the studies was miniscule (n=4, I2=0.00%, p=0.416) and hence a fixed-effect model was applied (Figure 8). The study presented that TB patients in rural areas were significantly more likely to develop depression than those in urban areas [OR=1.408, 95% CI=1.122–1.767, p=0.003], and no studies were excluded after the sensitivity test.
Figure 8.
Meta-analysis of risk factor residence.
Treatment Phase
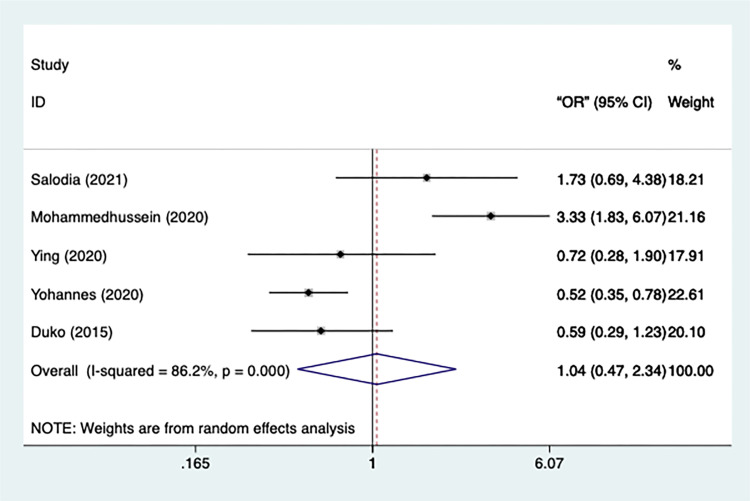
In total, 5 studies had data on the treatment phase, with significant heterogeneity (n=5, I2=86.2%, p=0.000) (Figure 9). Therefore, a random-effect model was used in the meta-analysis. Meanwhile, there was no significant difference in the risk of depression between intensive TB patients and those who were on continuation [OR=1.043, 95% CI=0.466–2.336, p=0.919]. Additionally, all studies remained after sensitivity test.
Figure 9.
Meta-analysis of risk factor treatment phase.
Perceived Stigma
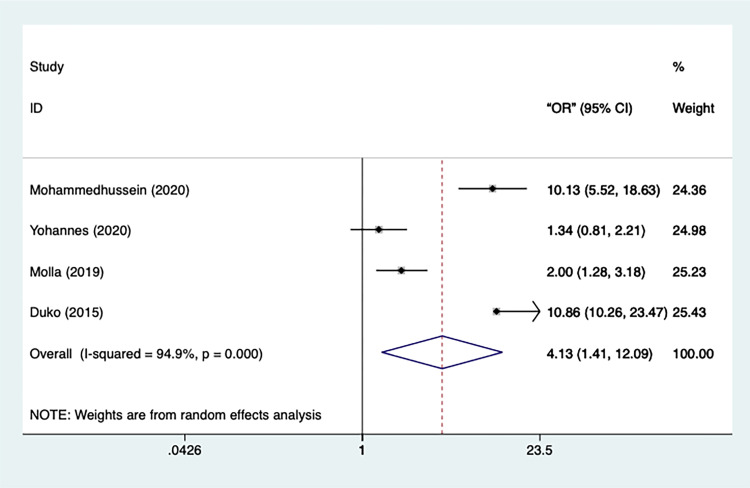
Overall, data on perceived stigma was extracted from 5 studies which had a significantly substantial heterogeneity (n=5, I2=94.9%, p=0.000) (Figure 10). As the result, a random-effect model was applied in the analysis. According to the result, compared to the TB patients without perceived stigma, it is significantly more likely for patients with perceived stigma to develop depression[OR=4.131, 95% CI=1.412–12.088, p=0.01]. No study got eliminated after the sensitivity analysis.
Figure 10.
Meta-analysis of risk factor perceived stigma.
A subgroup analysis was conducted according to the depression assessment. The studies using HADS as depression measurement had a meager heterogeneity (n=2, I2=0.00%, p=0.853), as did the studies that used PHQ-9 (n=2, I2=25.5%, p=0.247). Moreover, both the results of the studies using HADS [OR=10.624, 95% CI=7.546–14.967, p=0.000] and those using PHQ-9 [OR=1.661, 95% CI=1.123–2.457, p=0.011] indicated that patients with a perceived stigma is markedly at more risk of being depressed. The overall result of risk factors and subgroups is shown in Table 2.
Table 2.
The Results of Risk Factors and Subgroups
| Risk Factor (Referrence) | Subgroup Categories | Subgroups | No. of Samples | OR (95% CI) | P value | Heterogeneity (I2), % |
|---|---|---|---|---|---|---|
| Gender (Male sex) | 22 | 1.319 (1.132–1.536) | 0.000 | 61.2 | ||
| Depression measurement | PHQ-9 | 9 | 1.370 (1.070–1.760) | 0.013 | 75.2 | |
| Mini-Plus | 1 | 1.510 (0.442–5.407) | 0.527 | NA | ||
| HADS | 3 | 1.370 (0.830–2.270) | 0.549 | 0.0 | ||
| CES-D | 3 | 1.504 (1.283–1.763) | 0.000 | 0.0 | ||
| BDI-II | 1 | 1.625 (0.661–3.996) | 0.290 | NA | ||
| HSCL-25 | 1 | 2.000 (0.707–5.657) | 0.191 | NA | ||
| ICD-10 | 2 | 0.819 (0.529–1.268) | 0.371 | 7.7 | ||
| HAM-D | 2 | 0.378 (0.164–0.870) | 0.022 | 0.0 | ||
| Study type | Cross-sectional | 17 | 1.378 (1.172,-1.619) | 0.000 | 62.6 | |
| Cohort | 5 | 1.067 (0.616–1.850) | 0.816 | 60.6 | ||
| Regression model type | AOR | 5 | 1.227 (1.183–1.272) | 0.000 | 0.0 | |
| COR | 17 | 1.369 (1.105–1.697) | 0.004 | 59.6 | ||
| Continent | Africa | 5 | 1.463 (0.970–2.207) | 0.070 | 74.7 | |
| Oceania | 2 | 1.044 (0.662–1.646) | 0.853 | 0.0 | ||
| Asia | 13 | 1.232 (0.980–1.548) | 0.074 | 59.4 | ||
| South America | 1 | 1.600 (0.992–2.581) | 0.054 | NA | ||
| Europe | 1 | 2.300 (0.685–7.272) | 0.179 | NA | ||
| Social support (Strong social support) | 5 | 4.109 (1.431–11.799) | 0.009 | 96.2 | ||
| Depression Measurement |
HADS | 2 | 11.023 (3.998–30.471) | 0.000 | 86.9 | |
| PHQ-9 | 3 | 2.120 (1.115–4.031) | 0.022 | 83.1 | ||
| Regression model type | COR | 4 | 2.773 (1.358–5.661) | 0.005 | 88.4 | |
| AOR | 1 | 18.060 (11.986–27.212) | 0.000 | NA | ||
| Education (Secondary and above; grad ≥8) | 9 | 1.921 (1.475–2.503) | 0.000 | 61.2 | ||
| Depression measurement | PHQ-9 | 4 | 1.758 (1.283–2.408) | 0.000 | 60.3 | |
| HAD | 4 | 2.473 (1.599–3.826) | 0.000 | 48.8 | ||
| ICD | 1 | 1.028 (0.464–2.777) | 0.946 | NA | ||
| Continent | Africa | 4 | 2.163 (1.425–3.284) | 0.000 | 77.9 | |
| Oceania | 2 | 1.445 (0.745–2.842) | 0.286 | 0.0 | ||
| Europe | 1 | 4.000 (1.197–16.171) | 0.026 | NA | ||
| Asia | 2 | 1.543 (1.015–2.344) | 0.042 | 34.1 | ||
| Study type | Cross-sectional | 8 | 1.886 (1.429–2.437) | 0.000 | 63.2 | |
| Cohort | 1 | 4.000 (1.197–16.171) | 0.026 | NA | ||
| Marriage (Single status) | 13 | 1.362 (1.154–1.608) | 0.000 | 41.4 | ||
| Depression measurement | HADS | 1 | 1.100 (0.318–3.811) | 0.880 | NA | |
| PHQ-9 | 5 | 1.498 (1.230–1.826) | 0.000 | 20.8 | ||
| MINI-Plus | 1 | 1.292 (0.477–3.499) | 0.614 | NA | ||
| BDI-II | 1 | 0.494 (0.186–1.314) | 0.158 | NA | ||
| ICD-10 | 1 | 1.744 (0.785–3.874) | 0.172 | NA | ||
| HSCL-25 | 1 | 0.707 (0.252–1.984) | 0.510 | NA | ||
| HAM-D | 2 | 0.449 (0.201–1.002) | 0.051 | 0.0 | ||
| CES-D | 1 | 1.649 (1.004–2.709) | 0.048 | NA | ||
| Continent | Europe | 1 | 1.100 (0.318–3.811) | 0.880 | NA | |
| Asia | 6 | 0.748 (0.498–1.123) | 0.161 | 28.8 | ||
| Africa | 4 | 1.566 (1.277–1.920) | 0.000 | 0.0 | ||
| Oceania | 1 | 1.090 (0.490–2.422) | 0.832 | NA | ||
| South America | 1 | 1.649 (1.004–2.709) | 0.048 | NA | ||
| Study type | Cross-sectional | 10 | 0.816 (0.458–1.453) | 0.489 | NA | |
| Cohort | 3 | 1.427 (1.200–1.696) | 0.000 | NA | ||
| Case status (New treatment) | 6 | 2.515 (1.226–5.159) | 0.001 | 74.5 | ||
| Regression model type | AOR | 2 | 5.152 (1.172–22.652) | 0.030 | 84.5 | |
| COR | 4 | 1.475 (1.023–2.126) | 0.037 | 0.0 | ||
| Study type | Cross-sectional | 5 | 2.956 (1.315–6.645) | 0.009 | 77.9 | |
| Cohort | 1 | 1.000 (0.306–3.266) | 1.000 | NA | ||
| Continent | Europe | 1 | 1.000 (0.306–3.266) | 1.000 | NA | |
| Asia | 2 | 2.708 (1.039–7.056) | 0.041 | 0.0 | ||
| Africa | 3 | 3.192 (1.011–10.075) | 0.048 | 88.6 | ||
| Depression measurement | HADS | 1 | 1.000 (0.306–3.266) | 1.000 | NA | |
| PHQ-9 | 4 | 3.197 (1.259–8.119) | 0.015 | 83.4 | ||
| HSCL-25 | 1 | 1.900 (0.401–9.012) | 0.419 | NA | ||
| Residence (Urban residence) | 4 | 1.408 (1.122–1.767) | 0.010 | 0.0 | ||
| Perceived stigma (Without perceived stigma) | Depression measurement | 4 | 4.131 (1.412–12.088) | 0.010 | 94.9 | |
| HADS | 2 | 10.624 (7.546–14.967) | 0.000 | 0.0 | ||
| PHQ-9 | 2 | 1.661 (1.123–2.457) | 0.011 | 25.5 |
Discussion
In a previous study, the prevalence of depression was identified to be 1.54-fold higher [95% CI=1.45–1.64] in TB patients than in the general population.38 The high prevalence was also confirmed by a recent meta-analysis that the occurrence of depression in TB patients could be up to 45.19% [95% CI=38.04–51.37].4
This meta-analysis included 10,143 TB patients, 4230 of whom had depression and the remaining 5913 were normal. It has revealed that gender, social support, marriage status, education level, residence, case status, and perceived stigma were all significantly associated with occurrence of depression in TB patients. Those aforementioned factors can be classified into three categories: Socio demographic, psychosocial and clinical.
Socio Demographic
This category includes gender, residence, marriage status, and education level.
In terms of gender, numerous existing research has reported the gender difference in depression disorders, namely that women are more frequently diagnosed with major depression than men,39,40 a trend that has also been observed in adolescents41 and the elderly.42 The psychological differences in stress responses,43 as well as a higher level of negative self-perceptions,41 are also frequently discussed as reasons why women are more likely to develop depression. However, even if the existing evidence mentioned above has already reported that being female is at more risk of developing depression under normal circumstances, it is still necessary to explore whether women’s chance of getting depressed is higher than men among people with illness. The reason is that the targeted participants are patients rather than normal people, which is another factor that can affect the risk of getting depressed. The stereotype that women are more possible to be depressed can no longer fit the situation of TB patients. Therefore, how gender can contribute to the chance of getting depressed among TB patients is worthwhile to analyze. According to our meta-analysis, females TB patients are more likely than male TB patients to experience depression episodes, which is consistent with the general trend.
In the subgroup analysis using depression assessment as the variable, we found that the heterogeneity of subgroup of studies using HADS, CES-D, ICD-10, and HAM-D was all minute while significant heterogeneity was observed in studies using PHQ-9. This phenomenon indicates that using different depression scales may contribute to the overall significant heterogeneity.
The fact that female gender is more associated with depression in TB patients makes it necessary for hospitals to conduct some depression prevention programs according to the particularity and basic need of women and the necessity of further research concerning the design of such programs has been proved.
For the residential area, our meta-analysis showed that TB patients living in rural areas were more likely to become depressed than those living in urban areas. The reason for this could be that rural residents were more reliant on pharmacotherapy than psychotherapy due to the lack of psychotherapists in rural areas.44 Specifically, many medications used in the treatment of tuberculosis can have significant adverse psychiatric effects and some medications such as rifampicin may reduce the effective doses of anti-psychotics of their enzyme induction actions.45 It is also probable that the treatment was always delayed in rural regions due to relatively poor conditions.46 This findings advocates that psychotherapy, as well as the treatment condition, is supposed to be developed in the rural areas.
In the meta-analysis, we also discovered that TB patients who were married had a higher risk of depression than those who were single [OR=1.362, 95% CI=1.154–1.608, p=0.000]. However, the results contradict the results of another study, which found that marriage is associated with psychological gains and lowers the risk of depression.47 Another study’s findings may explain this incongruity by proposing that TB’s disruption of the gendered roles of wife and mother may impact the willingness of accepting them as normal people in the marriage,48 which is likely one of the causes of this risk factor.
In the subgroup analysis that included depression assessment as a pre-specified variable, we discovered that the heterogeneity of the studies using HAM-D and PHQ-9 was both less than the overall heterogeneity, particularly for the studies using HAM-D. Hence, we can infer that the different depression assessment may contribute to the final heterogeneity of the included studies. The same situation was observed in the subgroup-analysis with continent and study design as pre-specified variables, indicating that continent and study design are also origins of heterogeneity.
Regarding education, our findings show that TB patients without a secondary or higher education (<8 grade) are 1.92 times more likely to develop depression than those with a secondary or higher education [95% CI=1.475–2.503, p=0.000]. A previous study in Japan on the relationship between education level and postpartum depression found that a lower education level was associated with a higher prevalence of depression and depressive symptoms, which is similar to the situation in TB patients.49 Other than that, higher education has been shown to reduce depression and improve quality of life in the elderly population.50 Conversely, high prevalence of depression was shown in low education adolescents by a previous meta-analysis.51 It is possible that people with a higher education have a better chance of receiving health-related education, which has been shown to be effective in preventing major depression.52
The analysis of education level subgroups using variable depression assessment revealed insignificant heterogeneity in studies using HADS but significant heterogeneity in studies using PHQ-9. It indicates that the use of different depression measurement in the studies is one part of the origin of overall heterogeneity. The reduction of heterogeneity was also observed in two subgroups with studies conducted in Oceania and Asia, respectively, while the studies performed in Africa was still significantly heterogeneous. Therefore, continent was also a factor that contributes to the general heterogeneity.
Psychosocial
This category includes social support and perceived stigma.
In our study, we found that TB patients who lack strong social support are more likely to develop depression, with an odds ratio about 4.11-fold higher than those who have strong social support. Similar result was shown by some other studies, presenting that the scores of Social Support Rating Scale (SSRS) was negatively associated with depression, and no perceived confidant social support was significantly related to depressive state.53,54 Moreover, previous research has shown that strong social support, particularly confidant support, can buffer the association between depression and suicidal ideation, thereby reducing the negative impact of depression.55 In this case, it is obvious that providing TB patients with sufficient social support is an appropriate and effective method to prevent them from being depressed.
The heterogeneity of the two subgroups, classified by depression assessment, using HADS and PHQ-9, is still significant in the subgroup analysis. This suggests that the source of heterogeneity is not primarily due to differences in depression measurement. Besides, the subgroups classified by regression model type do not show a reduction in heterogeneity, indicating that the regression model type does not contribute to heterogeneity. Other factors leading to the general heterogeneity still need to be explored. For example, nature of social support may be different in continents classified by whether the countries are developed. However, the included studies offering available data about social support are all conducted in Africa which prevents us from doing subgroup analysis by this variable.
Furthermore, our meta-analysis identified that TB patients with a perceived stigma are associated with depression with an odd ratio of 4.131. Similar result was shown in recent studies, presenting that patient perspectives toward TB stigma were significantly related to depression,56,57 and along with body mass index, can account for 34% variations in depression, suggesting that it may be a predictor of depression in initially diagnosed TB patients.56 Furthermore, the prevalence of perceived stigma in TB patients is high. Two studies conducted in Ethiopia reported a 42.4% and 57.1% prevalence of tuberculosis-related perceived stigma, respectively,37,57 while one study conducted in Pakistan reported a 57% prevalence of TB associated high level stigma.58 Considering the high prevalence of perceived stigma in TB patients which is an absolute risk factor for depression, it is urgent to take measures to buffer the stigma.
The heterogeneity of both studies with HADS and studies with PHQ-9 in the subgroup analysis, classified by depression assessment, is insignificant, indicating that the original heterogeneity is partly composed by different depression assessments. We could have understood the clinical implication of stigma as a risk factor better for depression if subgroup analysis in terms of study type was conducted due to the fact that perceived stigma may differ overtime. Unfortunately, the available data about perceived stigma all came from cross-sectional studies.
Clinical
In our meta-analysis, the incidence of depression in TB patients in retreatment is about 2.515-fold higher than in new treatment. Another study that looked into the factors that contributed to suicidal behavior in tuberculosis patients discovered that being a TB re-treatment patient was significantly related to suicidal ideation.59 Consequently, more care and attention should be paid to retreatment patients.
According to the subgroup analysis, the heterogeneity of the subgroup composed by studies using COR as an estimate is insignificant when classified by regression model type, implying that regression model type contributes to the overall heterogeneity. Similarly, the subgroup of studies conducted in Asia has insignificant heterogeneity, indicating that the continent is an origin of overall significant heterogeneity.
Limitations
Despite the fact that 25 studies were included in our meta-analysis, a large amount of data from the included studies was not used in the analysis, such as variables like pain, income, alcohol use, and thus the included data in some subgroups is inadequate. Moreover, though some variables prespecified for the subgroup analysis may explain the overall heterogeneity of some risk factors, the origin of the heterogeneity of some groups remains unknown. Besides, high quality did not exist in all of the included literatures. As a result, more comprehensive and high-quality studies are required to validate the estimated risk factors.
Conclusion
A number of risk factors associated with depression in TB patients were identified in the meta-analysis, including female gender, inadequate social support, marriage status, education level below 8 grades, rural residence, retreatment case status, and perceived stigma. Therefore, measurements of the risk factors should be taken to prevent tragic depression in TB patients, which worsens their hardship. For example, generating volunteers for more social support, spreading health-related courses and knowledge to people without high education, providing patients living in rural areas with mental care and psychotherapists.
Acknowledgments
We would like to thank the researchers and study participants for their contributions.
Funding Statement
There is no funding to report.
Data Sharing Statement
All data relevant to the study are included in the article.
Author Contributions
RS designed the study and write the manuscript. RS and KZ implemented the thought with software, analyzed the data. RS and KZ screened the literature and extracted the relevant data and evaluated the quality. RS and JL dedicated in results analysis and manuscript revision. RS and JL participated into analysis implementation and organized discussion of the results. LZ supervised the study and gave guidance. All authors made a significant contribution to the work reported, whether that is in the conception, study design, execution, acquisition of data, analysis and interpretation, or in all these areas; took part in drafting, revising or critically reviewing the article; gave final approval of the version to be published; have agreed on the journal to which the article has been submitted; and agree to be accountable for all aspects of the work.
Disclosure
The authors declare that they have no competing interests.
References
- 1.Chakaya J, Khan M, Ntoumi F, et al. Global tuberculosis report 2020 - reflections on the global TB burden, treatment and prevention efforts. IJID. 2021;113 Suppl 1(Suppl 1):S7–s12. doi: 10.1016/j.ijid.2021.02.107 [DOI] [PMC free article] [PubMed] [Google Scholar]
- 2.Dos Santos AP, Lazzari TK, Silva DR. Health-related quality of life, depression and anxiety in hospitalized patients with tuberculosis. Tuberc Respir Dis. 2017;80(1):69–76. doi: 10.4046/trd.2017.80.1.69 [DOI] [PMC free article] [PubMed] [Google Scholar]
- 3.Wang XB, Li XL, Zhang Q, et al. A survey of anxiety and depressive symptoms in pulmonary tuberculosis patients with and without tracheobronchial tuberculosis. Front psychiatr. 2018;9:308. doi: 10.3389/fpsyt.2018.00308 [DOI] [PMC free article] [PubMed] [Google Scholar]
- 4.Duko B, Bedaso A, Ayano G. The prevalence of depression among patients with tuberculosis: a systematic review and meta-analysis. Ann Gen Psychiatry. 2020;19:30. doi: 10.1186/s12991-020-00281-8 [DOI] [PMC free article] [PubMed] [Google Scholar]
- 5.Dasa TT, Roba AA, Weldegebreal F, et al. Prevalence and associated factors of depression among tuberculosis patients in Eastern Ethiopia. BMC Psychiatry. 2019;19(1):82. doi: 10.1186/s12888-019-2042-6 [DOI] [PMC free article] [PubMed] [Google Scholar]
- 6.Molla A, Mengesha A, Derajew H, Kerebih H. Suicidal ideation, attempt, and associated factors among patients with tuberculosis in Ethiopia: a Cross-Sectional Study. Psychiatr J. 2019;2019:4149806. doi: 10.1155/2019/4149806 [DOI] [PMC free article] [PubMed] [Google Scholar]
- 7.Koyanagi A, Vancampfort D, Carvalho AF, et al. Depression comorbid with tuberculosis and its impact on health status: cross-sectional analysis of community-based data from 48 low- and middle-income countries. BMC Med. 2017;15(1):209. doi: 10.1186/s12916-017-0975-5 [DOI] [PMC free article] [PubMed] [Google Scholar]
- 8.Pachi A, Bratis D, Moussas G, Tselebis A. Psychiatric morbidity and other factors affecting treatment adherence in pulmonary tuberculosis patients. Tuberc Res Treat. 2013;2013:489865. doi: 10.1155/2013/489865 [DOI] [PMC free article] [PubMed] [Google Scholar]
- 9.Morris MD, Quezada L, Bhat P, et al. Social, economic, and psychological impacts of MDR-TB treatment in Tijuana, Mexico: a patient’s perspective. Int J Tuberc Lung Dis. 2013;17(7):954–960. doi: 10.5588/ijtld.12.0480 [DOI] [PMC free article] [PubMed] [Google Scholar]
- 10.Obadeji A, Oluwole LO, Kumolalo BF, Oderinde KO, Piwuna CG. Psychological distress in a population of people living with HIV/AIDS in Nigeria. Trop Doct. 2021. doi: 10.1177/00494755211064654 [DOI] [Google Scholar]
- 11.Peltzer K, Naidoo P, Matseke G, Louw J, McHunu G, Tutshana B. Prevalence of psychological distress and associated factors in tuberculosis patients in public primary care clinics in South Africa. BMC Psychiatry. 2012;12:89. doi: 10.1186/1471-244X-12-89 [DOI] [PMC free article] [PubMed] [Google Scholar]
- 12.Naidoo P, Mwaba KJSB, Journal PAI. Helplessness, depression, and social support among people being treated for tuberculosis in South Africa. Amino Acids. 2010;38(10):1323–1333. doi: 10.1007/s00726-009-0340-x [DOI] [PubMed] [Google Scholar]
- 13.Tola HH, Shojaeizadeh D, Garmaroudi G, et al. Psychological distress and its effect on tuberculosis treatment outcomes in Ethiopia. Glob Health Action. 2015;8:29019. doi: 10.3402/gha.v8.29019 [DOI] [PMC free article] [PubMed] [Google Scholar]
- 14.Institute JBIJATJB. Joanna Briggs Institute Reviewers’ Manual: 2014 Edition. 2014:88–91 [Google Scholar]
- 15.Wells GA, Shea B, O’Connell D, et al. The Newcastle-Ottawa Scale (NOS) for assessing the quality of nonrandomised studies in meta-analyses. Oxford; 2000. [Google Scholar]
- 16.Ambaw F, Mayston R, Hanlon C, Alem A. Burden and presentation of depression among newly diagnosed individuals with TB in primary care settings in Ethiopia. BMC Psychiatry. 2017;17(1):57. doi: 10.1186/s12888-017-1231-4 [DOI] [PMC free article] [PubMed] [Google Scholar]
- 17.Naidu T, Pillay SR, Ramlall S, et al. Major depression and stigma among individuals with multidrug-resistant tuberculosis in South Africa. Am J Trop Med Hyg. 2020;103(3):1067–1071. doi: 10.4269/ajtmh.19-0426 [DOI] [PMC free article] [PubMed] [Google Scholar]
- 18.Mohammedhussein M, Alenko A, Tessema W, Mamaru A. Prevalence and associated factors of depression and anxiety among patients with pulmonary tuberculosis attending treatment at public health facilities in Southwest Ethiopia. Neuropsychiatr Dis Treat. 2020;16:1095–1104. doi: 10.2147/NDT.S249431 [DOI] [PMC free article] [PubMed] [Google Scholar]
- 19.Castro-Silva KM, Carvalho AC, Cavalcanti MT, et al. Prevalence of depression among patients with presumptive pulmonary tuberculosis in Rio de Janeiro, Brazil. Revista brasileira de psiquiatria. 2019;41(4):316–323. doi: 10.1590/1516-4446-2018-0076 [DOI] [PMC free article] [PubMed] [Google Scholar]
- 20.Kehbila J, Ekabe CJ, Aminde LN, Noubiap JJ, Fon PN, Monekosso GL. Prevalence and correlates of depressive symptoms in adult patients with pulmonary tuberculosis in the Southwest Region of Cameroon. Infect Dis Poverty. 2016;5(1):51. doi: 10.1186/s40249-016-0145-6 [DOI] [PMC free article] [PubMed] [Google Scholar]
- 21.Molla A, Mekuriaw B, Kerebih H. Depression and associated factors among patients with tuberculosis in Ethiopia: a cross-sectional study. Neuropsychiatr Dis Treat. 2019;15:1887–1893. doi: 10.2147/NDT.S208361 [DOI] [PMC free article] [PubMed] [Google Scholar]
- 22.Ugarte-Gil C, Ruiz P, Zamudio C, et al. Association of major depressive episode with negative outcomes of tuberculosis treatment. PLoS One. 2013;8(7):e69514. doi: 10.1371/journal.pone.0069514 [DOI] [PMC free article] [PubMed] [Google Scholar]
- 23.Walker IF, Khan AM, Khan AM, et al. Depression among multidrug-resistant tuberculosis patients in Punjab, Pakistan: a large cross-sectional study. Int J Tuberc Lung Dis. 2018;22(7):773–778. doi: 10.5588/ijtld.17.0788 [DOI] [PubMed] [Google Scholar]
- 24.Zainuddin AA, Ramadany S, Santoso A. Depression among patients with pulmonary tuberculosis at the state hospital of makassar. Indian J Community Med. 2020;45(4):531–533. doi: 10.4103/ijcm.IJCM_50_20 [DOI] [PMC free article] [PubMed] [Google Scholar]
- 25.Walker IF, Kanal S, Baral SC, et al. Depression and anxiety in patients with multidrug-resistant tuberculosis in Nepal: an observational study. Public Health Action. 2019;9(1):42–48. doi: 10.5588/pha.18.0047 [DOI] [PMC free article] [PubMed] [Google Scholar]
- 26.Stoichita A, Dumitrescu A, Ciobanu A, et al. Depression and anxiety symptoms among people with rifampicin-resistant tuberculosis receiving in-patient care in the National Pulmonology Reference Institute in Romania. Monaldi Archiv Chest Dis. 2021;91(1). doi: 10.4081/monaldi.2021.1704 [DOI] [PubMed] [Google Scholar]
- 27.Oh KH, Choi H, Kim EJ, Kim HJ, Cho SI. Depression and risk of tuberculosis: a nationwide population-based cohort study. Int J Tuberc Lung Dis. 2017;21(7):804–809. doi: 10.5588/ijtld.17.0038 [DOI] [PubMed] [Google Scholar]
- 28.Salodia UP, Sethi S, Khokhar A. Depression among tuberculosis patients attending a DOTS centre in a rural area of Delhi: a cross-sectional study. Indian J Public Health. 2019;63(1):39–43. doi: 10.4103/ijph.IJPH_109_18 [DOI] [PubMed] [Google Scholar]
- 29.Paradesi RK, Ekramulla S, Kamuju NR, Nallapaneni NR, Srikanta SJ, Research D. Prevalence and associated factors of major depressive disorder among pulmonary tuberculosis patients. J Clin Diagn Res. 2020. doi: 10.7860/JCDR/2020/44393.13817 [DOI] [Google Scholar]
- 30.Ige OM, Lasebikan VO. Prevalence of depression in tuberculosis patients in comparison with non-tuberculosis family contacts visiting the DOTS clinic in a Nigerian tertiary care hospital and its correlation with disease pattern. Ment Health Fam Med. 2011;8(4):235–241. [PMC free article] [PubMed] [Google Scholar]
- 31.Singh V, Verma SK, Kumar A, et al. Prevalence of depression among newly diagnosed mdr tuberculosis patients at the time of registration- an experience from dots plus centre. F1000Research. 2018;7(4):519–523. doi: 10.12688/f1000research.14612.2 [DOI] [PMC free article] [PubMed] [Google Scholar]
- 32.Kuching S, Ying TC, Abd Aziz NA. Prevalence of depression and associated factors among tuberculosis patients in primary care in the district of kuching, sarawak. Sains Malaysiana. 2020;49(5):1089–1096. [Google Scholar]
- 33.Yohannes K, Mokona H, Abebe L, et al. Prevalence of depressive symptoms and associated factors among patients with tuberculosis attending public health institutions in Gede’o zone, South Ethiopia. BMC Public Health. 2020;20(1):1702. doi: 10.1186/s12889-020-09794-z [DOI] [PMC free article] [PubMed] [Google Scholar]
- 34.Gong Y, Yan S, Qiu L, et al. Prevalence of depressive symptoms and related risk factors among patients with tuberculosis in China: a Multistage Cross-Sectional Study. Am J Trop Med Hyg. 2018;98(6):1624–1628. doi: 10.4269/ajtmh.17-0840 [DOI] [PMC free article] [PubMed] [Google Scholar]
- 35.Dong X, Zhao L, Sun T, Yun F, Qiu L. Prevalence of depressive symptoms and associated factors among internal migrants with tuberculosis: a Cross-Sectional Study in China. Am J Trop Med Hyg. 2020;102(1):31–35. doi: 10.4269/ajtmh.19-0542 [DOI] [PMC free article] [PubMed] [Google Scholar]
- 36.Shrestha SK, Joshi S, Bhattarai RB, et al. Prevalence and risk factors of depression in patients with drug-resistant tuberculosis in Nepal: a cross-sectional study. J Clin Tuberc Other Mycobact Dis. 2020;21:100200. doi: 10.1016/j.jctube.2020.100200 [DOI] [PMC free article] [PubMed] [Google Scholar]
- 37.Duko B, Gebeyehu A, Ayano G. Prevalence and correlates of depression and anxiety among patients with tuberculosis at WolaitaSodo University Hospital and Sodo Health Center, WolaitaSodo, South Ethiopia, Cross sectional study. BMC Psychiatry. 2015;15:214. doi: 10.1186/s12888-015-0598-3 [DOI] [PMC free article] [PubMed] [Google Scholar]
- 38.Shen TC, Wang CY, Lin CL, et al. People with tuberculosis are associated with a subsequent risk of depression. Eur J Intern Med. 2014;25(10):936–940. doi: 10.1016/j.ejim.2014.10.006 [DOI] [PubMed] [Google Scholar]
- 39.Breslau N. The epidemiology of trauma, PTSD, and other posttrauma disorders. Trauma Violence Abuse. 2009;10(3):198–210. doi: 10.1177/1524838009334448 [DOI] [PubMed] [Google Scholar]
- 40.Luxton DD, Skopp NA, Maguen S. Gender differences in depression and PTSD symptoms following combat exposure. Depress Anxiety. 2010;27(11):1027–1033. doi: 10.1002/da.20730 [DOI] [PubMed] [Google Scholar]
- 41.Eberhart NK, Shih JH, Hammen CL, Brennan PA. Understanding the sex difference in vulnerability to adolescent depression: an examination of child and parent characteristics. J Abnorm Child Psychol. 2006;34(4):495–508. doi: 10.1007/s10802-006-9020-4 [DOI] [PubMed] [Google Scholar]
- 42.Rubinow DR, Schmidt PJ. Sex differences and the neurobiology of affective disorders. Neuropsychopharmacology. 2019;44(1):111–128. doi: 10.1038/s41386-018-0148-z [DOI] [PMC free article] [PubMed] [Google Scholar]
- 43.Bangasser DA, Eck SR, Ordoñes Sanchez E. Sex differences in stress reactivity in arousal and attention systems. Neuropsychopharmacology. 2019;44(1):129–139. doi: 10.1038/s41386-018-0137-2 [DOI] [PMC free article] [PubMed] [Google Scholar]
- 44.Fortney JC, Harman JS, Xu S, Dong F. The association between rural residence and the use, type, and quality of depression care. J Rural Health. 2010;26(3):205–213. doi: 10.1111/j.1748-0361.2010.00290.x [DOI] [PubMed] [Google Scholar]
- 45.Doherty AM, Kelly J, McDonald C, O’Dywer AM, Keane J, Cooney J. A review of the interplay between tuberculosis and mental health. Gen Hosp Psychiatry. 2013;35(4):398–406. doi: 10.1016/j.genhosppsych.2013.03.018 [DOI] [PubMed] [Google Scholar]
- 46.Mahendradhata Y, Syahrizal BM, Utarini A. Delayed treatment of tuberculosis patients in rural areas of Yogyakarta province, Indonesia. BMC Public Health. 2008;8:393. doi: 10.1186/1471-2458-8-393 [DOI] [PMC free article] [PubMed] [Google Scholar]
- 47.Meyer D, Paul R. A cross-national examination of marriage and early life stressors as correlates of depression, anxiety, and stress. Family J. 2011;19(3):274–280. [Google Scholar]
- 48.Hatherall B, Newell JN, Emmel N, Baral SC, Khan MA. “Who Will Marry a Diseased Girl?” Marriage, gender, and tuberculosis stigma in Asia. Qual Health Res. 2019;29(8):1109–1119. doi: 10.1177/1049732318812427 [DOI] [PMC free article] [PubMed] [Google Scholar]
- 49.Matsumura K, Hamazaki K, Tsuchida A, Kasamatsu H, Inadera H. Education level and risk of postpartum depression: results from the Japan Environment and Children’s Study (JECS). BMC Psychiatry. 2019;19(1):419. doi: 10.1186/s12888-019-2401-3 [DOI] [PMC free article] [PubMed] [Google Scholar]
- 50.Corry M, Neenan K, Brabyn S, Sheaf G, Smith V. Telephone interventions, delivered by healthcare professionals, for providing education and psychosocial support for informal caregivers of adults with diagnosed illnesses. Cochrane Database Syst Rev. 2019;5(5):Cd012533. doi: 10.1002/14651858.CD012533.pub2 [DOI] [PMC free article] [PubMed] [Google Scholar]
- 51.Kempfer SS, Fernandes GCM, Reisdorfer E, et al. Epidemiology of depression in low income and low education adolescents: a systematic review and meta-analysis. Grant Med J. 2017;2(04):067–077. [Google Scholar]
- 52.Uebelacker LA, Tremont G, Gillette LT, et al. Adjunctive yoga v. health education for persistent major depression: a randomized controlled trial. Psychol Med. 2017;47(12):2130–2142. doi: 10.1017/S0033291717000575 [DOI] [PMC free article] [PubMed] [Google Scholar]
- 53.Chen X, Zhao Y, Xu Y, et al. [Analyzing the status of depression and anxiety of new registered tuberculosis outpatients and correlations with social support influence factors]. Zhonghua Yi xue Za Zhi. 2016;96(34):2749–2753. Chinese. doi: 10.3760/cma.j.issn.0376-2491.2016.34.013 [DOI] [PubMed] [Google Scholar]
- 54.Masumoto S, Yamamoto T, Ohkado A, Yoshimatsu S, Querri AG, Kamiya Y. Prevalence and associated factors of depressive state among pulmonary tuberculosis patients in Manila, The Philippines. Int J Tuberc Lung Dis. 2014;18(2):174–179. doi: 10.5588/ijtld.13.0335 [DOI] [PubMed] [Google Scholar]
- 55.Fredrick SS, Demaray MK, Malecki CK, Dorio NB. Can social support buffer the association between depression and suicidal ideation in adolescent boys and girls? Psychol Schools. 2018;55(5):490–505. [Google Scholar]
- 56.Lee LY, Tung HH, Chen SC, Fu CH. Perceived stigma and depression in initially diagnosed pulmonary tuberculosis patients. J Clin Nurs. 2017;26(23–24):4813–4821. doi: 10.1111/jocn.13837 [DOI] [PubMed] [Google Scholar]
- 57.Mohammedhussein M, Hajure M, Shifa JE, Hassen TA. Perceived stigma among patient with pulmonary tuberculosis at public health facilities in southwest Ethiopia: a cross-sectional study. PLoS One. 2020;15(12):e0243433. doi: 10.1371/journal.pone.0243433 [DOI] [PMC free article] [PubMed] [Google Scholar]
- 58.Ali SM, Anjum N, Ishaq M, et al. Community knowledge about tuberculosis and perception about tuberculosis-associated stigma in Pakistan. Societies. 2019;9(1):9. [Google Scholar]
- 59.Peltzer K, Louw J. Prevalence of suicidal behaviour & associated factors among tuberculosis patients in public primary care in South Africa. Indian J Med Res. 2013;138(2):194–200. [PMC free article] [PubMed] [Google Scholar]


