

Summary
Ex-utero regulation of the lungs’ responses to breathing air and continued alveolar development shape adult respiratory health. Applying single-cell transposome hypersensitive site sequencing (scTHS-seq) to over 80,000 cells, we assembled the first regulatory atlas of postnatal human and mouse lung alveolar development. We defined regulatory modules and elucidated new mechanistic insights directing alveolar septation, including alveolar type 1 and myofibroblast cell signaling and differentiation, and a unique human matrix fibroblast population. Incorporating GWAS, we mapped lung function causal variants to myofibroblasts and identified a pathogenic regulatory unit linked to lineage marker FGF18, demonstrating the utility of chromatin accessibility data to uncover disease mechanism targets. Our regulatory map and analysis model provide valuable new resources to investigate age-dependent and species-specific control of critical developmental processes. Furthermore, these resources complement existing atlas efforts to advance our understanding of lung health and disease across the human lifespan.
Keywords: lung development, alveolus, chromatin accessibility, transcriptional regulation, human cell atlas, mouse cell atlas
Graphical abstract
Highlights
Chromatin accessibility map of human and mouse postnatal alveolar development
Construction of regulatory modules directing alveolar cell differentiation
Temporal and interspecies gene regulation of mechanical stretch signaling
Disease risk variants mapped to regulatory units in developmental cell types
Duong et al. produce single-cell chromatin accessibility profiles from human and mouse lungs during critical alveolar development stages after birth. They present a computational template to characterize developmental cell types, construct regulatory modules to propose cell lineage-specific transcription factors directing expression of marker genes, and identify regulatory units critical to pathogenesis.
Introduction
Embryonic and childhood pulmonary development lay the foundation for optimal lung growth, function, and responses to the environment. The origins of many adult lung diseases may be traced back to aberrations in these early processes. Our current understanding of mechanisms driving human lung development is sparse and largely stems from interrogating mouse models. Mice, however, are born with lungs at an earlier stage of development. Morphologic, cellular, and molecular differences strongly indicate that unique aspects of human pulmonary development can only be understood by directly examining human cells and tissues.1 Limited access to tissue has been a barrier to studying human lung especially during alveologenesis, which is the most commonly disrupted process in lung disease.2
In humans, the formation of critical alveoli largely (∼90%) occurs postnatally in two phases.3 The first is characterized by alveolar septation, which subdivides distal saccules into alveoli lined by two epithelial cell types: flat type 1 (AT1) cells essential for gas-exchange and surfactant-secreting type 2 (AT2) cells.4,5 The surrounding alveolar mesenchyme contains myofibroblasts (myoFB) characterized by alpha smooth muscle actin (ACTA2), contraction of which forms septal ridges that are vital for alveologenesis.2,6,7 The localization of alveolar myoFBs has been shown to be dependent on the production of platelet derived growth factor subunit A (PDGFA) by epithelial cells to signal cognate platelet-derived growth factor receptor A+ (PDGFRA) mesenchymal progenitors.8, 9, 10 In addition to epithelial-mesenchymal interactions critical to alveolar septation, mechanical forces during postnatal breathing, including stretch-dependent processes, promote alveolar cell differentiation and proliferation.11 The second phase of alveologenesis consists of continued septation from mature septa, mechanisms for which remain unclear.
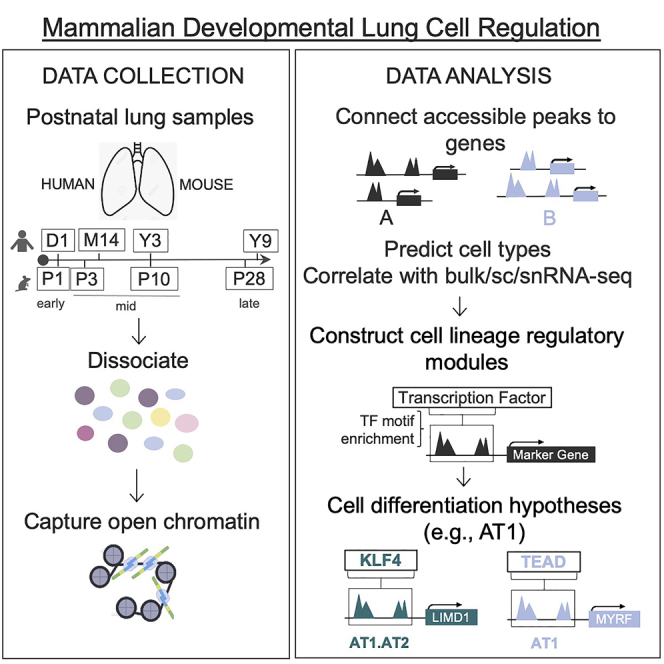
A surge in the development and successful application of high-throughput, single-cell (sc) transcriptomic approaches to profile human tissues is revolutionizing our ability to more comprehensively characterize human lung cell types. Collaborative efforts by the Human Cell Atlas (HCA, www.humancellatlas.org),12 the Human BioMolecular Atlas Program (HuBMAP, www.hubmapconsortium.org), and the Lung Molecular Atlas Program (LungMAP, www.lungmap.net)13 are underway to produce healthy Human Lung Cell Atlases. To augment these efforts, we utilized scTHS-seq14 to generate a human and mouse epigenetic atlas to contribute a critical regulatory dimension during postnatal lung development. By optimizing the dissociation of archived lung tissue and processing all samples in one run, we captured 40,427 human and 41,476 mouse sc accessible chromatin datasets with minimal batch effects across four time points each beginning at postnatal day one. We assembled a computational pipeline to define key cellular states, construct critical species-specific regulatory modules, and locate pathogenic regulatory units enriched in lung disease causal variants. Delving into human day of life 1, we set out to better understand how the lungs respond to breathing air and uncovered regulatory mechanisms essential to alveolar septation and functionally relevant to ex-utero breathing. We then tracked these regulatory signals across development and species for comparison. This is the first study to characterize open chromatin in single cells from human neonatal and pediatric “healthy” lung tissue during the most critical period of alveolarization and demonstrates the strength of chromatin accessibility profiles to expose cell-type-specific regulation of key developmental transitions.
Results
Construction of a sc open chromatin atlas profiling postnatal human and mouse lung development
We applied scTHS-seq to 4 human donor lungs collected on day 1 (D1) of life, 14 months (M14), 3 years (Y3), and 9 years (Y9) of age with history of birth after full-term gestation and no known lung disease from the Biorepository for Investigation of Neonatal Disease of the Lung (BRINDL), plus age-correlated wildtype C57 Bl/6 mouse lungs harvested at postnatal days 1, 3, 10, and 28 (P1, P3, P10, and P28) (Figure 1A; Table S1A). An optimized nuclear isolation protocol was used to process flash frozen human lung biopsies (STAR Methods). To minimize potential batch effects, all 8 samples were processed simultaneously in one experiment using combinatorial indexing and library generation as previously described.14 For each species dataset, only cells with >1,500 unique reads were utilized resulting in a median of 7,542 and 7,159 unique mapped reads per cell for human and mouse, respectively. After additional quality filtering, our human lung dataset is composed of 40,427 single-cell profiles with 427,057 accessible peaks and 41,476 single cells with 345,486 accessible peaks for mouse.
Figure 1.

Lung cell types defined by scTHS-seq chromatin profiles
(A) Overview of workflow with single-cell isolation from archived lung tissue, application of scTHS-seq, and downstream de-novo cell-type identification and construction of regulatory modules. Human and mouse icons indicate corresponding species. For age alignment, a post-weaning, pre-pubertal human to mouse estimation of 1 human year equals 3.65 mouse days was used after postnatal day 1.15
(B and C) UMAP of human (40,427 cells) and mouse (41,476 cells) cell types predicted using peaks in promoter regions of marker genes and Cicero gene activity scores. Based on the majority of cells from different donor ages in each cluster, cell types were further annotated as early (day 1), mid (2 middle time points), or late (oldest time point). Each dot represents a cell and gray clusters represent un-classified populations.
(D and F) Dot plots of log-normalized gene activity scores for select genes in each cell type. The size of each dot corresponds to the percent of cells in that cell type with non-zero gene activity while the color corresponds to the average gene activity.
(E and G) Cell-type contribution from human and mouse lung developmental time point captured as a ratio of total cells.
See also Figures S1 and S2 and Tables S1 and S2.
scTHS-seq defined expected and newly described lung cell types
Applying our computational pipeline (STAR Methods), we identified 20 epigenetically distinct human clusters composed of 11 major cell types (Figure 1B) and 17 clusters with 10 major cell types for mouse (Figure 1C). Initially, major cell types were identified based on Cicero-linked gene activity scores,16 which connect open regulatory regions to genes and serve as an estimation of gene expression, and corresponding peaks in promoter regions of canonical markers (epithelial – EPCAM, CDH1; mesenchymal – COL6A3, PDGFRA; endothelial – PECAM1; immune – PTPRC) (Figure S1). To further classify and predict cell types within compartments, we ran a likelihood-ratio test using gene activity to identify top differential marker genes for each cluster (log fold difference > 0.09; STAR Methods; Figures 1D and 1F). Annotated clusters represented expected cell types, except for a cluster we labeled as mesenchymal progenitors (Mes.Prog, NFIB+, ZEB2+, DACH1+, ID3+, EBF1+) in both human and mouse. Epithelial compartments consisted of airway (AW, ELF3+, GRHL2+), alveolar type 2 (AT2, SFTPA1+, ABCA3+), alveolar type I (AT1, HOPX+, PDPN+, AGER+), and clusters with both AT1 and AT2 signatures labeled as AT1.AT2. Matrix fibroblasts (MFB, COL6A3+, PDGFRA+, WNT2+), myofibroblasts (MyoFB, ACTA2+), and pericytes (Peri, PDGRB+) were identified in the stromal populations. In human endothelial clusters (Endo, PECAM1+), we also identified lymphatic cells (Lymph, TBX1+) that did not clearly separate out in mouse at this level of resolution. Small immune (Imm, PTPRC+) clusters were present in both species.
To substantiate our cell type predictions, we correlated cluster gene activity markers with available human and mouse sorted bulk RNA-seq on the LungMAP Lung Gene Expression Analysis (LGEA) web portal (Figures S1C and S1D), published scRNA data (Figure S2),17, 18, 19, 20, 21 and independently merged and analyzed LGEA human pediatric (LungMAP_humanD1, M21, Y9, Y24) scRNA-seq datasets (STAR Methods; Figure S4).22, 23, 24 Correlation with bulk and sc gene expression supported all cell types we identified by scTHS-seq, except for Mes.prog clusters, which were only appreciated by chromatin accessibility profiling.
The mesenchymal progenitors we identified in both human and mouse datasets share high gene activity in similar genes (NFIB, ZEB2, DACH1, ID3, and EBF1) that have been connected to mesenchymal cells and stemness. Recently published work identifies a novel mouse fibroblast population expressing Ebf1.25 Xie et al. also describes a mesenchymal progenitor (MP) population seen in adult mice similar to LGEA embryonic day 16.5 (E16.5) proliferative mesenchymal progenitors (PMPs).26 We identified 182 human and 499 mouse differentially active (DA) genes (p value < 0.05) for our Mes.Prog clusters. Comparing differentially expressed (DE) genes in adult mouse MP and E16.5 PMPs, overlapping gene signatures were present (152/182 human and 415/499 mouse Mes.Prog DA genes in MP DE genes, 6/182 human and 13/499 mouse Mes.Prog DA genes in PMP DE genes) (Table S3). Overall, by combining the presence of peaks in promoter regions of marker genes and gene activity profiles, we classified expected cell types and a mesenchymal progenitor state in humans and mice.
Lung cellular diversity at human day 1 of life
Despite humans and mice being born with lungs at different stages of development (alveolar versus saccular), both species are capable of successful gas exchange ex-utero. To better understand cell types and transition states involved in these biological pathways, we further analyzed epithelial and mesenchymal clusters at human day of life 1 and connected active genes to developmentally relevant biological processes and disease.
Iterative clustering of D1 cells improved cell-type resolution for downstream regulatory analysis
We gathered all D1 cells in Figure 1B that belonged to an annotated cell type and performed iterative clustering to generate a higher resolution UMAP embedding (Figure S3A). Differential gene activity profiles were used to predict cell types (Figure S3B). Independent analysis of corresponding LGEA scRNA-seq for D1 was also completed (Figures S4D and S4E). To provide insight on cell-type-specific regulation, we applied ChromVAR to identify differential TF activities for each cluster (STAR Methods; Figure S3C).27,28 Several of the top TFs for each cell type aligned with previous descriptions such as regulatory factor X (RFX) for ciliated cells,29,30 NK2 homeobox 1 (NKX2-1) for alveolar epithelial cells,31,32 serum response factor (SRF) for myofibroblasts,33 Ets variant 2 (ETV2) for endothelial cells,34 and Spi-1 proto-oncogene (SPI1) for myeloid and lymphoid lineages,35 along with previously undescribed cell-type-specific TFs. The same analysis completed for mouse P1 also led to improved cell-type resolution (Figure S5).
Characterization of distal alveolar progenitor and epithelial populations
We identified two epithelial progenitor states at D1: Alv.Prog and AT1.AT2. AXIN2+ Alv.Prog cells contained regulatory elements related to NAV2, which plays a role in cellular growth and migration, and FZD2, a receptor for bronchoalveolar stem cells with a role in stem cell maintenance and differentiation (Figure S3B).36,37 Fzd2 expression is seen in bipotent progenitor cells from mouse distal epithelium at E18.5.38 Both Axin2 and Fzd2 can inhibit the WNT pathway promoting a progenitor-like state in lung epithelial cells and preventing differentiation.36,39,40 AT1.AT2 cells, active at both AT1 and AT2 genes (PDPN and MUC1) and signature genes (EGFR and SHH) (Figure S3B), are defined as intermediates or bipotent progenitors of AT1 and AT2 cells at E18.5 and P1.20,38,40,41 Our analysis additionally demonstrated notable high activity of AT1.AT2 cells near LIMD1, KRT8, KRT19, and CLDN4 (Figures 2A and 2B). Expression of LIMD1 is potentially relevant to the lungs’ quick adaptation to air-inflated breathing and cyclic stretch at birth as Limd1 is part of a tension-dependent pathway that limits Hippo activity where cell proliferation is needed.42 Immunofluorescent staining demonstrates LIMD1 co-staining with SFTPC and AGER in AT1.AT2 cells at day 1 in three donors, including donor 1 for which scTHS-seq data was collected (Figure 2C). Fewer triple-positive cells were present in Y3 donors and none were seen in the adult donor (Figures 2C and S3D). In Wang et al. snRNA-seq datasets, LIMD1 gene expression is seen in AT1/AT2-like cells at D1 in ∼30-week gestational age and ∼3 year donors (Figure 2D). Limd1 gene activity was also present in mouse AT1.AT2 cells during alveolar septation starting at P3 and peaking at P10 (Figure S5D). By zooming in on the epithelial compartment at D1, we uncovered a LIMD1+AT1.AT2 cell state linked to a biomechanical pathway possibly stimulating AT1 cell differentiation.
Figure 2.

Characterizing D1 alveolar epithelium cell states
(A) UMAP of annotated D1 alveolar epithelial clusters.
(B) Violin plots of gene activity levels for notable AT1.AT2 cell differentially accessible genes.
(C) Immunofluorescent LIMD1, AGER, and SFTPC staining in alveolar region of human in D1, Y3, and adult lung from different donors. White arrows indicate triple positive AT1.AT2 cells. Yellow arrows indicate AGER and LIMD1 in AT1 cells. scTHS-seq data collected from donor 1 in each age group except for adult sample. Scale bars units listed in bottom left corner for each image. See also Figure S3D.
(D) Dot plot of AT1.AT2 marker gene expression in AT1/AT2-like cells from Wang et al. snRNA-seq grouped by donor age, ∼30 weeks gestational age and 3 and 31 years old.
(E) GREAT significant GO biological processes for D1 AT1 clusters for top 2k differential peaks based on -log10(binomal p value)43.
(F) Dot plot of gene activity scores for AT1 marker genes in alveolar epithelial clusters.
Dynamic AT1 cell regulation
AT1 cells separated into two subpopulations (AT1_1 and AT1_2) (Figure 2A); genomic regions enrichment of annotations tool (GREAT)43 analysis suggested a growth state for AT1_1 (morphogenesis and insulin receptor signaling in epithelial cell differentiation) while AT1_2 cells demonstrated a more mature profile (membrane organization) (Figure 2E). AT1 clusters were active near canonical marker PDPN along with more contemporary markers: RTKN2, VEGFA, GPRC5A, and MYRF (Figure 2F).5,18,38,44 Both AT1 cell states were significantly linked to establishment of cellular polarity and regulation of PDGFR signaling pathway. Apical-basal polarity plays a role in cell fate decisions and the positioning of lung epithelial cells.45 AT1_2 negative regulation of EGFR/ERBB signaling suggested influence on the directional differentiation of AT1.AT2 cells as EGFR/ERBB signaling can induce AT2 renewal.20,41 AT1_2 cell to cell junction assembly and extracellular matrix (ECM) actin interactions functionally reinforce the alveolar epithelial barrier.46,47
Construction of AT1 regulatory modules
To ascertain mechanisms controlling AT1 differentiation from AT1.AT2 cells and AT1 proliferation after birth, we constructed regulatory modules by aligning cell-type-specific TFs and TF motifs enriched in active peaks (regulatory regions linked to expressed marker genes) (Figure 3A). First, examination of differential ChromVAR TF activities for human D1 AT1.AT2 and AT1 clusters identified KLF, NKX2, and TEAD as top lineage-defining TF candidates (Figures 3B and S3C). Expression of these TFs is seen in premature (∼30 week gestation age) human donors at birth (Figure 3C).21 Next, we located TF motifs that are overrepresented in differentially accessible (DA) regions linked to cell-type-defining genes (STAR Methods; Table S4). Motif enrichment analysis suggested TF binding to gene-specific regulatory elements. Directional regulation (activation or repression) of target gene expression was inferred based on sc or single-nucleus (sn) RNA-seq from similarly aged BRINDL donors (Figure 3E).21, 22, 23, 24 In Figure 3D, we examined accessible regions linked to DA genes enriched in KLF4, NKX2, and TEAD TF motifs. Regulatory peaks for AT1.AT2 genes LIMD1, KRT8, and EGFR were enriched in KLF4 motifs. NKX2 motif enrichment was present in AT1 markers (GPRC5A, CLDN18, and LMO7), apicobasal polarity genes (LAMA3, PATJ, and PRKCZ), general epithelial marker KRT7, and TEAD1. AT1_2 DA genes WWC2, LMO7, and MYRF were enriched in TEAD motifs. By aligning cell-type-specific TFs and enrichment of TF binding motifs in active peaks of cell-type marker genes, we constructed regulatory modules controlling AT1 differentation at D1 (Figure 3F).
Figure 3.

Identifying D1 regulatory modules driving AT1 differentiation during alveolar septation
(A) Schematic for regulatory module construction involving I. identification of candidate TFs and II. motif enrichment analysis of peaks linked to active cell-type marker genes.
(B) UMAP from Figure S3A re-colored with TF activity levels for key alveolar epithelial TFs.
(C) Dot plot of TF gene expression regulating AT1 cell differentiation in Wang et al. snRNA-seq by cell type in ∼30 week gestational age 1 day old (∼30 week D1) donors.
(D) Bar plots of -log10(p values) for select active genes (> 1 peak linked to gene and SE in AT1.AT2 or AT1 cells) with KLF4, NKX2, and TEAD motif enrichment.
(E) Dot plot of active AT1 gene expression in LGEA D1 scRNA-seq dataset.
(F) Proposed regulatory modules for D1 AT1.AT2 and AT1 cells. All marker genes in rectangles contained peaks enriched in KLF4, NKX2, or TEAD motifs. Genes listed in red are expressed in LGEA D1 AT1 cells.
+Gene expression present in AT1/AT2-like cells. See Figure 2D.
See also Table S4.
NKX2 TFs likely play a role in human AT1 cell differentiation, which is supported by recent efforts in mice demonstrating that Nkx2-1 is necessary for the initiation, development, and maintenance of AT1 cells.31,48 AT1_1 cells contained open TEAD1 peaks enriched in NKX2 motifs, indicating that NKX2 binding can trigger expression of TF TEAD1 (Figure 3D). TEAD1 is expressed by AT1 cells at LGEA D1 (Figure 3E). Temporal TEAD1 accessibility and expression likely allows for TEAD binding to AT1 accessible elements, such as MYRF. MYRF is a novel, potential master regulator of adult human and mouse AT1 cells.18 Mouse AT1 cells demonstrated similar Nkx2 and Tead TF activity at P1 (Figure S5C). By assembling regulatory modules using scTHS-seq and sc/sn-gene expression, we formed new developmental mechanism hypotheses involving differentiation of KLF4-directed LIMD1+KRT8+ AT1 precursors and TEAD-directed AT1 cell maturation as well as supporting NKX2-directed differentiation of alveolar epithelial cells.
TF regulation of AT1 cells across time points and species
Evaluation of human AT1 clusters from all time points revealed that AT1.late cells displayed divergent TF activity compared to earlier time points; this change is not seen in later mouse AT1 cells (Figures S6A and S6B). TEAD TF activity was again more specific for AT1 clusters in both species. Distinctive to human AT1.late clusters, significant differential TF activity was seen involving Jun proto-oncogene (JUN), Fos proto-oncogene (FOS), and nuclear factor erythroid 2 (NFE2). Jun plays a critical role in maintaining lung alveolar homeostasis and the loss of Jun contributes to lung inflammation and emphysema.49,50 NFE2 is linked to lung host response and cytoprotection against oxidative stress.51 Verification of inferred AT1 regulation across human time points was achieved by confirming the availability of appropriate TFs and corresponding available binding sites in AT1 populations. In Figure S6C, the temporal availability of TFs was established using TF gene activity scores. Alignment of regulatory regions in AT1 clusters with binding sites for NKX2-1, TEAD1, and JUN was examined near transcription start sites (TSS) of AT1 marker genes, GPRC5A and MYRF, using curated ChIP-seq analysis from ReMAP 2018 for various human cell lines (Figure S6C).52 A distal GPRC5A element only contained accessible peaks for early and mid AT1 cells and ChIP-seq peaks for NKX2-1 and TEAD1. In the AT1.late cluster, a dominant accessible element overlapped with abundant JUN ChIP-seq peaks. TF analysis across developmental time points demonstrated a synchronized pattern of TF accessibility and binding to direct AT1 cells.
Myofibroblasts and regulation of epithelial-mesenchymal interactions critical to alveolar septation
As seen in Figures 1E and 1G, 98% (949/971) of human myoFBs captured across all time points were from D1; however 63% (1,488/2,358) of mouse myoFBs were from P10. A substantial increase in myoFB contribution from P10 (compared to ∼15% from P1 and P3) likely reflects the surge in myoFBs needed during the peak of murine alveolar septation (P4 to P12). Subsequent myoFBs reduction to 6% (146/2,358) at P28 is consistent with prior lineage tracing2,53 and scRNA-seq studies.54 In humans, alveolar septation is estimated to occur from 36 weeks gestation to 3 years. ACTA2+ myoFBs captured by scTHS-seq and LGEA protein fluorescent immunostaining from BRINDL healthy lung donors of similar age corroborated the presence of myoFBs at septal ridges at D1 with fewer detected at this location at M14 and Y3 (Figure 4A).24 The postnatal cellular composition captured by scTHS-seq using our tissue processing protocol suggested a similar increase and decrease of myoFBs during human and murine alveolar septation.
Figure 4.

Alveolar myoFB regulatory units enriched in lung function causal variants
(A) Protein fluorescent immunostaining for NKX2-1, KI67, ACTA2, FN1, and ABCA3 in alveolar parenchyma of human lungs at D1, M14, and Y3 from LGEA Lung Imaging provided courtesy of Dr. Jeffrey Whitsett. Arrows indicate ACTA2+ staining at septal ridges. scTHS-seq data collected from donor 1 in each age group.
(B) Prediction of cell type targets in disease. Using gChromVAR, enrichment of GWAS causal variants for various lung traits and disease in scTHS-seq human lung clusters. Black dot represents significant enrichment with Z-score > 3.1.
(C) Genome browser plot displaying unique MyoFB.early regulatory region overlapping identified high causal probability lung function risk unit and nearest gene, FGF18.
(D) Dotplot of FGF18 gene activity in scTHS-seq human stromal cells and gene expression in myoFBs from Wang et al. snRNA-seq.
See also Table S5.
Alveolar myoFB regulatory units enriched in lung function causal variants
By combining causal variants for lung traits and our scTHS-seq data, we traced pathogenic risk to specific developmental lung cell types and regulatory units. Fine-mapped causal variants for lung diseases were obtained from CAUSALdb, a comprehensive database of uniformly processed GWAS summary statistics,55 and from a large GWAS study on lung function in the UK Biobank and SpiroMeta Consortium.56 We used two traits, FEV1 (forced expiratory volume in 1 second) and FEV1/FVC ratio (FVC, forced vital capacity), both markers of obstructive lung disease, to assess lung function. In Figure 4B, we applied g-chromVAR57 to calculate the enrichment of causal variants in regulatory regions of the 20 characterized human cell types from Figure 1B. Early myoFBs were enriched in causal variants linked to FEV1 and FEV1/FVC (Z score > 3.1). Furthermore, evaluation of lung function single nucleotide polymorphisms (SNPs) overlapping with accessible peaks revealed a common regulatory unit in chromosome 5 (chr5:171,474,530–171,474,621) for FEV1 and FEV1/FVC in MyoFB.early with causal probability (Figure 4C and Table S5). The closest gene to this lung function regulatory risk unit was fibroblast growth factor 18 (FGF18) located ∼15 kb downstream. Fgf18 labels myoFBs during alveolar septation,53 and adult small airway myoFBs are associated with decreased lung function in chronic obstructive pulmonary disease.58 MyoFBs expression of FGF18 in ∼30-week human lung donors corresponded to active FGF18 regulatory regions (Figure 4D). Enrichment analysis of lung disease causal variants revealed a genetic risk association for lung function impairment in specific regulatory units of early alveolar myoFBs.
Construction of alveolar epithelial signaling and myofibroblast regulatory modules
To further explore the role of myoFBs during alveolar septation, we identified two mesenchymal clusters with myoFB characteristics at D1 (myoFB_1, myoFB_2) (Figures 5A ands S3A). The myoFB_1 cluster demonstrated highest gene activity for PDGFRA and myoFB_2 for ACTA2 (Figure 5B). In mice as alveologenesis begins, Pdgfra+ progenitor cells give rise to Acta2+ alveolar myoFBs.2,7,59,60 PDGFRA+ human myoFB_1 is likely a myoFB progenitor or intermediate, which has been described previously.61, 62, 63, 64 Both myoFB clusters contained activity associated with myosin light chain kinase (MYLK), elastin (ELN), transforming growth factor beta induced (TGFBI), and latent transforming growth factor beta binding protein 1 (LTBP1) genes (Figure 5B). MyoFB_2 displayed additional myosin heavy chain 11 (MYH11) and myocardin (MYOCD) gene activity along with SRF TF activity (Figures 5C and S3C). MyoFB_1 was accessible near IGF1 which stimulates the proliferation and differentiation of lung fibroblasts into myoFBs.65 In the myoFB_1 cluster, differential TF analysis revealed highest activity of myocyte enhancer factor 2A (MEF2A) which is involved in muscle development, cell growth, and ECM remodeling (Figures 5C and S3C).66
Figure 5.

Exploring myofibroblast states at D1 and epithelial-mesenchymal regulatory modules guiding alveolar septation
(A) UMAP of annotated D1 AT1.AT2, AT1 and myoFB clusters.
(B) Dot plot of log-normalized gene activity scores for PDGFA and select myoFB DA genes.
(C) UMAP from Figure S3A re-colored with TF activity levels for key myoFB TFs.
(D) Bar plots of -log10(p values) for select active genes in myoFB_1 or myoFB_2 cells with significant NFATC, MEF2, and SRF motif enrichment.
(E) Dot plot of TF gene expression in Wang et al. snRNA-seq by myoFBs grouped by BRINDL donor age, ∼30 weeks gestational age, 3, and 31 years old.
(F) Dot plot of active gene expression in Wang et al. snRNA-seq grouped by donor age.
(G) Proposed regulatory modules for D1 PDGFA:PDGFRA signaling and myoFB differentiation. All marker genes in rectangles contained peaks enriched in TF motifs and are expressed in AT1 or myoFB clusters in Wang et al. sn RNA-seq at ∼30 week D1.
See also Table S4.
PDGFRA ligand PDGFA was accessible in AT1 and AT1.AT2 clusters at D1 (Figure 5B). In murine development, Pdgfa mRNA surges at P1 and P7,9 and sc expression is present in AT1/AT2, AT1, and AT2 cells at E18.5.23,38 Evaluation of PDGFA- and PDGFRA-specific regulatory regions in alveolar epithelial and myoFB cells at D1 revealed significant cell-type-specific TF activity and enrichment of KLF4 (Figures 3B and 3D) and nuclear factor of activated T cells (NFATC) binding motifs (Figures 5C and 5D) respectively. Nfat is a critical member in signaling networks governing myoFB differentiation and contraction;67, 68, 69 Acta2 expression in smooth muscle requires cooperative interaction between Nfat and Srf.69 Our analysis suggested that KLF4 binds to PDGFA regulatory regions in AT1.AT2 and AT1 cells activating PDGFA expression (Figures 3D, 5F, and 5G). In the mesenchyme, NFATC modulates PDGFRA expression in myoFB progenitors. Motif enrichment analysis of regulatory regions linked to target genes of the two D1 myoFB states identified MEF2 motifs overrepresented in LTBPI and MYLK regulatory elements and SRF motifs in ACTA2 and MYH11 peaks (Figure 5D), suggesting a regulatory module that first involves MEF2 activation of LTBPI transcription, TGFB pathway stimulation, and subsequent SRF binding to accessible ACTA2 regions driving expression and establishment of myoFB cell identity (Figure 5G). By honing in on PDGFA-PDGFRA receptor-ligand activity and myofibroblasts in D1 populations, we assembled regulatory modules for epithelial-mesenchymal communication and myofibroblast differentiation which may direct critical alveolar septal ridge formation.
Divergent mechanotransduction signaling in human stromal cells
PIEZO2, a mechanically activated channel that converts physical stress into chemical signals for cellular communication,70, 71, 72 was the most significant DA gene in human D1 MFB_1 (Figure 6A) with LGEA SE in corresponding matrixFB-1 (Figure 6B). In mouse, highest average Piezo2 gene activity was noted in P1 endothelial cells (Figure 6C), which did not correlate with LGEA P1 sc data (Figure 6D). A connectivity map visually summarizes Cicero co-accessibility scores between distal regulatory elements and promoters connected to PIEZO2 (co-accessibility cutoff = 0.25) (Figure 6E). For P1, fewer cis-regulatory elements were captured (co-accessibility cutoff = 0.1 indicating lower confidence in connections) (Figure 6F). Following changes across developmental time points, PIEZO2 accessibility peaked at D1 and waned over time in human (Figure 6G), consistent with LGEA sc and bulk RNA results (Figures S7A and S7B) and protein immunostaining (Figures 6H and S7C). In mouse endothelial and FB populations, the percent of cells containing active regions, gene activity, and bulk RNA expression remained low across time points (Figures S7D and S7E). Human D1 MFBs were characterized by PIEZO2 accessibility and expression, which was not similarly present in mouse.
Figure 6.

Divergent PIEZO2 mechanotransduction signaling in fibroblasts at postnatal day 1 and across development
(A–D) PIEZO2 gene activity and expression at D1 and P1. Log-normalized gene activity from all D1 (A) and P1 (C) cell types. Average expression in transcripts per million (TPM) from LGEA scRNA-seq database for D1 (B) and P1 (D) lung.
(E–F) Connectivity plots for human and mouse open chromatin regions linked to PIEZO2 and genome browser tracks with peaks highlighted for collapsed cell-type bigwigs. Height of connections represent Cicero co-accessibility score between connected peaks.
(G) PIEZO2 gene activity for all human matrix fibroblasts grouped by age.
(H) Immunofluorescent staining for PIEZO2 and ACTA2 in alveolar region of human in D1, Y3, and adult lung from different donors. scTHS-seq data collected from donor 1 in each age group except for adult sample. Scale bars units listed in bottom left corner for each image. See also Figure S7C.
(I) Dot plot of average expression of active genes in LGEA D1 scRNA-seq dataset.
(J) Proposed regulatory module for D1 MFB_1. All marker genes in rectangles contained peaks enriched in NHLH2 motifs and are expressed in MatrixFB1 cluster in LGEA D1 human.
To elucidate regulation of PIEZO2 expression, differential TF activity analysis revealed that a majority of top TFs in MFB_1 at D1 were from a diverse family of basic helix-loop-helix-zipper (bHLH-ZIP) TFs involved in fetal development.73 Interestingly, the top identified active TF was achaete-scute family bHLH TF 2 (ASCL2), a marker gene for rare epithelial, chemosensing tuft or brush cells (Figure S3C).74 Forty of the 110 TFs belonging to the bHLH TF family had significant activity in MFB_1 (p value < 0.01, ave logFC > 0.69, Table S4B).75 Motif enrichment analysis of PIEZO2 regulatory regions did not find significant ASCL2 enrichment, however, seven of the 40 active bHLH TF motifs in MFB_1 were enriched in PIEZO2 regulatory elements (p value < 0.05) with one of the seven being NHLH2. In Figure S7F, NHLH2 TF activity decreased with age across all human stroma clusters. MFB_1 markers that demonstrated significant gene activity and expression with NHLH2 binding motif enrichment are depicted in Figures 6I, 6J, and S7G. In summary, PIEZO2 was identified as a novel marker gene for a matrix FB subtype at human D1, its expression is likely regulated by a bHLH TF, and Piezo2 was not active in mouse matrix FBs across all sampled time points suggesting a species-specific difference in early developmental response pathways to stretch.
Discussion
In order to lay the foundation for a comprehensive sc regulatory atlas of human and mouse postnatal lung development, we produced high-quality data for ∼80,000 single cells, characterized cell types present, and uncovered new mechanistic insights driving cell differentiation and cross-compartmental interactions during alveolar septation. Annotated scTHS-seq cell types identified were those expected, but we also describe a large mesenchymal progenitor-like population in both human and mouse that shares the same signature gene activity profile (NFIB, ZEB2, DACH1, ID3, and EBF1). This is not too surprising, as our understanding of mesenchymal cell types is far from complete. Nfib controls late gestation epithelial and mesenchymal cell differentiation.76 Zeb2 is involved in maintaining stemness.77 Id3 regulates pluripotency of stem cells and is expressed in lung mesenchyme during mouse embryogenesis.78,79 Two studies identified Ebf1+ mesenchymal progenitor populations in mice.26,80 Liu et al. also identifies a homologous EBF1+ mesenchymal population in LGEA human scRNA-seq datasets from a healthy adult and M21 donor.80 Our Mes.Prog clusters may represent a similar progenitor state. Further studies are warranted to better classify these populations.
Within epithelial and mesenchymal compartments at D1, scTHS-seq allowed characterization of epithelial and mesenchymal subtypes not captured by scRNA-seq in LGEA datasets, such as those seen for AT1 cells and myofibroblasts (Figure S3). AT1.AT2 KRT8, KRT19, and CLDN4 gene activity overlapped with key genes identified in a mouse AT1 transitional cell state after injury;81, 82, 83 however, our neonatal AT1.AT2 cells lacked DNA damage response, senescence, and inflammatory signals. We uncovered regulatory modules critical to alveolar septation including AT1 and myoFB cell differentiation, AT1 to myoFB ligand-receptor interaction, and mechanotransduction signaling. During alveolar epithelial differentiation, gene and TF activity connections to Hippo signaling were noteworthy for intermediate AT1.AT2 and AT1 cells. The Hippo pathway regulates organ size, mechanotransduction, and the cellular transition to air breathing.84,85 Hippo kinases LATS1/2 require Limd1 for tension-dependent adherens junctions localization. High tension and low cell density causes Limd1-mediated recruitment and inhibition of LATS1/2, which then allows YAP/TAZ to complex with TEAD.42 Coinciding gene accessibility and expression of LIMD1 in AT1.AT2 cells (Figure 2) and TEAD TF activity in AT1 cells (along with preceding TEAD gene expression, and ChIP-seq binding sites in AT1 gene regulatory regions) (Figures 3 and S6) established a connection between physiologic changes at birth from air inflated stretch and stimulation of AT1 cell differentiation and proliferation via inactivation of the Hippo pathway. During manuscript revision, recent publications applying genetic mouse models 48,86,87 and a human 2D primary culture model 88 further support the role of Yap/Taz and Tead in AT1 cell development.
Despite the essential role of AT1 cells in gas exchange and lung disease, AT1 cell transcriptional regulation remains unclear. We propose a novel stretch-induced pathway signaling human AT1.AT2 cells to differentiate into AT1 cells and TEAD as an accompanying TF family involved in AT1 lineage-specific maturation (Figure 7A). Mouse conditional knockout studies reveal that TAZ is essential to alveolarization while YAP is critical to airway morphogenesis;89 therefore, inactivation of Hippo signaling may allow TAZ to complex with TEAD. LIMD1-linked differential peaks and reconstructed TEAD-gene accessibility modules identified potential cell-type-specific stretch-sensitive gene enhancers, which change with age and require further evaluation (Figure 3). Morever, significant KLF TF activity for AT1.AT2 cells and regulatory regions enriched in KLF4 TF motifs linked to LIMD1 (Figures 3B and 3D) suggests KLF4 binding to open enhancers stimulating LIMD1 expression. KLF4, a transcriptional regulator of cell growth arrest and differentiation, is the most significantly altered gene (p < 0.00001) with the greatest fold change at birth in mice.90 Given the dramatic surge of Klf4 expression at birth, the relative hyperoxic postnatal environment may serve as a physiologic signal to induce Klf4 expression. Together, increased oxygen tension at birth may stimulate KLF4 expression and binding to LIMD1 enhancer regions, and mechanical stretch from air inflated breathing promotes LIMD1 downstream inactivation of the Hippo pathway and AT1 cell differentiation (Figure 7A).
Figure 7.

Proposed regulation of AT1 and myoFB cells during alveolar septation at D1
Schematic summary of regulatory mechanism hypotheses after birth of (A) AT1 differentiation and (B) AT1 and myoFB cell-cell communication inferred from analysis of scTHS-seq gene and TF activity, motif enrichment, and available sc/snRNA-seq datasets.
AT1 cells likely also play an important role in alveolar septation via interactions with mesenchymal cells. PDGFA-expressing AT2 cells are implicated in paracrine signaling to myoFBs to drive alveolar septation.9,10,91 However, our dataset analyzed in light of sc expression studies suggests a key signaling role for AT1 cells in directing alveolar septation, which aligns with a 3D imaging study showing AT1 cells folding where myoFBs reside in septal ridges.5 Epithelial-mesenchymal crosstalk via PDGFA and PDGFRA at D1 appears to involve AT1.AT2, AT1, and differentiating myoFBs extending our transcriptional regulatory hypothesis in Figure 7 to include KLF4 binding to accessible chromatin in AT1.AT2 and AT1 cells to activate PDGFA signaling. In Klf4 null lungs, connective tissue genes and actin protein expression is absent from septal tip myoFBs.90 In the mesenchyme, mechanical stretch from air inflation may signal NFATC4 binding to drive PDGFRA expression promoting myoFB differentiation. The coordination of mechano-response and epithelial signaling likely guide the correct positioning of myoFBs for septation.92 Applying scRNA-seq and in situ hybridization, a newly published study supports the spatial interaction of AT1 cells and myoFBs at P3 and P7; this AT1 signaling node is found to be conserved in human lung at 2 months.54 Zepp at al. also hypothesizes Klf and Tead TF involvement in AT1 cell development and mesenchymal signaling utilizing scATAC-seq at P3. The group describes PDGFRA+ transient secondary crest myofibroblasts (SCMF) as a functionally specialized, force exerting lineage present only during early postnatal alveolar septation which aligns with our results. SCMFs are likely similar to D1 myoFB_1 and may explain the higher proportion of myofibroblasts captured during human and murine alveologenesis. Our finding of discrete lung function regulatory risk units enriched in myoFBs (Figure 4) further stresses the importance of better delineating epithelial-mesenchymal interactions as aberrant myofibroblasts may contribute to abnormal alveolar septation and lung growth with subsequent reduction in lung function.
In addition to evidence of mechanotransduction signals related to alveoli generation, we found a subset of unique human mFBs containing PIEZO2 accessible regulatory regions that decreased with age. Piezo2 is characterized as a stretch sensor responsible for lung volume regulation and is necessary to start effective breathing in newborn mice, however no abnormalities are detected in prenatal lung development.72 In humans, loss-of-function variants resulted in transient respiratory insufficiency at birth.93,94 Distinct stretch-sensing responses between humans and mice may be attributed to differences in organ absolute size, the magnitude of stretch required for successful gas exchange, and birth and adaptation to air breathing at differing stages of lung development. Regulatory and expression variations along with a milder human phenotype with non-functional PIEZO2 indicate a species-specific difference and may have critical implications in human respiratory distress at birth, control of breathing, and developmental lung diseases.
Limitations of the study
We captured a substantial number of alveolar epithelial and mesenchymal cells, with a more limited population of immune cells. Lower numbers of immune cells may be due to tissue preservation strategies and technical differences between whole cell and nuclear protocols, the latter of which has been described previously with snDrop-seq95 and seen when comparing scTHS-seq to LGEA scRNA-seq from similar donor tissues (Figure S4C). Comparing the proportion of cell types captured from scTHS-seq, LGEA scRNA-seq, and Wang et al., 2020 snRNA-seq, even when utilizing tissue from the same repository, resulted in ratio differences which are not unexpected and likely multifactorial such as from donor tissue quality and clinical characteristics, dissociation protocol, and assay type. Generally, scTHS-seq and snRNA-seq produced more similar cell type proportions.
Our dataset sampled one lung for each time point, which limits our ability to generalize our findings regarding epigenetic variation between developmental stages, especially in humans. In addition to age, epigenetic differences between samples can be attributed to genetics, environmental exposures, donor characteristics, and location of tissue sampling in a large organ. To mitigate these concerns and because of the scarcity of healthy human pediatric tissues, we processed all scTHS-seq data in one experiment to reduce batch effects and substantiated our findings using available bulk RNA-seq, sc/snRNA-seq, CHIP-seq, and protein immunostaining, most of which utilize similarly aged human donors and mouse lungs from the same repository. Table S6 lists our key findings and supporting evidence. Previous published single-cell studies have identified meaningful biological insights with an n = 1,96,97 nonetheless, developmental changes and species variation presented must be interpreted with caution and require validation such as through characterizing genetic mouse models with lineage-specific reporters or human organoids from purified progenitor cell populations. Moving forward, it will be important to integrate additional regulatory data to complement single-cell transcriptome findings, especially in pediatric and developmental samples, to enhance growing human cell atlas efforts. Employing dual and multi-omic single-cell technologies with a spatial component will further provide a more complete description of cellular states.
STAR★Methods
Key resources table
| REAGENT or RESOURCE | SOURCE | IDENTIFIER |
|---|---|---|
| Antibodies | ||
| PIEZO2 Antibody (Rabbit polyclonal) | Invitrogen | Cat#PA5-56894; RRID: AB_2645539 |
| Alpha smooth muscle actin Antibody (Mouse/IgG2a, kappa) | Invitrogen | Cat#14-9760-82; RRID: AB_2572996 |
| Human LIMD1 Antibody (Mouse monoclonal IgG) | R&D Systems | Cat#MAB8494; Clone#919330; Accession#Q9UGP4 |
| Wang et al., 2020 snRNA-seq | Wang et al., 2020 | GEO: GSE161382 |
| Human molecular cell atlas | Travaglini et al., 2020 | EGA accession: EGAS00001004344 |
| Alexa Fluor Plus 555 (Donkey anti-Goat IgG (H+L) Highly Cross-Adsorbed Secondary Antibody) | Invitrogen | Cat#A32816; RRID: AB_2762839 |
| DyLight 755 (Donkey anti-Rabbit IgG (H+L) Cross-Adsorbed Secondary Antibody) | Invitrogen | Cat#SA5-10043; RRID: AB_2556623 |
| Alexa Fluor 647 (Donkey anti-Mouse IgG (H+L) Highly Cross-Adsorbed Secondary Antibody) | Invitrogen | Cat#A32787; RRID: AB_2762830 |
| Biological Samples | ||
| Frozen human lung biopsies and fresh frozen paraffin-embedded sections | Biorepository for Investigation of Neonatal Diseases of the Lung (BRINDL) | https://brindl.urmc.rochester.edu/ |
| Fresh frozen paraffin-embedded unused adult deceased donor lung tissue | University of California San Diego (UCSD) | N/A |
| Chemicals, Peptides, and Recombinant Proteins | ||
| 100x Citrate Buffer pH 6.0 | Abcam | Cat#ab64236 |
| VECTASHIELD Vibrance Antifade Mounting Medium with DAPI | Vector Laboratories | Cat#H-1800 |
| Deposited Data | ||
| Raw data | This paper | GEO: GSE154027 |
| Cellular census of human lungs | Vieira Braga et al., 2019 | GEO: GSE130148 |
| Cell atlas of mouse lung development | Cohen et al., 2018 | GEO: GSE119228 |
| scRNA-seq mouse lung at birth | Guo et al., 2019 | GEO: GSE122332 |
| LGEA scRNA-seq | Du et al., 2015; Du et al., 2017; Du et al., 2021 | www.lungmap.net |
| Experimental Models: Organisms/Strains | ||
| C57BL/6 mice frozen whole lungs | Perl Lab | N/A |
| Oligonucleotides | ||
| (See Lake et al., 2018 Table S12) | Lake et al., 2018 | N/A |
| Software and Algorithms | ||
| Code for processing scTHS-seq data | Lake et al., 2018 | https://github.com/yanwu2014/scTHS-Seq-processing |
| Code for analyzing lung scTHS-seq data | This paper | https://github.com/ThuElizabethD/Lung-scTHS-seq |
| bcl2fastq | Github | https://github.com/brwnj/bcl2fastq |
| deindexer | Github | https://github.com/ws6/deindexer |
| BWA | Github | https://github.com/lh3/bwa |
| pysam | Github | https://github.com/pysam-developers/pysam |
| SAMtools | Danecek et al., 2021 | https://www.htslib.org/ |
| SnapATAC | Fang, Priessl et al., 2021 | https://github.com/r3fang/SnapATAC |
| MACS | Github | https://github.com/macs3-project/MACS |
| cisTopic | Bravo González-Blas et al., 2019 | https://github.com/aertslab/cisTopic |
| Seurat | Stuart, Butler et al., 2019 | https://satijalab.org/seurat/ |
| Cicero | Pliner et al., 2018 | https://cole-trapnell-lab.github.io/cicero-release/ |
| deepTools | Ramirez et al., 2016 | https://github.com/deeptools/deepTools |
| ChromVAR | Schep et al., 2017 | https://greenleaflab.github.io/chromVAR/index.html |
| Signac | Stuart et al., 2021 | https://satijalab.org/signac/ |
| ChromVARmotifs | Github | https://github.com/GreenleafLab/chromVARmotifs |
| ChIPseeker | Guangchuang et al., 2015 | http://bioconductor.org/packages/release/bioc/html/ChIPseeker.html |
| GViz | Hahne and Ivanek, 2016 | https://bioconductor.org/packages/release/bioc/html/Gviz.html |
| TxDb.Hsapiens.UCSC.hg38.knownGene R package v3.4.6 | Bioconductor | https://doi.org/10.18129/B9.bioc.TxDb.Hsapiens.UCSC.hg38.knownGene |
| TxDb.Mmusculus.UCSC.mm10.knownGene R package v3.4.7 | Bioconductor | https://doi.org/10.18129/B9.bioc.TxDb.Mmusculus.UCSC.mm10.knownGene |
| org.Hs.eg.db R package v3.8.2 | Bioconductor | https://doi.org/10.18129/B9.bioc.org.Hs.eg.db |
| org.Mm.eg.db R package v3.8.2 | Bioconductor | https://doi.org/10.18129/B9.bioc.org.Mm.eg.db |
| g-chromVAR | Ulirsch et al., 2019 | https://github.com/caleblareau/gchromVAR |
| CausalDB fine-mapping pipeline | Github | https://github.com/mulinlab/CAUSALdb-finemapping-pip |
| R/Rstudio | R/Rstudio | https://rstudio.com/ |
| Other | ||
| GentleMACS Dissociator | Miltenyi Biotec | Cat#130-093-235 |
| GentleMACS C Tubes | Miltenyi Biotec | Cat#130-093-237 |
| Sterile single-pack CellTrics filters - 30 um | CellTrics | Cat#04-004-2326 |
| S2002 Dako Pen | Agilent Technologies | Cat#S200232-3 |
| scTHS-seq Assay | Lake et al., 2018 | https://doi.org/10.17504/protocols.io.xf8fjrw |
| TC20 Automated Cell Counter | Bio-Rad | Cat#1450102 |
| HiScribe T7 High Yield RNA Synthesis Kit | New England BioLabs | Cat#E2040S |
| Taq 5X Master Mix | New England BioLabs | Cat# M0285L |
| Taq DNA Polymerase with Standard Taq Buffer | New England BioLabs | Cat#M0273E |
| AMPure XP | Beckman | Cat#A63882 |
| Clontech SMART MMLV reverse transcriptase kit | Takara | Cat#639523 |
| RNase H | Enzymatics | Cat#Y9220L |
Resource availability
Lead contact
Further information and requests for resources and reagents should be directed to and will be fulfilled by the lead contact, Kun Zhang (kzhang@bioeng.ucsd.edu).
Materials availability
This study did not generate new unique reagents.
Experimental model and subject details
Human subjects
All post-mortem human pediatric donor lung samples were obtained from the Biorepository for Investigation of Neonatal Diseases of the Lung (BRINDL) supported by the NHLBI LungMAP Human Tissue Core housed at the University of Rochester. Consent, tissue acquisition, and storage protocols can be found on the repository’s website (brindl.urmc.rochester.edu/). Frozen human lung tissue biopsies weighing approximately 100 mg were shipped in cryovials overnight from BRINDL on dry ice and processed upon arrival simultaneously with whole mouse lungs. Normal adult human lung from unused deceased donor tissue consented for research use was obtained from LifeSharing, San Diego, CA and processed for histology by formalin fixation and paraffin embedding. Sample size and donor metadata are listed in Table S1.
Animals
Archived healthy C57BL/6 fresh-frozen whole mouse lungs used in this study were shipped from the University of Cincinnati on dry ice and immediately stored at −80C. All mice were not involved in previous procedures. Sample size, sex and developmental stage are provided in Table S1.
Method details
Nuclei isolation
Human and mouse lung samples were thawed in 1-1.5 mL 10% dimethyl sulfoxide (DMSO; Fisher Scientific) in fetal bovine serum (FBS; GIBCO) on ice for 5-10 min. Contents were transferred into GentleMACS C tubes and 4 mL ice-cold nuclei extraction buffer was added (0.32M sucrose, 5 mM CaCl, 3mM MgAc2, 0.1 mM EDTA, 10 mM Tris-HCl, 0.1% Triton X-100). GentleMACS dissociator preset programs A through E was used, placing tubes on ice in between programs. Samples and 1 mL of NEB buffer used to rinse C tubes were passed through 30-um filters into 15 mL tubes. Total volume was brought up to 10 mL with PBS (GIBCO) + 2 mM EGTA (PBSE, pH ∼7.4), centrifuged for 10 min x 900 g at 4C, and pellets resuspended in 1 mL PBSE + 2% fatty-acid-free BSA (Gemini) containing 4’,6-diamidino-2-phenylindole (DAPI).
scTHS-seq library generation
Subsequent DAPI+ flow cytometry sorting, nuclei processing, scTHS-seq library generation, and sequencing was completed as described previously.14 Briefly, after flow cytometry, nuclei were prepared for counting and species-species mixing by centrifuging at 500 g for 5 min at 4°C and pellet resuspension in 1x lysis buffer, followed by 1.5x tagmentation buffer. Human and mouse nuclei were counted on a Bio-Rad TC20 cell counter. Optimal cell concentrations were obtained for each sample (2- 5 × 10⁵ nuclei/mL, target ?1 million total nuclei for each sample). Equal volumes of human and mouse samples were combined for transposition and combinatorial indexing. Generation of barcoded transposome complex was done using annealed transposons and Tn5059.14,98 For nuclei tagmentation and barcoding, human-mouse mixed cell samples were added to the 384-well plate of freshly generated uniquely barcoded Tn5059 r5 transposome complexes. EDTA 50 mM was added to each well to stop the reaction. Next, tagmented nuclei were pooled and prepared for flow cytometry sorting into 96-well plates (100 nuclei per well). Propidium iodide (eBioscience) staining was used to select nuclei and doublets were removed using forward and side scatterplots. For library preparation, 96-well plates were processed individually. Guanidine hydrochloride was added to each well. Reactions were purified using 1.8x AMPure SPRI beads, bead-pelleting, and 80% ethanol washes. For end fill-in, NEB Taq polymerase 1x was added. NEB HiScribe T7 high-yield synthesis kits were used for in vitro transcription amplification. Reactions were purified using 2x SPRI binding buffer, 80% ethanol washes, and SPRI beads resuspended in nuclease-free water. Clontech SMART MMLV reverse transcriptase kits were used for reverse transcription. To degrade RNA in cDNA-RNA hybrids, we added Enzymatics RNase H. For second-strand synthesis, we used 20 μM sss_scnXTv2 followed by NEB taq5X. Reactions were purified again using 2x SPRI binding buffer, 80% ethanol washes, and SPRI beads resuspended in nuclease-free water. Then, double-stranded cDNA fragments were simultaneously fragmented and 3′ adaptors added with a custom nXTv2_i7 Tn5059 transposome. Reactions were purified and resuspended in nuclease-free water. Finally, samples were eluted off SPRI beads using a magnetic plate and qPCR was performed using standard Illumina Nextera XT v2 barcoding in an 8x12 (i5xi7) format using custom scTHS-seq i5 indexes and standard Illumina i7 indexes. Validated size-selected libraries were sequenced on high-throughput Illumina HiSeq 2500 (50+8+32 single-end reads).
Immunofluorescent staining and imaging
10 μM thick sections were cut from flash frozen paraffin embedded BRINDL and UCSD blocks and deparaffinized/rehydrated in xylene 3 × 15 min, 2 × 100%, 2 × 95%, 1 × 80% alcohol. A container containing 1x citrate buffer was placed in a glass dish filled XXX with diH20 and prewarmed in a microwave for 5 min, 100% power. Slides underwent antigen retrieval for 1 × 20 min, 50% power, 1 × 10 min, 50% power, making sure that the slides were submerged in citrate buffer at the end of the 1st 20 min. Keeping the slides in citrate buffer, they were cooled in 4°C for 45 – 60 min and then washed with running diH20. Tissue sections were encircled with PAP pen, followed by 10 min 03.% tween/PBS for permeabilization. Slides were then washed for 5 min with PBS and placed in a humidity chamber to be blocked with 5% bovine serum albumin (BSA). Without washing, BSA was tapped off each slide and primary antibody, made in PBS, pipetted onto each slide (see chart for antibody dilutions). Slides, placed in a humidity chamber, were incubated at 4°C overnight. The next day, slides were washed with PBS using a squirt bottle then left for 5 min in PBS. Secondary was pipetted directly onto the slides and incubated for 1 h at room temperature. Slides were washed with PBS using a squirt bottle plus a 5-min PBS wash and coverslipped with Vectashield + DAPI. Slides were visualized using a Leica Stellaris 5.
| Antigen or Fluorophore | Dilution |
|---|---|
| PIEZO2 | 1/100 |
| ACTA2 | 1/50 |
| LIMD1 | 1/100 |
| RAGE | 1/200 |
| SPC | 1/100 |
| Alexa-555 | 1/200 (RAGE) |
| Dylight-750 | 1/100 (PIEZO2, SPC) |
| Alexa-647 | 1/200 (LIMD1), 1/300 (ACTA2) |
Quantification and statistical analysis
scTHS-seq data processing
Alignment and Sorting - BAM files for uniquely barcoded nuclei were generated from raw BCL files as previously described14 including a tutorial (https://github.com/yanwu2014/scTHS-Seq-processing). Briefly, using bcl2fastq (v2.17.1.14), we produced Fastq files for Read1, Index1, and Index2 and identified reads that map to each unique barcode combination using deindexer with a zero mismatch stringency resulting in a single fastq file per cell barcode combination. After deindexing, cell barcode combinations for each read were appended to the read name, and all fastq files re-merged for alignment. Merged fastq files were aligned to hg38 (GCA_000001405.15_GRCh38_no_alt_plus_hs38d1_analysis_set) and mm10 (GCA_000001635.5_ GRCm38.p3_no_alt_analysis_set) reference genomes using BWA (0.7.12-r1039). Individual bam files were generated with assigned barcode, plate id, and sample id using pysam. Using samtools99, bam files were merged and sorted into a single file for each species.
Quality filtering and peak calling
SnapATAC (v2)100 snaptools snap-pre command (with –keep-single = TRUE) and snap-add-bmat (5 kb bin size) were ran to create a bins by cells matrix and high-quality cell barcodes were selected based on a total number of fragments per barcode (‘fragment.num’) greater than 1500 and a uniquely mapped ratio (‘umap ratio’) greater than 0.6. Next, the matrix was binarized and additional filtering removed any bins overlapping with ENCODE hg38 and mm10 blacklists (http://mitra.stanford.edu/kundaje/akundaje/release/blacklists/) and the top 5% of bins with highest coverage.
Dimensionality reduction with PCA and construction of a KNN graph using the top 16 PCs (k = 20) was completed. R igraph clustering on the bins by cells matrix produced raw clusters and peak calling using combined reads from each cluster was run using MACS2 (v2.1.1.20160309) with the command “–nomodel–shift 37–ext 73–qvalue 5e-2 -B–SPMR–call-summits.” Peaks from all clusters were merged to generate a consensus list of peaks, and a binary chromosomal peak locations by cell barcodes matrix was generated using ‘createPmat’ function.100 Peak locations were filtered to keep only chromosomes 1-22, X for human and 1-19, X for mouse, and only peaks belonging to a minimum of 25 cells and cells with at least 200 accessible sites were kept.
Dimensionality reduction and clustering
Using cisTopic,101 Latent Dirichlet Allocation (LDA) was completed on the peaks by cells matrix with the optimal number of topics selected by cisTopic’s model selection functionality (human topics = 45, mouse topics = 40). LDA topics were utilized to generate UMAP coordinates for 2D visualization and both LDA topics and UMAP coordinates were embedded into Seurat (v3) for clustering using ‘FindNeighbors’ with k = 30 and FindClusters with resolution = 0.8.28
Gene activities and cell-type annotation
A gene activity matrix was created using Cicero with default parameters except for a co-accessibility cutoff of 0.1.16 Peaks were annotated by assigning them to genes whose promoters were closer than 5kb upstream or downstream. Co-accessibility (the proportion of cells in which both peaks were simultaneously accessible) was calculated between these annotated peaks and peaks further than 5kb away from promoters (distal peaks). Each distal peak was assigned to the gene of the annotated peak to which it was most co-accessible.
To annotate clusters present in the entire human and mouse dataset, we systematically classified cell types first based on lung compartment (epithelial, mesenchymal, endothelial and immune) followed by more specific cell types based on gene activity and peaks in promoter regions using canonical marker genes. To visualize peaks, bam files containing cell barcodes from clusters were merged and sorted using SAMtools (v1.3.1), and converted to bigwig files using ‘bamCoverage’ from the deepTools (v2.1.0).102 Bigwigs were uploaded to UCSC Genome Browser (http://genome.ucsc.edu/).103 To confirm assignment of cell type labels, average gene activities of each cluster were correlated with published lung reference sc/snRNA-seq datasets17, 18, 19, 20, 21, 22, 23, 24 from corresponding species. An iterative clustering strategy was used to further classify subpopulations by subsetting target cells or clusters, re-selecting topics for UMAP visualization, and clustering as described above.
Differential accessible peak and gene analysis
Differentially accessible peaks were identified for each cell type and sample using a modified Fisher’s exact test as previously described.14 To get a sense of the effect size of each differentially accessible peak, log-fold change was computed for each peak in each group, defined here as the log2 transform of the fraction of cells in a cluster that are accessible at that peak divided by the fraction of all other cells that are accessible at that peak. A specificity score was also computed as previously described to assess how specific the accessibility of a peak is to a cluster.104 We defined a peak as differentially accessible for a cell type or sample if it had an adjusted p value of less than 0.05, a log fold-change of greater than 0.5, and a specificity score of greater than 0.0001. Using default parameters, top differential peaks for each cluster were analyzed using GREAT to link genomic regions to genes and associate significant biological processes.43 Differential genes for each cluster were identified using the Cicero gene activity matrix and Seurat’s “FindAllMarkers” which utilizes a logistic regression and likelihood-ratio test to identify differential genes.28
Transcription factor analysis
Differential TF activity between clusters and motif enrichment in differential peaks linked to cell-type marker genes were accomplished using ChromVAR,27 Signac,105 and Seurat function.28 First, a filtered collection of human and mouse position weight matrices (“human_pwms_v2” and “mouse_pwms_v2”) from ChromVARmotifs was utilized to look for the presence of motifs in each peak to construct a motif occurrence matrix. Then, ChromVar was used to compute a deviations matrix (motif accessibility for each TF for each cell). Next, Seurat was utilized to identify differential TF activities for each cluster.
To perform motif enrichment in a set of differentially accessible peaks linked to marker genes, top differential peaks for each cluster (qval < 0.01, logfc > 0.5) were identified and linked to promoter regions of genes using ‘annotatePeak’ (+/− 5kb from TSS) from ChIPseeker (v1.20.0).106 Annotated peaks were then filtered by mapped genes. Only peaks which were mapped to a top differential gene for annotated clusters (adjusted p.value < 0.05, ave_logFC > 0.1) were kept. Motif enrichment was performed on peaks of marker genes with more than one associated differential peak using Signac ‘FindMotifs’.
Connectivity spider plots and bigwig track visualizations
The connectivity spider plots consisted of three major tracks: peak connection, bigwig for each cell type, and gene annotation. Tracks were processed individually and added to a plot list for final plotting. Peak connection tracks only contained peaks related to gene-of-interest. To filter for target peaks, the top 20,000 differential peaks per cell type cluster were first identified (q-value cutoff = 0.01, specificity cutoff = 1e-4, log fold-change cutoff = 0.5). Then, a peaks-by-genes co-accessibility matrix was generated using all accessible peaks linked to promoter regions of genes and a co-accessibility score above 0.1 or 0.25. The peaks by genes co-accessibility matrix was then subsetted to a vector of one gene by non-zero value peaks. The Cicero peaks by peaks conns object was also subsetted to contain the same peaks. Peak connections were plotted using Cicero plotConnections.16 Using GViz (v3.11),107 cluster-specific bigwigs were visualized using DataTrack and gene annotation tracks were built using GeneRegionTrack with the corresponding genomes (TxDb.Hsapiens.UCSC.hg38.knownGene R package v3.4.6 and TxDb.Mmusculus.UCSC.mm10.knownGene R package v3.4.7). Gene annotations were converted to gene symbols using ENTREZID (org.Hs.eg.db and org.Mm.eg.db R packages v3.8.2). For final visualization, GViz ‘plotTracks’ function was utilized.
GWAS analysis
We used g-chromVAR108 to identify cell types that are enriched in certain lung diseases or phenotypes. Briefly, g-chromVAR requires a bulk or single-cell chromatin accessibility matrix and fine-mapped GWAS summary statistics, which describe the probability that a SNP is the causal SNP for a given phenotype. We used pre-computed fine-mapping results computed using CaviarBF from CausalDB (http://mulinlab.tmu.edu.cn/causaldb/index.html) for most phenotypes. For the remaining phenotypes, we ran the CausalDB fine-mapping pipeline with default parameters on the UK Biobank Results published by the Neale group (http://www.nealelab.is/uk-biobank/) for Idiopathic Pulmonary Fibrosis (IPF) and a 2017 meta-analysis of lung function for FEV1, FVC, and FEV1/FVC (UK Biobank, 2018).56 To run g-chromVAR, we first binarized the single-cell accessibility matrix and then summed the accessibilities of all cells belonging to a given cell type to create a pseudobulk accessibility matrix with one column per cell type. We then ran g-chromVAR with default parameters. Because the results of g-chromVAR can vary depending on the choice of background peaks, we ran g-chromVAR 100 times and used the average of those 100 runs as our final result.
LGEA scRNA-seq analysis
Raw expression matrices were downloaded from www.lungmap.net. Human 1 day old neonate (LungMAP ID LMEX0000001624) was analyzed alone using Seurat’s v4.0.1 standard workflow108 and integrated with 3 additional donors (LMEX0000001625, LMEX0000001626, and LMEX0000003690) as described by Stuart, Butler et al., 2019.28 QC parameters included nFeature_RNA > 200 and < 2500. For UMAP visualization and clustering, we chose dims = 1:20, npcs = 30, and resolution = 1 and 1.5. Top marker genes were generated for both resolutions using p_val_adj < 0.04, pct.2 < 0.1, pct.1 > 0.3, ave_log2FC > 1. Cell types were annotated by aligning signature expression gene lists available on the LGEA web portal (https://research.cchmc.org/pbge/lunggens/mainportal.html).
scTHS-seq pseudobulk and bulk LGEA RNA-seq comparison
Gene activity levels for each major cell type in Figure S1 were summed and divided by cell count proportion to create scTHS-seq pseudobulk levels. Human and mouse sorted epithelial, mesenchymal, endothelial, and immune bulk RNA-seq counts per million taken from the LGEA web portal (https://research.cchmc.org/pbge/lunggens/mainportal.html) for each gene were added across age groups (human - neonate, infant and child; mouse – PND1, PND7, PND14, PND28). See Table S7.
Comparison of scTHS-seq with published data
We obtained gene count matrices from GEO and www.lungmap.net. Reference datasets were normalized and variable genes identified using default settings for Seurat NormalizeData and FindVariableFeatures functions. We used the union of all marker genes for scTHS-seq and reference dataset to compute the Pearson correlation between the average scTHS-seq gene activity and average gene expression of cell types in each dataset. Dot plots using LGEA scRNA-seq13,23,24 and Wang et al., 202021 snRNA-seq were generated using the Seurat DotPlot function.
Acknowledgments
We thank G. Pryhuber and her lab members along with the NHLBI LungMAP HTC for providing donor lung tissue and discussions on tissue processing. We thank A. Perl, J. Kitzmiller, T. Nicola, and N. Ambalavanan for help with providing mouse lung tissue. We thank the LungMAP consortium for their collaboration and resources. We thank Jeffrey Whitsett for providing images in Figure 4A. We thank T.F. Osothprarop and M.M. He (Illumina, San Diego, California, USA) for providing Tn5059 transposase. We thank B. Lake and members of the Hagood and Zhang lab for valuable discussions. The authors wish to thank Dr. Michael Chua of the Michael Hooker Microscopy Core Facility in the UNC Marsico Lung Institute for assistance with setup and use of the confocal microscope. T.E.D. is supported by funding from the Chan Zuckerberg Initiative’s Seed Networks for the Human Cell Atlas. T.E.D. was a Fellow in the Pediatric Scientist Development Program and supported by Award Number K12-HD000850 from the Eunice Kennedy Shriver National Institute of Child Health and Human Development. J.S.H. is supported by 5U01HL122626-05. K.Z. is supported by 1U54HL145608-01.
Author contributions
Conceptualization, T.E.D., J.S.H., and K.Z.; Methodology, T.E.D., B.S., and K.Z.; Software, T.E.D., W.D., S.L., and Y.W.; Formal Analysis, T.E.D., W.D., S.L., and Y.W.; Investigation, T.E.D., B.S., L.R., and G.M.; Resources, T.E.D., J.S.H., and K.Z.; Data Curation, T.E.D., and Y.W.; Writing - Original Draft, T.E.D.; Writing - Review & Editing, J.S.H. and K.Z.; Visualization, T.E.D., W.D., S.L., and Y.W.; Supervision, J.S.H. and K.Z.; Funding Acquisition, T.E.D., J.S.H., and K.Z.
Declaration of interests
Yan Wu is a former employee of Cellarity, Inc. and current employee and shareholder of Altos Labs. Greg Myers is an employee of Thermo Fisher Scientific.
Published: March 9, 2022
Footnotes
Supplemental information can be found online at https://doi.org/10.1016/j.xgen.2022.100108.
Supplemental information
(A) Cell type counts. (B) Top differentially active genes for all human clusters. (C) Top ChromVAR TF activities for all human clusters. (D) Top differentially active genes for all mouse clusters. (E) Top ChromVAR TF activities for all mouse clusters.
(A) Top differentially active genes for D1 clusters. (B) Top ChromVAR TF activities for D1 clusters. (C) Motif enrichment of regulatory regions linked to marker genes for D1 clusters. (D) Top differentially active genes for P1 clusters. (E) Top ChromVAR TF activities for P1 clusters. (F) Motif enrichment of regulatory regions linked to marker genes for P1 clusters.
Data and code availability
-
•
Single-cell THS-seq data have been deposited at GEO and are publicly available. Accession numbers are listed in the key resources table. Microscopy data reported in this paper will be shared by the lead contact upon request.
-
•
All code for analysis is publicly available as of the date of publication at this github repository: github.com/ThuElizabethD/Lung-scTHS-seq.
-
•
Any additional information required to reanalyze the data reported in this paper is available from the lead contact upon request.
References
- 1.Nikolić M.Z., Sun D., Rawlins E.L. Human lung development: recent progress and new challenges. Development. 2018;145:dev163485. doi: 10.1242/dev.163485. [DOI] [PMC free article] [PubMed] [Google Scholar]
- 2.Branchfield K., Li R., Lungova V., Verheyden J.M., McCulley D., Sun X. A three-dimensional study of alveologenesis in mouse lung. Dev. Biol. 2016;409:429–441. doi: 10.1016/j.ydbio.2015.11.017. [DOI] [PMC free article] [PubMed] [Google Scholar]
- 3.Ochs M., Nyengaard J.R., Jung A., Knudsen L., Voigt M., Wahlers T., Richter J., Gundersen H.J.G. The number of alveoli in the human lung. Am. J. Respir. Crit. Care Med. 2004;169:120–124. doi: 10.1164/rccm.200308-1107OC. [DOI] [PubMed] [Google Scholar]
- 4.Haies D.M., Gil J., Weibel E.R. Morphometric study of rat lung cells. I. Numerical and dimensional characteristics of parenchymal cell population. Am. Rev. Respir. Dis. 1981;123:533–541. doi: 10.1164/arrd.1981.123.5.533. [DOI] [PubMed] [Google Scholar]
- 5.Yang J., Hernandez B.J., Alanis D.M., Narvaez O., Vila-Ellis L., Akiyama H., Evans S.E., Ostrin E.J., Chen J. Development and plasticity of alveolar type 1 cells. Development. 2015;143:54–65. doi: 10.1242/dev.130005. [DOI] [PMC free article] [PubMed] [Google Scholar]
- 6.Boström H., Willetts K., Pekny M., Levéen P., Lindahl P., Hedstrand H., Pekna M., Hellström M., Gebre-Medhin S., Schalling M., et al. PDGF-A signaling is a critical event in lung alveolar myofibroblast development and alveogenesis. Cell. 1996;85:863–873. doi: 10.1016/s0092-8674(00)81270-2. [DOI] [PubMed] [Google Scholar]
- 7.Li R., Li X., Hagood J., Zhu M.-S., Sun X. Myofibroblast contraction is essential for generating and regenerating the gas-exchange surface. J. Clin. Invest. 2020;130:2859–2871. doi: 10.1172/JCI132189. [DOI] [PMC free article] [PubMed] [Google Scholar]
- 8.Boström H., Gritli-Linde A., Betsholtz C. PDGF-A/PDGF alpha-receptor signaling is required for lung growth and the formation of alveoli but not for early lung branching morphogenesis. Dev. Dyn. 2002;223:155–162. doi: 10.1002/dvdy.1225. [DOI] [PubMed] [Google Scholar]
- 9.Gouveia L., Betsholtz C., Andrae J. Expression analysis of platelet-derived growth factor receptor alpha and its ligands in the developing mouse lung. Physiol. Rep. 2017;5:e13092. doi: 10.14814/phy2.13092. [DOI] [PMC free article] [PubMed] [Google Scholar]
- 10.Gouveia L., Betsholtz C., Andrae J. PDGF-A signaling is required for secondary alveolar septation and controls epithelial proliferation in the developing lung. Development. 2018;145:dev161976. doi: 10.1242/dev.161976. [DOI] [PubMed] [Google Scholar]
- 11.Li J., Wang Z., Chu Q., Jiang K., Li J., Tang N. The Strength of Mechanical Forces Determines the Differentiation of Alveolar Epithelial Cells. Dev. Cell. 2018;44:297–312.e5. doi: 10.1016/j.devcel.2018.01.008. [DOI] [PubMed] [Google Scholar]
- 12.Schiller H.B., Montoro D.T., Simon L.M., Rawlins E.L., Meyer K.B., Strunz M., Vieira Braga F.A., Timens W., Koppelman G.H., Budinger G.R.S., et al. The human lung cell atlas: A high-resolution reference map of the human lung in health and disease. Am. J. Respir. Cell Mol. Biol. 2019;61:31–41. doi: 10.1165/rcmb.2018-0416TR. [DOI] [PMC free article] [PubMed] [Google Scholar]
- 13.Ardini-Poleske M.E., Clark R.F., Ansong C., Carson J.P., Corley R.A., Deutsch G.H., Hagood J.S., Kaminski N., Mariani T.J., Potter S.S., et al. LungMAP Consortium LungMAP: The molecular atlas of lung development program. Am. J. Physiol. Lung Cell. Mol. Physiol. 2017;313:L733–L740. doi: 10.1152/ajplung.00139.2017. [DOI] [PMC free article] [PubMed] [Google Scholar]
- 14.Lake B.B., Chen S., Sos B.C., Fan J., Kaeser G.E., Yung Y.C., Duong T.E., Gao D., Chun J., Kharchenko P.V., Zhang K. Integrative single-cell analysis of transcriptional and epigenetic states in the human adult brain. Nat. Biotechnol. 2018;36:70–80. doi: 10.1038/nbt.4038. [DOI] [PMC free article] [PubMed] [Google Scholar]
- 15.Dutta S., Sengupta P. Men and mice: Relating their ages. Life Sci. 2016;152:244–248. doi: 10.1016/j.lfs.2015.10.025. [DOI] [PubMed] [Google Scholar]
- 16.Pliner H.A., Packer J.S., McFaline-Figueroa J.L., Cusanovich D.A., Daza R.M., Aghamirzaie D., Srivatsan S., Qiu X., Jackson D., Minkina A., et al. Cicero Predicts cis-Regulatory DNA Interactions from Single-Cell Chromatin Accessibility Data. Mol. Cell. 2018;71:858–871.e8. doi: 10.1016/j.molcel.2018.06.044. [DOI] [PMC free article] [PubMed] [Google Scholar]
- 17.Vieira Braga F.A., Kar G., Berg M., Carpaij O.A., Polanski K., Simon L.M., Brouwer S., Gomes T., Hesse L., Jiang J., et al. A cellular census of human lungs identifies novel cell states in health and in asthma. Nat. Med. 2019;25:1153–1163. doi: 10.1038/s41591-019-0468-5. [DOI] [PubMed] [Google Scholar]
- 18.Travaglini K.J., Nabhan A.N., Penland L., Sinha R., Gillich A., Sit R.V., Chang S., Conley S.D., Mori Y., Seita J., et al. A molecular cell atlas of the human lung from single-cell RNA sequencing. Nature. 2020;587:619–625. doi: 10.1038/s41586-020-2922-4. [DOI] [PMC free article] [PubMed] [Google Scholar]
- 19.Cohen M., Giladi A., Gorki A.D., Solodkin D.G., Zada M., Hladik A., Miklosi A., Salame T.M., Halpern K.B., David E., et al. Lung Single-Cell Signaling Interaction Map Reveals Basophil Role in Macrophage Imprinting. Cell. 2018;175:1031–1044.e18. doi: 10.1016/j.cell.2018.09.009. [DOI] [PubMed] [Google Scholar]
- 20.Guo M., Du Y., Gokey J.J., Ray S., Bell S.M., Adam M., Sudha P., Perl A.K., Deshmukh H., Potter S.S., et al. Single cell RNA analysis identifies cellular heterogeneity and adaptive responses of the lung at birth. Nat. Commun. 2019;10:37. doi: 10.1038/s41467-018-07770-1. [DOI] [PMC free article] [PubMed] [Google Scholar]
- 21.Wang A., Chiou J., Poirion O.B., Buchanan J., Valdez M.J., Verheyden J.M., Hou X., Kudtarkar P., Narendra S., Newsome J.M., et al. NHLBI LungMap Consortium Single-cell multiomic profiling of human lungs reveals cell-type-specific and age-dynamic control of SARS-CoV2 host genes. eLife. 2020;9:1–28. doi: 10.7554/eLife.62522. [DOI] [PMC free article] [PubMed] [Google Scholar]
- 22.Du Y., Kitzmiller J.A., Sridharan A., Perl A.K., Bridges J.P., Misra R.S., Pryhuber G.S., Mariani T.J., Bhattacharya S., Guo M., et al. Lung Gene Expression Analysis (LGEA): an integrative web portal for comprehensive gene expression data analysis in lung development. Thorax. 2017;72:481–484. doi: 10.1136/thoraxjnl-2016-209598. [DOI] [PMC free article] [PubMed] [Google Scholar]
- 23.Du Y., Guo M., Whitsett J.A., Xu Y. ‘LungGENS’: a web-based tool for mapping single-cell gene expression in the developing lung. Thorax. 2015;70:1092–1094. doi: 10.1136/thoraxjnl-2015-207035. [DOI] [PMC free article] [PubMed] [Google Scholar]
- 24.Du Y., Ouyang W., Kitzmiller J.A., Guo M., Zhao S., Whitsett J.A., Xu Y. Lung gene expression analysis web portal version 3: Lung-at-a-glance. Am. J. Respir. Cell Mol. Biol. 2021;64:146–149. doi: 10.1165/rcmb.2020-0308LE. [DOI] [PMC free article] [PubMed] [Google Scholar]
- 25.Liu X., Rowan S.C., Liang J., Yao C., Huang G., Deng N., Xie T., Wu D., Wang Y., Burman A., et al. Categorization of lung mesenchymal cells in development and fibrosis. iScience. 2021;24:102551. doi: 10.1016/j.isci.2021.102551. [DOI] [PMC free article] [PubMed] [Google Scholar]
- 26.Xie T., Wang Y., Deng N., Huang G., Taghavifar F., Geng Y., Liu N., Kulur V., Yao C., Chen P., et al. Single-Cell Deconvolution of Fibroblast Heterogeneity in Mouse Pulmonary Fibrosis. Cell Rep. 2018;22:3625–3640. doi: 10.1016/j.celrep.2018.03.010. [DOI] [PMC free article] [PubMed] [Google Scholar]
- 27.Schep A.N., Wu B., Buenrostro J.D., Greenleaf W.J. chromVAR: inferring transcription-factor-associated accessibility from single-cell epigenomic data. Nat. Methods. 2017;14:975–978. doi: 10.1038/nmeth.4401. [DOI] [PMC free article] [PubMed] [Google Scholar]
- 28.Stuart T., Butler A., Hoffman P., Hafemeister C., Papalexi E., Mauck W.M., 3rd, Hao Y., Stoeckius M., Smibert P., Satija R. Comprehensive Integration of Single-Cell Data. Cell. 2019;177:1888–1902.e21. doi: 10.1016/j.cell.2019.05.031. [DOI] [PMC free article] [PubMed] [Google Scholar]
- 29.Didon L., Zwick R.K., Chao I.W., Walters M.S., Wang R., Hackett N.R., Crystal R.G. RFX3 modulation of FOXJ1 regulation of cilia genes in the human airway epithelium. Respir. Res. 2013;14:70. doi: 10.1186/1465-9921-14-70. [DOI] [PMC free article] [PubMed] [Google Scholar]
- 30.Quigley I.K., Kintner C. Rfx2 Stabilizes Foxj1 Binding at Chromatin Loops to Enable Multiciliated Cell Gene Expression. PLoS Genet. 2017;13:e1006538. doi: 10.1371/journal.pgen.1006538. [DOI] [PMC free article] [PubMed] [Google Scholar]
- 31.Little D.R., Gerner-Mauro K.N., Flodby P., Crandall E.D., Borok Z., Akiyama H., Kimura S., Ostrin E.J., Chen J. Transcriptional control of lung alveolar type 1 cell development and maintenance by NK homeobox 2-1. Proc. Natl. Acad. Sci. USA. 2019;116:20545–20555. doi: 10.1073/pnas.1906663116. [DOI] [PMC free article] [PubMed] [Google Scholar]
- 32.DeFelice M., Silberschmidt D., DiLauro R., Xu Y., Wert S.E., Weaver T.E., Bachurski C.J., Clark J.C., Whitsett J.A. TTF-1 phosphorylation is required for peripheral lung morphogenesis, perinatal survival, and tissue-specific gene expression. J. Biol. Chem. 2003;278:35574–35583. doi: 10.1074/jbc.M304885200. [DOI] [PubMed] [Google Scholar]
- 33.Sandbo N., Kregel S., Taurin S., Bhorade S., Dulin N.O. Critical role of serum response factor in pulmonary myofibroblast differentiation induced by TGF-β. Am. J. Respir. Cell Mol. Biol. 2009;41:332–338. doi: 10.1165/rcmb.2008-0288OC. [DOI] [PMC free article] [PubMed] [Google Scholar]
- 34.Casie Chetty S., Rost M.S., Enriquez J.R., Schumacher J.A., Baltrunaite K., Rossi A., Stainier D.Y.R., Sumanas S. Vegf signaling promotes vascular endothelial differentiation by modulating etv2 expression. Dev. Biol. 2017;424:147–161. doi: 10.1016/j.ydbio.2017.03.005. [DOI] [PMC free article] [PubMed] [Google Scholar]
- 35.Pang S.H.M., de Graaf C.A., Hilton D.J., Huntington N.D., Carotta S., Wu L., Nutt S.L. PU.1 is required for the developmental progression of multipotent progenitors to common lymphoid progenitors. Front. Immunol. 2018;9:1264. doi: 10.3389/fimmu.2018.01264. [DOI] [PMC free article] [PubMed] [Google Scholar]
- 36.Zhang Y., Goss A.M., Cohen E.D., Kadzik R., Lepore J.J., Muthukumaraswamy K., Yang J., DeMayo F.J., Whitsett J.A., Parmacek M.S., Morrisey E.E. A Gata6-Wnt pathway required for epithelial stem cell development and airway regeneration. Nat. Genet. 2008;40:862–870. doi: 10.1038/ng.157. [DOI] [PMC free article] [PubMed] [Google Scholar]
- 37.Li C., Bellusci S., Borok Z., Minoo P. Non-canonical WNT signalling in the lung. J. Biochem. 2015;158:355–365. doi: 10.1093/jb/mvv081. [DOI] [PMC free article] [PubMed] [Google Scholar]
- 38.Treutlein B., Brownfield D.G., Wu A.R., Neff N.F., Mantalas G.L., Espinoza F.H., Desai T.J., Krasnow M.A., Quake S.R. Reconstructing lineage hierarchies of the distal lung epithelium using single-cell RNA-seq. Nature. 2014;509:371–375. doi: 10.1038/nature13173. [DOI] [PMC free article] [PubMed] [Google Scholar]
- 39.Frank D.B., Peng T., Zepp J.A., Snitow M., Vincent T.L., Penkala I.J., Cui Z., Herriges M.J., Morley M.P., Zhou S., et al. Emergence of a Wave of Wnt Signaling that Regulates Lung Alveologenesis by Controlling Epithelial Self-Renewal and Differentiation. Cell Rep. 2016;17:2312–2325. doi: 10.1016/j.celrep.2016.11.001. [DOI] [PMC free article] [PubMed] [Google Scholar]
- 40.Nabhan A.N., Brownfield D.G., Harbury P.B., Krasnow M.A., Desai T.J. Single-cell Wnt signaling niches maintain stemness of alveolar type 2 cells. Science. 2018;359:1118–1123. doi: 10.1126/science.aam6603. [DOI] [PMC free article] [PubMed] [Google Scholar]
- 41.Desai T.J., Brownfield D.G., Krasnow M.A. Alveolar progenitor and stem cells in lung development, renewal and cancer. Nature. 2014;507:190–194. doi: 10.1038/nature12930. [DOI] [PMC free article] [PubMed] [Google Scholar]
- 42.Ibar C., Kirichenko E., Keepers B., Enners E., Fleisch K., Irvine K.D. Tension-dependent regulation of mammalian Hippo signaling through LIMD1. J. Cell Sci. 2018;131:jcs214700. doi: 10.1242/jcs.214700. [DOI] [PMC free article] [PubMed] [Google Scholar]
- 43.McLean C.Y., Bristor D., Hiller M., Clarke S.L., Schaar B.T., Lowe C.B., Wenger A.M., Bejerano G. GREAT improves functional interpretation of cis-regulatory regions. Nat. Biotechnol. 2010;28:495–501. doi: 10.1038/nbt.1630. [DOI] [PMC free article] [PubMed] [Google Scholar]
- 44.Marconett C.N., Zhou B., Sunohara M., Pouldar T.M., Wang H., Liu Y., Rieger M.E., Tran E., Flodby P., Siegmund K.D., et al. Cross-species transcriptome profiling identifies new alveolar epithelial Type i Cell-specific genes. Am. J. Respir. Cell Mol. Biol. 2017;56:310–321. doi: 10.1165/rcmb.2016-0071OC. [DOI] [PMC free article] [PubMed] [Google Scholar]
- 45.Szymaniak A.D., Mahoney J.E., Cardoso W.V., Varelas X. Crumbs3-Mediated Polarity Directs Airway Epithelial Cell Fate through the Hippo Pathway Effector Yap. Dev. Cell. 2015;34:283–296. doi: 10.1016/j.devcel.2015.06.020. [DOI] [PMC free article] [PubMed] [Google Scholar]
- 46.Burgstaller G., Oehrle B., Gerckens M., White E.S., Schiller H.B., Eickelberg O. The instructive extracellular matrix of the lung: basic composition and alterations in chronic lung disease. Eur. Respir. J. 2017;50:1601805. doi: 10.1183/13993003.01805-2016. [DOI] [PubMed] [Google Scholar]
- 47.Meiners S., Lloyd C., Chambers R.C. Cell-matrix interactions in lung disease and regeneration: ERS Lung Science Conference 2018 report. Eur. Respir. Rev. 2018;27:180040. doi: 10.1183/16000617.0040-2018. [DOI] [PMC free article] [PubMed] [Google Scholar]
- 48.Little D., Lynch A., Yan Y., Akiyama H., Kimura S., Chen J. Differential chromatin binding of the lung lineage transcription factor NKX2-1 resolves opposing murine alveolar cell fates in vivo. Nature Communications. 2021;12:2509. doi: 10.1038/s41467-021-22817-6. [DOI] [PMC free article] [PubMed] [Google Scholar]
- 49.Reddy N.M., Vegiraju S., Irving A., Paun B.C., Luzina I.G., Atamas S.P., Biswal S., Ana N.A., Mitzner W., Reddy S.P. Targeted deletion of Jun/AP-1 in alveolar epithelial cells causes progressive emphysema and worsens cigarette smoke-induced lung inflammation. Am. J. Pathol. 2012;180:562–574. doi: 10.1016/j.ajpath.2011.10.029. [DOI] [PMC free article] [PubMed] [Google Scholar]
- 50.Rahman I., MacNee W. Role of transcription factors in inflammatory lung diseases. Thorax. 1998;53:601–612. doi: 10.1136/thx.53.7.601. [DOI] [PMC free article] [PubMed] [Google Scholar]
- 51.Cho H.Y., Reddy S.P., Kleeberger S.R. Nrf2 defends the lung from oxidative stress. Antioxid. Redox Signal. 2006;8:76–87. doi: 10.1089/ars.2006.8.76. [DOI] [PubMed] [Google Scholar]
- 52.Chèneby J., Gheorghe M., Artufel M., Mathelier A., Ballester B. ReMap 2018: an updated atlas of regulatory regions from an integrative analysis of DNA-binding ChIP-seq experiments. Nucleic Acids Res. 2018;46(D1):D267–D275. doi: 10.1093/nar/gkx1092. [DOI] [PMC free article] [PubMed] [Google Scholar]
- 53.Hagan A.S., Zhang B., Ornitz D.M. Identification of a FGF18-expressing alveolar myofibroblast that is developmentally cleared during alveologenesis. Development. 2020;147:dev181032. doi: 10.1242/dev.181032. [DOI] [PMC free article] [PubMed] [Google Scholar]
- 54.Zepp J.A., Morley M.P., Loebel C., Kremp M.M., Chaudhry F.N., Basil M.C., Leach J.P., Liberti D.C., Niethamer T.K., Ying Y., et al. Genomic, epigenomic, and biophysical cues controlling the emergence of the lung alveolus. Science. 2021;371:eabc3172. doi: 10.1126/science.abc3172. [DOI] [PMC free article] [PubMed] [Google Scholar]
- 55.Wang J., Huang D., Zhou Y., Yao H., Liu H., Zhai S., Wu C., Zheng Z., Zhao K., Wang Z., et al. CAUSALdb: a database for disease/trait causal variants identified using summary statistics of genome-wide association studies. Nucleic Acids Res. 2020;48(D1):D807–D816. doi: 10.1093/nar/gkz1026. [DOI] [PMC free article] [PubMed] [Google Scholar]
- 56.Shrine N., Guyatt A.L., Erzurumluoglu A.M., Jackson V.E., Hobbs B.D., Melbourne C.A., Batini C., Fawcett K.A., Song K., Sakornsakolpat P., et al. Understanding Society Scientific Group New genetic signals for lung function highlight pathways and chronic obstructive pulmonary disease associations across multiple ancestries. Nat. Genet. 2019;51:481–493. doi: 10.1038/s41588-018-0321-7. [DOI] [PMC free article] [PubMed] [Google Scholar]
- 57.Ulirsch J.C., Lareau C.A., Bao E.L., Ludwig L.S., Guo M.H., Benner C., Satpathy A.T., Kartha V.K., Salem R.M., Hirschhorn J.N., et al. Interrogation of human hematopoiesis at single-cell and single-variant resolution. Nat. Genet. 2019;51:683–693. doi: 10.1038/s41588-019-0362-6. [DOI] [PMC free article] [PubMed] [Google Scholar]
- 58.Eapen M., Ward C., Walters H., Markos J., Chia C., Larby J., Haug G., Hills A., Hackett T.-L., Lu W., et al. Myofibroblasts are associated with increase in small airway thickening, epithelial plasticity and decreased lung function in COPD. European Respiratory Journal. 2018;52:OA2122. [Google Scholar]
- 59.Ntokou A., Klein F., Dontireddy D., Becker S., Bellusci S., Richardson W.D., Szibor M., Braun T., Morty R.E., Seeger W., et al. Characterization of the platelet-derived growth factor receptor-α-positive cell lineage during murine late lung development. Am. J. Physiol. Lung Cell. Mol. Physiol. 2015;309:L942–L958. doi: 10.1152/ajplung.00272.2014. [DOI] [PubMed] [Google Scholar]
- 60.McGowan S.E., Grossmann R.E., Kimani P.W., Holmes A.J. Platelet-derived growth factor receptor-alpha-expressing cells localize to the alveolar entry ring and have characteristics of myofibroblasts during pulmonary alveolar septal formation. Anat. Rec. (Hoboken) 2008;291:1649–1661. doi: 10.1002/ar.20764. [DOI] [PubMed] [Google Scholar]
- 61.Moiseenko A., Kheirollahi V., Chao C.M., Ahmadvand N., Quantius J., Wilhelm J., Herold S., Ahlbrecht K., Morty R.E., Rizvanov A.A., et al. Origin and characterization of alpha smooth muscle actin-positive cells during murine lung development. Stem Cells. 2017;35:1566–1578. doi: 10.1002/stem.2615. [DOI] [PubMed] [Google Scholar]
- 62.Guo M., Wang H., Potter S.S., Whitsett J.A., Xu Y. SINCERA: A Pipeline for Single-Cell RNA-Seq Profiling Analysis. PLoS Comput. Biol. 2015;11:e1004575. doi: 10.1371/journal.pcbi.1004575. [DOI] [PMC free article] [PubMed] [Google Scholar]
- 63.Chen L., Acciani T., Le Cras T., Lutzko C., Perl A.K.T. Dynamic regulation of platelet-derived growth factor receptor α expression in alveolar fibroblasts during realveolarization. Am. J. Respir. Cell Mol. Biol. 2012;47:517–527. doi: 10.1165/rcmb.2012-0030OC. [DOI] [PMC free article] [PubMed] [Google Scholar]
- 64.Zepp J.A., Zacharias W.J., Frank D.B., Cavanaugh C.A., Zhou S., Morley M.P., Morrisey E.E. Distinct Mesenchymal Lineages and Niches Promote Epithelial Self-Renewal and Myofibrogenesis in the Lung. Cell. 2017;170:1134–1148.e10. doi: 10.1016/j.cell.2017.07.034. [DOI] [PMC free article] [PubMed] [Google Scholar]
- 65.Wang Z., Li W., Guo Q., Wang Y., Ma L., Zhang X. Insulin-Like Growth Factor-1 Signaling in Lung Development and Inflammatory Lung Diseases. Biomed. Res. Int. 2018 doi: 10.1155/2018/6057589. [DOI] [PMC free article] [PubMed] [Google Scholar]
- 66.Xu J., Gong N.L., Bodi I., Aronow B.J., Backx P.H., Molkentin J.D. Myocyte enhancer factors 2A and 2C induce dilated cardiomyopathy in transgenic mice. J. Biol. Chem. 2006;281:9152–9162. doi: 10.1074/jbc.M510217200. [DOI] [PubMed] [Google Scholar]
- 67.Stempien-Otero A., Kim D.H., Davis J. Molecular networks underlying myofibroblast fate and fibrosis. J. Mol. Cell. Cardiol. 2016;97:153–161. doi: 10.1016/j.yjmcc.2016.05.002. [DOI] [PMC free article] [PubMed] [Google Scholar]
- 68.Rice N.A., Leinwand L.A. Skeletal myosin heavy chain function in cultured lung myofibroblasts. J. Cell Biol. 2003;163:119–129. doi: 10.1083/jcb.200303194. [DOI] [PMC free article] [PubMed] [Google Scholar]
- 69.Davis J., Burr A.R., Davis G.F., Birnbaumer L., Molkentin J.D. A TRPC6-dependent pathway for myofibroblast transdifferentiation and wound healing in vivo. Dev. Cell. 2012;23:705–715. doi: 10.1016/j.devcel.2012.08.017. [DOI] [PMC free article] [PubMed] [Google Scholar]
- 70.Coste B., Mathur J., Schmidt M., Earley T.J., Ranade S., Petrus M.J., Dubin A.E., Patapoutian A. Piezo1 and Piezo2 are essential components of distinct mechanically activated cation channels. Science. 2010;330:55–60. doi: 10.1126/science.1193270. [DOI] [PMC free article] [PubMed] [Google Scholar]
- 71.Zhong M., Komarova Y., Rehman J., Malik A.B. Mechanosensing Piezo channels in tissue homeostasis including their role in lungs. Pulm. Circ. 2018;8 doi: 10.1177/2045894018767393. 2045894018767393. [DOI] [PMC free article] [PubMed] [Google Scholar]
- 72.Nonomura K., Woo S.H., Chang R.B., Gillich A., Qiu Z., Francisco A.G., Ranade S.S., Liberles S.D., Patapoutian A. Piezo2 senses airway stretch and mediates lung inflation-induced apnoea. Nature. 2017;541:176–181. doi: 10.1038/nature20793. [DOI] [PMC free article] [PubMed] [Google Scholar]
- 73.Ball D.W. Achaete-scute homolog-1 and Notch in lung neuroendocrine development and cancer. Cancer Lett. 2004;204:159–169. doi: 10.1016/S0304-3835(03)00452-X. [DOI] [PubMed] [Google Scholar]
- 74.Montoro D.T., Haber A.L., Biton M., Vinarsky V., Lin B., Birket S.E., Yuan F., Chen S., Leung H.M., Villoria J., et al. A revised airway epithelial hierarchy includes CFTR-expressing ionocytes. Nature. 2018;560:319–324. doi: 10.1038/s41586-018-0393-7. [DOI] [PMC free article] [PubMed] [Google Scholar]
- 75.Yates B., Braschi B., Gray K.A., Seal R.L., Tweedie S., Bruford E.A. Genenames.org: the HGNC and VGNC resources in 2017. Nucleic Acids Res. 2017;45(D1):D619–D625. doi: 10.1093/nar/gkw1033. [DOI] [PMC free article] [PubMed] [Google Scholar]
- 76.Hsu Y.C., Osinski J., Campbell C.E., Litwack E.D., Wang D., Liu S., Bachurski C.J., Gronostajski R.M. Mesenchymal nuclear factor I B regulates cell proliferation and epithelial differentiation during lung maturation. Dev. Biol. 2011;354:242–252. doi: 10.1016/j.ydbio.2011.04.002. [DOI] [PMC free article] [PubMed] [Google Scholar]
- 77.Brabletz S., Brabletz T. The ZEB/miR-200 feedback loop--a motor of cellular plasticity in development and cancer? EMBO Rep. 2010;11:670–677. doi: 10.1038/embor.2010.117. [DOI] [PMC free article] [PubMed] [Google Scholar]
- 78.Niola F., Zhao X., Singh D., Castano A., Sullivan R., Lauria M., Nam H.S., Zhuang Y., Benezra R., Di Bernardo D., et al. Id proteins synchronize stemness and anchorage to the niche of neural stem cells. Nat. Cell Biol. 2012;14:477–487. doi: 10.1038/ncb2490. [DOI] [PMC free article] [PubMed] [Google Scholar]
- 79.Jen Y., Manova K., Benezra R. Expression patterns of Id1, Id2, and Id3 are highly related but distinct from that of Id4 during mouse embryogenesis. Dev. Dyn. 1996;207:235–252. doi: 10.1002/(SICI)1097-0177(199611)207:3<235::AID-AJA1>3.0.CO;2-I. [DOI] [PubMed] [Google Scholar]
- 80.Liu X., Rowan S., Liang J., Yao C., Huang G., Deng N., Xie T., Wu D., Wang Y., Burman A., et al. 2020. Definition and Signatures of Lung Fibroblast Populations in Development and Fibrosis in Mice and Men. [DOI] [Google Scholar]
- 81.Strunz M., Simon L.M., Ansari M., Kathiriya J.J., Angelidis I., Mayr C.H., Tsidiridis G., Lange M., Mattner L.F., Yee M., et al. Alveolar regeneration through a Krt8+ transitional stem cell state that persists in human lung fibrosis. Nat. Commun. 2020;11:3559. doi: 10.1038/s41467-020-17358-3. [DOI] [PMC free article] [PubMed] [Google Scholar]
- 82.Kobayashi Y., Tata A., Konkimalla A., Katsura H., Lee R.F., Ou J., Banovich N.E., Kropski J.A., Tata P.R. Persistence of a regeneration-associated, transitional alveolar epithelial cell state in pulmonary fibrosis. Nat. Cell Biol. 2020;22:934–946. doi: 10.1038/s41556-020-0542-8. [DOI] [PMC free article] [PubMed] [Google Scholar]
- 83.Choi J., Park J.E., Tsagkogeorga G., Yanagita M., Koo B.K., Han N., Lee J.H. Inflammatory Signals Induce AT2 Cell-Derived Damage-Associated Transient Progenitors that Mediate Alveolar Regeneration. Cell Stem Cell. 2020;27:366–382.e7. doi: 10.1016/j.stem.2020.06.020. [DOI] [PMC free article] [PubMed] [Google Scholar]
- 84.Warburton D. YAP and TAZ in lung development: The timing is important. Am. J. Respir. Cell Mol. Biol. 2020;62:141–142. doi: 10.1165/rcmb.2019-0300ED. [DOI] [PMC free article] [PubMed] [Google Scholar]
- 85.Nantie L.B., Young R.E., Paltzer W.G., Zhang Y., Johnson R.L., Verheyden J.M., Sun X. Lats1/2 inactivation reveals Hippo function in alveolar type I cell differentiation during lung transition to air breathing. Development. 2018;145:dev163105. doi: 10.1242/dev.163105. [DOI] [PMC free article] [PubMed] [Google Scholar]
- 86.Penkala I., Liberti D., Pankin J., Sivakumar A., Kremp M., Jayachandran S., et al. Age-dependent alveolar epithelial plasticity orchestrates lung homeostasis and regeneration. Cell Stem Cell. 2021;28:1775–1789.e5. doi: 10.1016/j.stem.2021.04.026. [DOI] [PMC free article] [PubMed] [Google Scholar]
- 87.Gokey J., Snowball J., Sridharan A., Sudha P., Kitzmiller J., Xu Y., et al. YAP regulates alveolar epithelial cell differentiation and AGER via NFIB/KLF5/NKX2-1. iScience. 2021;24:102967. doi: 10.1016/j.isci.2021.102967. [DOI] [PMC free article] [PubMed] [Google Scholar]
- 88.Zhou B., Stueve T., Mihalakakos E., Miao L., Mullen D., Wang Y., et al. Comprehensive epigenomic profiling of human alveolar epithelial differentiation identifies key epigenetic states and transcription factor co-regulatory networks for maintenance of distal lung identity. BMC Genomics. 2021;22:906. doi: 10.1186/s12864-021-08152-6. [DOI] [PMC free article] [PubMed] [Google Scholar]
- 89.Isago H., Mitani A., Mikami Y., Horie M., Urushiyama H., Hamamoto R., Terasaki Y., Nagase T. Epithelial expression of YAP and TAZ is sequentially required in lung development. Am. J. Respir. Cell Mol. Biol. 2020;62:256–266. doi: 10.1165/rcmb.2019-0218OC. [DOI] [PubMed] [Google Scholar]
- 90.Jean J.C., George E., Kaestner K.H., Brown L.A.S., Spira A., Joyce-Brady M. Transcription factor Klf4, induced in the lung by oxygen at birth, regulates perinatal fibroblast and myofibroblast differentiation. PLoS One. 2013;8:e54806. doi: 10.1371/journal.pone.0054806. [DOI] [PMC free article] [PubMed] [Google Scholar]
- 91.Tsao P.-N., Matsuoka C., Wei S.-C., Sato A., Sato S., Hasegawa K., Chen H.-K., Ling T.-Y., Mori M., Cardoso W.V., Morimoto M. Epithelial Notch signaling regulates lung alveolar morphogenesis and airway epithelial integrity. Proc. Natl. Acad. Sci. USA. 2016;113:8242–8247. doi: 10.1073/pnas.1511236113. [DOI] [PMC free article] [PubMed] [Google Scholar]
- 92.McGowan S.E., McCoy D.M. Platelet-derived growth factor receptor-α and Ras-related C3 botulinum toxin substrate-1 regulate mechano-responsiveness of lung fibroblasts. Am. J. Physiol. Lung Cell. Mol. Physiol. 2017;313:L1174–L1187. doi: 10.1152/ajplung.00185.2017. [DOI] [PubMed] [Google Scholar]
- 93.Chesler A.T., Szczot M., Bharucha-Goebel D., Čeko M., Donkervoort S., Laubacher C., Hayes L.H., Alter K., Zampieri C., Stanley C., et al. The role of PIEZO2 in human mechanosensation. N. Engl. J. Med. 2016;375:1355–1364. doi: 10.1056/NEJMoa1602812. [DOI] [PMC free article] [PubMed] [Google Scholar]
- 94.Delle Vedove A., Storbeck M., Heller R., Hölker I., Hebbar M., Shukla A., Magnusson O., Cirak S., Girisha K.M., O’Driscoll M., et al. Biallelic Loss of Proprioception-Related PIEZO2 Causes Muscular Atrophy with Perinatal Respiratory Distress, Arthrogryposis, and Scoliosis. Am. J. Hum. Genet. 2016;99:1206–1216. doi: 10.1016/j.ajhg.2016.09.019. [DOI] [PMC free article] [PubMed] [Google Scholar]
- 95.Lake B.B., Chen S., Hoshi M., Plongthongkum N., Salamon D., Knoten A., Vijayan A., Venkatesh R., Kim E.H., Gao D., et al. A single-nucleus RNA-sequencing pipeline to decipher the molecular anatomy and pathophysiology of human kidneys. Nat. Commun. 2019;10:2832. doi: 10.1038/s41467-019-10861-2. [DOI] [PMC free article] [PubMed] [Google Scholar]
- 96.Lake B.B., Ai R., Kaeser G.E., Salathia N.S., Yung Y.C., Liu R., Wildberg A., Gao D., Fung H.-L., Chen S., et al. Neuronal subtypes and diversity revealed by single-nucleus RNA sequencing of the human brain. Science. 2016;352:1586–1590. doi: 10.1126/science.aaf1204. [DOI] [PMC free article] [PubMed] [Google Scholar]
- 97.Rai V., Quang D.X., Erdos M.R., Cusanovich D.A., Daza R.M., Narisu N., Zou L.S., Didion J.P., Guan Y., Shendure J., et al. Single-cell ATAC-Seq in human pancreatic islets and deep learning upscaling of rare cells reveals cell-specific type 2 diabetes regulatory signatures. Mol. Metab. 2020;32:109–121. doi: 10.1016/j.molmet.2019.12.006. [DOI] [PMC free article] [PubMed] [Google Scholar]
- 98.Kia A., Gloeckner C., Osothprarop T., Gormley N., Bomati E., Stephenson M., Goryshin I., He M.M. Improved genome sequencing using an engineered transposase. BMC Biotechnol. 2017;17:6. doi: 10.1186/s12896-016-0326-1. [DOI] [PMC free article] [PubMed] [Google Scholar]
- 99.Danecek P., Bonfield J.K., Liddle J., Marshall J., Ohan V., Pollard M.O., Whitwham A., Keane T., McCarthy S.A., Davies R.M., Li H. Twelve years of SAMtools and BCFtools. Gigascience. 2021;10:1–4. doi: 10.1093/gigascience/giab008. [DOI] [PMC free article] [PubMed] [Google Scholar]
- 100.Fang R., Preissl S., Li Y., Hou X., Lucero J., Wang X., Motamedi A., Shiau A.K., Zhou X., Xie F., et al. Comprehensive analysis of single cell ATAC-seq data with SnapATAC. Nat. Commun. 2021;12:1337. doi: 10.1038/s41467-021-21583-9. [DOI] [PMC free article] [PubMed] [Google Scholar]
- 101.Bravo González-Blas C., Minnoye L., Papasokrati D., Aibar S., Hulselmans G., Christiaens V., Davie K., Wouters J., Aerts S. cisTopic: cis-regulatory topic modeling on single-cell ATAC-seq data. Nat. Methods. 2019;16:397–400. doi: 10.1038/s41592-019-0367-1. [DOI] [PMC free article] [PubMed] [Google Scholar]
- 102.Ramírez F., Ryan D.P., Grüning B., Bhardwaj V., Kilpert F., Richter A.S., Heyne S., Dündar F., Manke T. deepTools2: a next generation web server for deep-sequencing data analysis. Nucleic Acids Res. 2016;44(W1):W160-5. doi: 10.1093/nar/gkw257. [DOI] [PMC free article] [PubMed] [Google Scholar]
- 103.Kent W.J., Sugnet C.W., Furey T.S., Roskin K.M., Pringle T.H., Zahler A.M., Haussler D. The human genome browser at UCSC. Genome Res. 2002;12:996–1006. doi: 10.1101/gr.229102. [DOI] [PMC free article] [PubMed] [Google Scholar]
- 104.Cusanovich D.A., Reddington J.P., Garfield D.A., Daza R.M., Aghamirzaie D., Marco-Ferreres R., Pliner H.A., Christiansen L., Qiu X., Steemers F.J., et al. The cis-regulatory dynamics of embryonic development at single-cell resolution. Nature. 2018;555:538–542. doi: 10.1038/nature25981. [DOI] [PMC free article] [PubMed] [Google Scholar]
- 105.Stuart T., Srivastava A., Madad S., Lareau C.A., Satija R. Single-cell chromatin state analysis with Signac. Nat. Methods. 2021;18:1333–1341. doi: 10.1038/s41592-021-01282-5. [DOI] [PMC free article] [PubMed] [Google Scholar]
- 106.Yu G., Wang L.G., He Q.Y. ChIPseeker: an R/Bioconductor package for ChIP peak annotation, comparison and visualization. Bioinformatics. 2015;31:2382–2383. doi: 10.1093/bioinformatics/btv145. [DOI] [PubMed] [Google Scholar]
- 107.Hahne F., Ivanek R. Visualizing genomic data using Gviz and bioconductor. Methods Mol. Biol. 2016;1418:335–351. doi: 10.1007/978-1-4939-3578-9_16. [DOI] [PubMed] [Google Scholar]
- 108.Hao Y., Hao S., Andersen-Nissen E., Mauck W.M., 3rd, Zheng S., Butler A., Lee M.J., Wilk A.J., Darby C., Zager M., et al. Integrated analysis of multimodal single-cell data. Cell. 2021;184:3573–3587.e29. doi: 10.1016/j.cell.2021.04.048. [DOI] [PMC free article] [PubMed] [Google Scholar]
Associated Data
This section collects any data citations, data availability statements, or supplementary materials included in this article.
Supplementary Materials
(A) Cell type counts. (B) Top differentially active genes for all human clusters. (C) Top ChromVAR TF activities for all human clusters. (D) Top differentially active genes for all mouse clusters. (E) Top ChromVAR TF activities for all mouse clusters.
(A) Top differentially active genes for D1 clusters. (B) Top ChromVAR TF activities for D1 clusters. (C) Motif enrichment of regulatory regions linked to marker genes for D1 clusters. (D) Top differentially active genes for P1 clusters. (E) Top ChromVAR TF activities for P1 clusters. (F) Motif enrichment of regulatory regions linked to marker genes for P1 clusters.
Data Availability Statement
-
•
Single-cell THS-seq data have been deposited at GEO and are publicly available. Accession numbers are listed in the key resources table. Microscopy data reported in this paper will be shared by the lead contact upon request.
-
•
All code for analysis is publicly available as of the date of publication at this github repository: github.com/ThuElizabethD/Lung-scTHS-seq.
-
•
Any additional information required to reanalyze the data reported in this paper is available from the lead contact upon request.