Abstract
Recent studies indicate that filtered albumin is retrieved in the proximal tubule (PT) via three pathways: receptor-mediated endocytosis via cubilin (high affinity) and megalin (low affinity), and fluid-phase uptake. Expression of megalin is required to maintain all three pathways, making it challenging to determine their respective contributions. Moreover, uptake of filtered molecules varies between the sub-segments (S1, S2, and S3) that make up the PT. Here we used new and published data to develop a mathematical model that predicts the rates of albumin uptake in mouse PT sub-segments in normal and nephrotic states, and partially accounts for competition by β2-microglobulin (β2m) and Immunoglobulin G (IgG). Our simulations indicate that receptor-mediated, rather than fluid-phase uptake, accounts for the vast majority of ligand recovery. Our model predicts that ~75% of normally filtered albumin is reabsorbed via cubilin; however, megalin-mediated uptake predominates under nephrotic conditions. Our results also suggest that ~80% of albumin is normally recovered in S1, whereas nephrotic conditions or knockout of cubilin shifts the bulk of albumin uptake to S2. The model predicts β2m and IgG axial recovery profiles qualitatively similar to those of albumin under normal conditions. In contrast with albumin however, the bulk of IgG and β2m uptake still occurs in S1 under nephrotic conditions. Overall, our model provides a kinetic rationale for why tubular proteinuria can occur even though a large excess in potential PT uptake capacity exists, and suggests testable predictions to expand our understanding of the recovery profile of filtered proteins along the PT.
Keywords: megalin, cubilin, endocytosis, proteinuria, kidney
Graphical Abstract
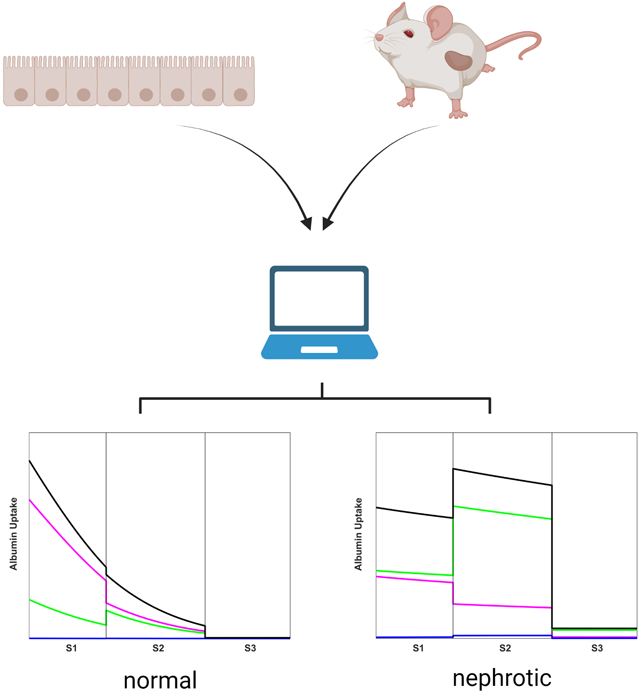
Data from mouse models and from cultured proximal tubule (PT) cells were used to create a mathematical model that predicts the uptake profile of albumin and other filtered ligands along the mouse PT in normal and nephrotic states. The distinct contributions of cubilin receptors (magenta), megalin receptors (green), and fluid phase uptake (blue) to total albumin retrieval (black) in S1, S2, and S3 subsegments of the PT are delineated. Under normal conditions, albumin is primarily recovered in the S1 segment by cubilin, whereas the majority is retrieved in S2 under nephrotic conditions. Other proteins exhibit strikingly different uptake profiles. Our model explains how the distribution and capacity of high-affinity and low-affinity uptake pathways enable uptake of albumin over a broad range of filtered concentrations, and how tubular proteinuria can occur despite a large excess in potential PT uptake capacity. Created with BioRender.com.
INTRODUCTION
A primary function of the kidney proximal tubule (PT) is to recover albumin and other plasma proteins that escape the glomerular filtration barrier. Under normal conditions, the barrier presents a formidable obstacle that limits protein entry into the tubule lumen, and proteins are retrieved nearly completely to maintain a protein-free urine. In disease conditions where the glomerular barrier is impaired, considerably higher concentrations of plasma proteins enter the tubule. Recent studies demonstrate that under these conditions, the PT exhibits a large reserve capacity for recovering filtered proteins that is orders of magnitude above the normal level (Weyer et al., 2018).
The efficient retrieval of filtered proteins is mediated by megalin and CUBAM [comprising cubilin and amnionless (AMN) subunits] receptors that are abundantly expressed in PT cells (Christensen et al., 2012a; Eshbach & Weisz, 2017). Megalin and CUBAM are known to associate in a complex but can also function independently to retrieve ligands. The cytoplasmic domains of megalin and AMN mediate clathrin-dependent endocytosis by binding to the clathrin adaptor protein disabled-2 (Dab2). After internalization, ligands are dissociated from their receptors in apical endosomes and targeted for degradation, while receptors are recycled back to the apical surface (Christensen et al., 2012a; Eshbach & Weisz, 2017).
Studies using knockout (KO) mice and siRNA in cell culture have begun to elucidate the pathways involved in endocytic retrieval of filtered proteins, as well as the selective roles of megalin and cubilin in these processes (Weisz, 2021). Deconvolution of albumin uptake curves in a highly differentiated OK cell culture model of the PT revealed three components: a high-affinity component of Km ~ 50 μg/mL, a low-affinity component of Km ~ 300 μg/mL, and a non-saturable component (Ren et al., 2020). No clathrin-independent apical uptake pathways have been described in PT cells, and the non-saturable component is assumed to represent uptake in the fluid incorporated into clathrin-coated vesicles. Knockdown of cubilin reduced the capacity of the high affinity component whereas depletion of megalin obliterated the low affinity component, suggesting that these receptors mediate high- and low-affinity uptake of albumin, respectively. While fluid-phase uptake is negligible at low concentrations of albumin, it represents a significant contribution to albumin recovery by OK cells at very high concentrations (Ren et al., 2020).
The availability of three uptake pathways with distinct affinities and capacities provides the flexibility to efficiently retrieve filtered albumin using a saturable, receptor-mediated pathway tailored to normally-filtered concentrations of ligand, while also maintaining reserve capacity to accommodate the increases in albumin filtration that occur in nephrotic disease. Indeed, studies in KO mice confirm that the PT maintains a very high reserve capacity to take up protein under nephrotic conditions (Weyer et al., 2018). Much of this reserve capacity is directly dependent on the expression of megalin and CUBAM receptors, as knockout of megalin and cubilin in podocin-deficient mice increased urinary excretion of albumin by 40% over podocin alone (Weyer et al., 2018). The demonstration of very high retrieval of albumin in microdissected perfused rabbit tubules attributed to fluid-phase endocytosis suggests the possibility that this mechanism of uptake may contribute significantly to albumin recovery under nephrotic conditions (Park & Maack, 1984).
Understanding the contribution of each uptake pathway to the recovery of normal and nephrotic levels of albumin is complicated by axial heterogeneity along the PT. The PT is divided into three sub-segments, termed S1, S2, and S3, that differ both morphologically and functionally (Zhai et al., 2003; Kalakeche et al., 2011; Christensen et al., 2012b; Lee et al., 2015; Limbutara et al., 2020). Expression of megalin and cubilin receptors, endocytic pathway markers, and Dab2 vary between segments (Schuh et al., 2018; Limbutara et al., 2020; Christensen et al., 2021). The relative contribution of each albumin uptake pathway within a given sub-segment will depend in part on the level of receptor expressed and the concentration of ligand along the PT axis. Under nephrotic conditions where tubular albumin levels exceed the saturable capacity, fluid reabsorption along the tubule axis will progressively increase the luminal albumin concentration, potentially enhancing the contribution of fluid-phase uptake to overall albumin retrieval in more distal PT sub-segments.
Adding to the challenge of deciphering the contribution of each receptor/uptake pathway on albumin retrieval is that all three uptake pathways are reliant on the expression of megalin and Dab2. Loss of megalin or Dab2 expression in vertebrates leads to a dramatic reduction in the number of apical endocytic compartments, including endocytic vesicles (Nagai et al., 2005; Kur et al., 2011; Dachy et al., 2015). As a consequence, trafficking of CUBAM is impaired, and uptake via fluid-phase is also considerably reduced in either megalin or Dab2 KO cells (Ren et al., 2020).
In the present study, we used published and new experimental data to create a model that describes the axial uptake of filtered albumin in normal and nephrotic states in mice. Our model accounts partially for the potential competition for receptor-mediated uptake of filtered proteins other than albumin whose relative tubular concentrations varies based on glomerular barrier integrity, and compares their uptake to that of albumin. Endocytic responses to changes in flow that have been documented in cell culture are also included (Raghavan et al., 2014; Long et al., 2017).
METHODS
EXPERIMENTAL PROTOCOLS
Ethical approval
All experimental procedures were approved by the Institutional Animal Care and Use Committee of the University of Pittsburgh (IACUC approval #21079537).
Axial uptake of dextran in mouse PT
C57/BL6 mice (2 males and 2 females, 10 weeks) were injected intracardially with 0.75 mg 10kD Alexa Fluor™ 568 dextran (Invitrogen, #D22912) and sacrificed after 3 min (using isoflurane). Kidneys were harvested and immediately sectioned. Dextran was visualized in living kidney sections (2 mice). The remaining kidney was fixed and sectioned, and stained with antibodies to highlight PT segments (S1: SGLT2, Abcam, #85626, 1:400; S2: OAT1, Alpha Diagnostic, #OAT11A, 1:200; S3: aquaporin-4, Alomone Labs, #AQP-004, 1:500). Images were obtained using a Leica SP8 inverted confocal microscope with environmental chamber, motorized stage, and 25X 0.95 numerical aperture (NA) and 40X 1.1 NA water objectives. Tilescans were generated to document important anatomic landmarks to facilitate interpretation of PT segments. Dextran uptake was grossly quantitated from line profiles drawn perpendicular to the PT segment using LASX software from maximum projections of the live dataset (3 tilescans from one male). Approximately 45 line scans contributed to mean intensity estimate for presumed S2 and ten line scans for confirmed S1 as it was observed to emerge from glomerulus.
Impact of IgG and beta-2-microglobulin on albumin uptake
Opossum kidney (OK) cells (RRID:CVCL_0472; OK-P subclone originally obtained from Moshe Levi, Georgetown University) were cultured on transwell supports under continuous orbital shear stress as described in Long et al. (2017). Cells grown in this manner harbor key features of PT cells in vivo, including a highly-developed brush border and apical endocytic pathway, and high levels of megalin, cubilin, and Dab2 expression (Long et al., 2017; Park et al., 2020; Ren et al., 2020). Alexa Fluor-647 goat anti-rabbit Immunoglobulin G (IgG) was purchased from Invitrogen (#A21245). Native human beta-2-microglobulin (β2m) was purchased from Bio-Rad (0824) and conjugated to Alexa Fluor-647 using the Alexa Fluor™ 647 Protein Labeling Kit (Invitrogen #A20173). To assess whether these ligands compete for albumin uptake and vice-versa, OK cells were incubated in serum-free medium with the indicated concentrations of Alexa Fluor-488 albumin (Invitrogen #A13100) and either Alexa Fluor-647 IgG or β2m for 15 min at 37°C, then solubilized and cell-associated fluorescence quantified by spectrofluorimetry as described (Long et al., 2017; Ren et al., 2020). Control studies confirmed that there was no appreciable bleed-through between the emission wavelengths used to quantify each ligand.
Uptake of IgG and β2m by PT cells
To measure concentration-dependent uptake of IgG and β2m by PT cells, OK cells were incubated with increasing concentrations of each ligand as above. The contribution of fluid-phase uptake was determined in parallel samples by the inclusion of 2 g/L unlabeled fatty-acid free albumin (Sigma #A7030) to compete for receptor-mediated uptake. Studies in CRISPR/Cas9 Cubn KO vs control cells were performed to determine the role of cubilin in uptake of both ligands (Long et al., 2021).
MODEL DESCRIPTION
The present model describes the transport of albumin, β2m, and IgG in the PT. The tubule is represented as a rigid cylinder of fixed radius R and length L, with axial coordinate z. Cubilin-mediated endocytosis and megalin-mediated endocytosis are modelled as saturable processes that obey Michaelis-Menten kinetics, whereas fluid-phase uptake is proportional to the rate of fluid internalization and solute concentration.
Fluid flow profile
Fluid flow in the tubular lumen is taken to decrease exponentially (Weinstein et al., 2007). The local flow Q(z) and local mean velocity u(z) are then given by (Gliozzi et al., 2020; Edwards et al., 2021):
| (1) |
where Q0 and u0 denote the flow and velocity at the tubule entrance. The parameter ω, which governs the rate of change, is calculated knowing the fraction (fw) of water that is reabsorbed over length L:
| (2a) |
| (2b) |
Note that the model assumes variable rates of ion-driven (non-endocytotic) fluid reabsorption in S1-S2 versus S3, to account for possible segment-dependent variations in fw in response to specific experimental maneuvers or drugs.
Albumin concentration profile
In the following equations, Calb denotes the luminal concentration of albumin, Cb the luminal concentration of β2m, and Ci the luminal concentration of IgG. Taking into account the three uptake pathways as well as potential competition between filtered proteins, the flux of albumin at the apical surface Jalb is given by:
| (3) |
The first and second terms respectively describe cubilin- and megalin-mediated uptake, and the third term fluid-phase uptake. Km,alb is the affinity of cubilin (superscript “cub”) or megalin (superscript “meg”) to albumin, Km,b is the affinity of cubilin or megalin to β2m, Km,i is the affinity of cubilin or megalin to IgG, Vm is the maximum uptake capacity via cubilin or megalin at coordinate z, and Jv,up is the rate of volume internalization via fluid-phase uptake. Assuming no binding of β2m or IgG to megalin (see below), Equation (3) can be simplified as:
| (4) |
To account for the flow-dependence of endocytosis (Raghavan et al., 2014; Long et al., 2017), we assume that Vm varies as follows:
| (5) |
Vmax represents the maximum uptake capacity; since it is proportional to receptor expression, its value differs between S1, S2 and S3. The parameter denotes the entrance velocity under basal (normal) conditions.
Conservation of albumin at steady state can be written as (Gliozzi et al., 2020; Edwards et al., 2021):
| (6) |
Equation (6) implicitly assumes that albumin transport is not limited by diffusion from the bulk fluid to the base of the microvilli. A previous model found that accounting for mass transfer resistance in the intermicrovillar space has only a modest effect (Lazzara & Deen, 2007), and comparing model predictions with/without diffusional resistance in a simple case here showed minimal impact on uptake (results not shown). Hence, as in more recent models (Gliozzi et al., 2020; Edwards et al., 2021), we omitted mass transfer resistance in favor of a simpler approach. Combining Eqns. (1), (4), and (6), we have:
| (7) |
After taking into account Eqn. (5) and simplifying, we obtain:
| (8) |
Similarly, the luminal concentrations of β2m and IgG respectively obey the following equations:
| (9) |
| (10) |
Equations (8–10) are solved using MATLAB®, after specifying the entrance conditions Calb(z = 0), Cb(z = 0), and Ci(z = 0), namely the concentrations of albumin, β2m, and IgG in the glomerular filtrate. We consider both short (SLN) and long (LLN) loop nephrons, which are taken to differ only by the length of their sub-segments S1, S2, and S3. Hence, Equations (8–10) are solved separately for SLN and LLN, and total uptake is computed based upon the SLN-to-LNL ratio in mice, taken as 64:36 (Ichii et al., 2006). The computational code is available from the corresponding author upon request.
Model parameters
Parameter values are summarized in Table 1. The total length of the PT was set to 5.1 mm in SLNs and 6.2 mm in LLNs (Letts et al., 2017). In the absence of mouse-specific data, we assumed that the relative lengths of S1, S2, and S3 in SLN and LLN are equal to those measured in the rat (Christensen et al., 2021). The analysis of anatomical data by Knepper and colleagues (Clark et al., 2019) suggests that rat and mice have similar distributions of PT sub-segments, although their estimate of the relative abundance of S3 cells relative to S1 and S2 in both species is lower than that recently reported (Christensen et al., 2021).
Table 1.
Parameter Values – Baseline
| Parameter | Value | Reference |
|---|---|---|
| Functional tubule length, L | SLN: 5.12 mm (S1 1.51 mm, S2 1.94 mm, S3 1.67 mm) LLN: 6.17 mm (S1 2.41 mm, S2 1.88 mm, S3 1.88 mm) |
(Letts et al., 2017; Christensen et al., 2021) (see text) |
| Proximal tubule radius | 10.8 μm | (Letts et al., 2017) |
| Glomerular filtration rate, GFR | 295 μL/min | (Hashimoto et al., 2005) |
| Single nephron GFR, Q0 | 11.7 nL/min | (Hashimoto et al., 2005) |
| Reference fluid velocity at entrance, u0* | 0.53 mm/s | |
| Fractional water reabsorption, fw Rate of flow decrease, ω |
60% (50% in S1–S2, 10% in S3) SLN: 0.201 mm−1 in S1–S2, 0.063 mm−1 in S3 LLN: 0.162 mm−1 in S1–S2, 0.056 mm−1 in S3 |
(Hashimoto et al., 2005) |
| Concentration of albumin in filtrate | 30.5 nmol/L (2.0 mg/L) | (Weyer et al., 2018) |
| Concentration of β2m in filtrate | 117.7 nmol/L (1.37 mg/L) | See text |
| Concentration of IgG in filtrate | 0.625 nmol/L (0.1 mg/L) | See text |
| Affinity of cubilin to albumin, | 672 nmol/L (44 mg/L) | (Ren et al., 2020) |
| Affinity of cubilin to β2m, | 420 nmol/L (4.87 mg/L) | (Leheste et al., 1999) |
| Affinity of cubilin to IgG, | 625 nmol/L (100 mg/L) | See text |
| Affinity of megalin to albumin, | 4504 nmol/L (295 mg/L) | (Ren et al., 2020) |
| Relative density of cubilin | S1: 0.54, S2: 0.34, S3: 0.12 | (Limbutara et al., 2020) |
| Maximum uptake capacity via cubilin, | 2.27 fmol/s/mm2 S1: 2.27 * 0.608 = 1.38 S2: 2.27 * 0.375 = 0.85 S3: 2.27 * 0.017 = 0.04 |
Estimated |
| Relative density of megalin | S1: 0.24, S2: 0.49, S3: 0.27 | (Limbutara et al., 2020) |
| Maximum uptake capacity via megalin, | 6.38 fmol/s/mm2 S1: 6.38 * 0.308 = 1.97 S2: 6.38 * 0.646 = 4.12 S3: 6.38 * 0.046 = 0.29 |
Estimated |
| Rate of volume internalization via fluid-phase uptake, Jv,up | S1: 0.111 nL/min/mm2 S2: 0.233 nL/min/mm2 S3: 0.017 nL/min/mm2 |
(Gekle et al., 1995) See text |
The values of and in S1, S2, and S3 were taken to be proportional to the relative expression of cubilin and megalin in each segment. The latter was determined from the protein expression levels of cubilin and megalin determined by quantitative proteomics of rat nephron segments (Limbutara et al., 2020). Because the S3 segment contains a relatively undeveloped endocytic pathway relative to S1 and S2 (Christensen et al., 2012b; Christensen et al., 2021) and also expresses dramatically reduced levels of Dab2 (~13% that of S1 or S2 cells) (Limbutara et al., 2020), we corrected megalin and cubilin Vmax values to account for the presumed reduction in endocytic rate in this segment (Table 1). Specifically, the proteomic expression of cubilin in S1, S2 and S3 was reported as 679335, 419164, 150646, respectively (Limbutara et al., 2020). After multiplying the value in S3 by 0.13, the fractional “effective” cubilin expression was computed as 60.8% in S1, 37.5% in S2, and 1.7% in S3. Similarly, the proteomic expression of megalin in S1, S2 and S3 is 1526800, 3194703, and 1744919, respectively (Limbutara et al., 2020). With the Dab2 correction, in S3, the fractional “effective” megalin expression was computed as 30.8% in S1, 64.6% in S2, and 4.6% in S3.
From the observation that static OK cells reabsorb 0.6% of their volume per minute (Gekle et al., 1995), we estimated the rate of volume internalization via fluid-phase uptake (Jv,up) in S1 as 0.111 nL/min/mm2, based on an average cell height of 18.5 μm (unpublished confocal imaging data). Assuming that fluid-phase uptake is proportional to megalin and Dab2 expression, Jv,up was set to 0.111*64.6/30.8 = 0.233 nL/min/mm2 in S2, and 0.111*4.6/30.8 = 0.017 nL/min/mm2 in S3.
To our knowledge, the concentration of albumin in the glomerular filtrate has not been measured directly in mice. Estimates based upon albumin excretion in KO models range from 0.5 mg/L (Mori et al., 2017) to 4 mg/L (Weyer et al., 2011). We choose an intermediate value of 2.0 mg/L (30.5 nM), which is close to the value of 1.9 mg/L derived from the study of Weyer et al. (2018).
The filtrate concentration of IgG was determined as the product of plasma IgG concentration, for which we found values ranging from 2 to 6 mg/mL in mice (Mink & Benner, 1979; Klein-Schneegans et al., 1989; Honjo et al., 2012), and the IgG sieving coefficient, which was reported as 1.4×10⁻⁵ in mouse and 4.2×10⁻⁵ in human (Norden et al., 2001; Mori et al., 2017). We used an intermediate value of 0.1 mg/L (0.625 nM).
In the absence of mouse-specific data, the filtrate concentration of β2m was estimated as the product of its plasma concentration and sieving coefficient in human (Norden et al., 2001; Drueke & Massy, 2009), that is, 1.5 mg/L*0.91 = 1.37 mg/L (117.7 nM).
RESULTS
Axial uptake of a fluid-phase marker
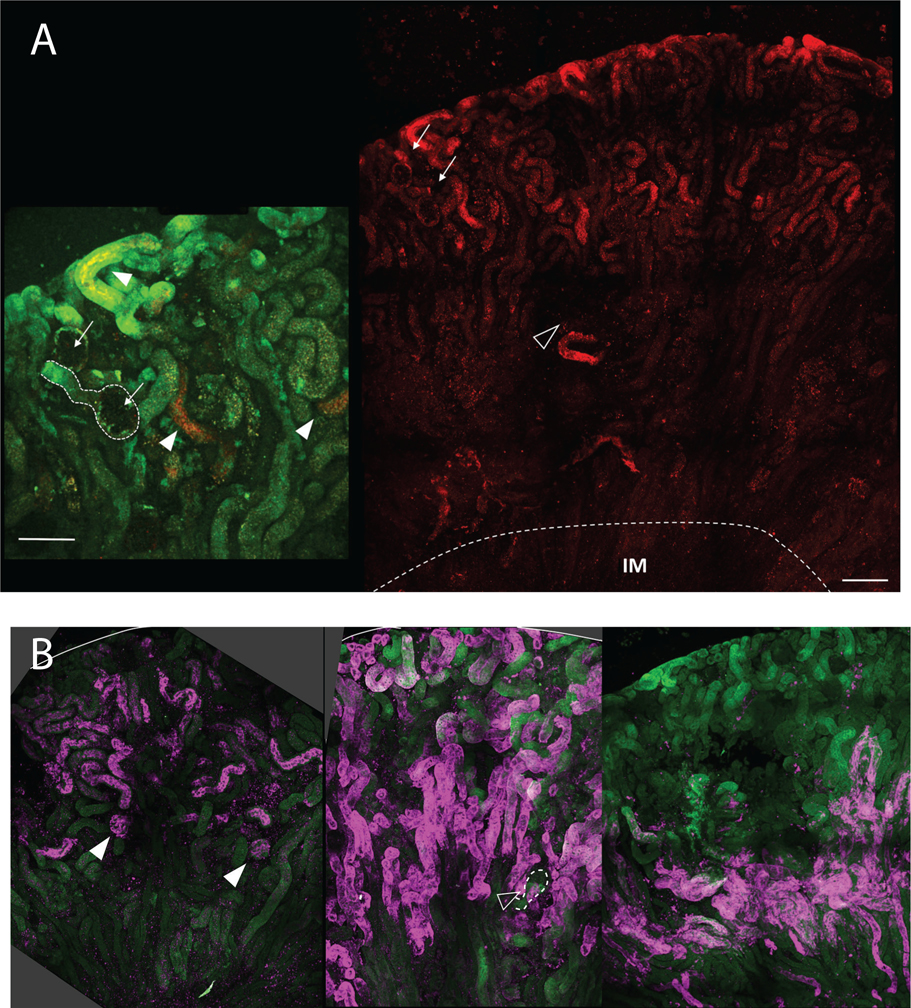
We observed that 10 kD Alexa Fluor-568 dextran acutely delivered into the circulation of mice by intracardiac injection was preferentially recovered distal to the S1 segment of the PT (Fig. 1). In isolated nephrons, we observed transitions in the level of dextran recovery along individual nephrons. While uptake varied considerably between nephrons consistent with previous reports (Schuh et al., 2018), the accumulation of dextran in deeper regions of the cortex near the medullary boundary (defined by the arcuate artery in Fig. 1A) suggests preferential retrieval within the S2 segment. Low magnification tilescan images of fixed kidney sections stained with markers for S1, S2, and S3 segments confirmed that dextran uptake most closely matched the S2 staining profile (Fig. 1B). Quantitative estimates of dextran intensity in this compartment relative to S1 segments (PT as it first emerges from Bowman’s capsule judged by 3D projections) suggest a 7-fold enhancement of fluid-phase uptake. The increased uptake of dextran in S2 is consistent with recent studies suggesting that more distal regions of the PT harbor a reserve capacity that can be accessed when higher concentrations of ligand are filtered (Schuh et al., 2018; Christensen et al., 2021).
Figure 1.
Fluorescence image of mouse kidney injected with dextran showing preferential uptake of dextran in proximal tubule S2 segments. (A) Maximum projection of large tilescan image showing distribution of injected Alexa Fluor 568 conjugated dextran (10kD). Arrows indicate 2 glomeruli with proximal tubule S1 segments revealing little to no uptake of dextran. Open arrowhead indicates location of arcuate artery. Dashed line indicates border between inner and outer medulla. Scale bar 250 μm. Inset to left; 2X magnification of same region with 2 glomeruli similarly marked, and dashed outline of S1. Green autofluorescence is overlaid to confirm areas of greater dextran uptake (arrowheads). Scale bar 100 μm. (B) Three panels from left to right showing distribution of S1 (SGLT2), S2 (OAT1) and S3 (AQP-4) segments in maximum projection large tilescan images. Solid arrowheads in left panel mark glomeruli and associated S1 segments positive for SGLT2. Open arrowhead in middle panel points to a glomerulus and associated S1 segment without OAT1 staining (outlined by the dashed line), consistent with its use as a marker of S2 segments. Right panel shows positive proximal tubule AQ4 staining primarily around the corticomedullary junction consistent with S3 distribution.
Competitive binding by filtered ligands at normal vs nephrotic concentrations
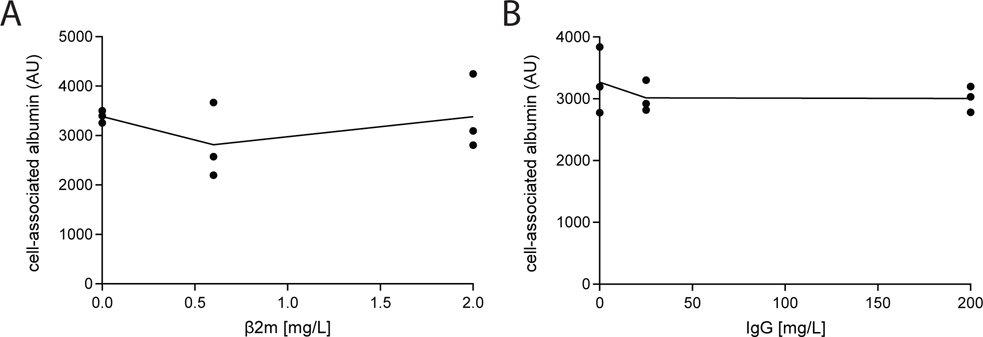
Under normal conditions, retrieval of albumin in the PT may be reduced due to competitive inhibition for uptake by lower molecular mass filtered proteins that enter the tubule lumen at relatively high concentration. Based on studies in Dent1 disease patients, β2m is predicted to be the most abundant tubular protein in the filtrate (Edwards et al., 2021), with an estimated concentration of 1.4 mg/L (121 nM). To evaluate whether β2m inhibits uptake of albumin, we tested the effect of increasing concentrations of fluorescently-tagged purified β2m on the uptake of albumin by OK cells. As shown in Fig. 2A, even high concentrations of β2m (2 mg/L; 172 nM) had no effect on the uptake of 25 mg/L (382 nM) albumin.
Figure 2.
Competition for albumin uptake by β−2-microglobulin (β2m) and IgG. OK cells cultured on transwell supports under orbital shear stress were incubated with 25 mg/L Alexa Fluor-488 albumin and the indicated concentrations of (A) β2m or (B) IgG for 15 min at 37°C. Cells were solubilized and cell-associated fluorescence quantified by spectrofluorimetry. The points show albumin uptake (one filter per point) in three independent experiments and the line represents the mean of the data.
In addition to the recovery of normally filtered proteins, megalin and cubilin receptors also bind to proteins with higher molecular mass than albumin that are normally efficiently excluded from the tubular filtrate. When the integrity of the glomerular barrier is compromised, increased levels of these proteins also gain access to the tubular filtrate, and may compete with albumin for uptake. Immunoglobulins are the most abundant plasma protein after albumin, with an estimated concentration in mouse plasma of 2500 mg/L (Klein-Schneegans et al., 1989; Honjo et al., 2012) (compared with 25000–30000 mg/L for albumin) (Mori et al., 2017; Weyer et al., 2018). The normal tubular concentration of IgG was estimated to be 0.1 mg/L under normal conditions (see Methods), and 2 mg/L under nephrotic conditions. In a previous study, IgG was found to inhibit albumin uptake only at very high (suprapathologic) concentrations (200 mg/L) (Zhai et al., 2000). Consistent with this, we found no effect of increasing amounts of IgG (0, 20, or 200 mg/L) on the uptake of fluorescent albumin (Fig. 2B).
Baseline albumin excretion
All model parameter values were specified based on experimental data (Table 1), with the exception of Vmax values. To determine and , we fitted the model to the data of Weyer et al. (2011, 2018) as follows. Their results suggest that the fractional excretion of albumin (FEalb) in WT mice is around 3%, assuming a glomerular filtration rate (GFR) of 280 μL/min and a creatinine excretion of 0.4 mg/day (Meneton et al., 2000; Dunn et al., 2004). Relative to WT mice, albumin excretion was 22-fold higher in megalin/cubilin KO mice (Weyer et al., 2018), 8.5-fold higher in cubilin KO mice, and 15-fold higher in megalin KO mice (Weyer et al., 2011). Gene inactivation in KO mice was 85–92% efficient (Weyer et al., 2018).
Since knocking out megalin impacts endocytic pathway integrity and prevents cubilin-mediated endocytosis, we did not simulate albumin handling in megalin KO mice. We sought to find values of and that yield FEalb ~ 3% in WT mice, about 8.5 times higher (~ 25%) in cubilin KO mice, and about 22 times higher (~ 70%) in megalin/cubilin KO mice. In these KO simulations, the cubilin and megalin Vmax were reduced by 90% to account for partial inactivation (Weyer et al., 2018). With = 2.27 and = 6.28 fmol/s/mm2, the predicted FEalb was 3.05%, 25.3% and 73.2%, respectively (Table 2).
Table 2.
Predicted albumin uptake under normal filtration conditions
| Fractional excretion | Total uptake (mg/day) | % via cubilin | % via megalin | % via fluid phase | |
|---|---|---|---|---|---|
| Base case | 3.05 % | 0.823 | 74.9 | 25.0 | 0.12 |
| Cubilin KO (90%) | 25.3 % | 0.634 | 16.5 | 83.1 | 0.42 |
| Cubilin + megalin KO (90%) | 73.2 % | 0.227 | 61.5 | 36.6 | 1.9 |
| No cubilin | 30.6% | 0.589 | 0 | 99.5 | 0.50 |
| No megalin | 9.9% | 0.765 | 99.8 | 0 | 0.18 |
| No cubilin + no megalin | 99.4 % | 0.005 | 0 | 0 | 100 |
Albumin filtration equals 2 mg/L × 295 μL/min = 0.590 μg/min, or 0.848 mg/day.
Respective contributions of megalin vs cubilin under normal conditions
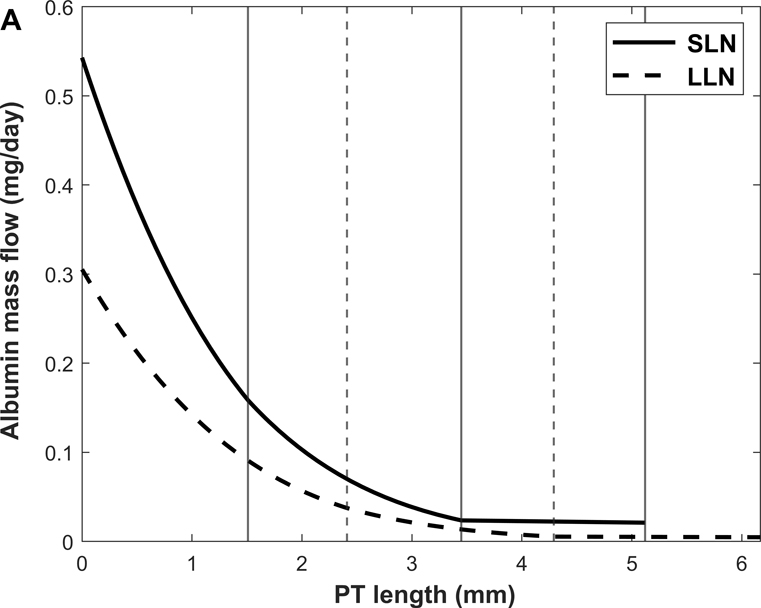
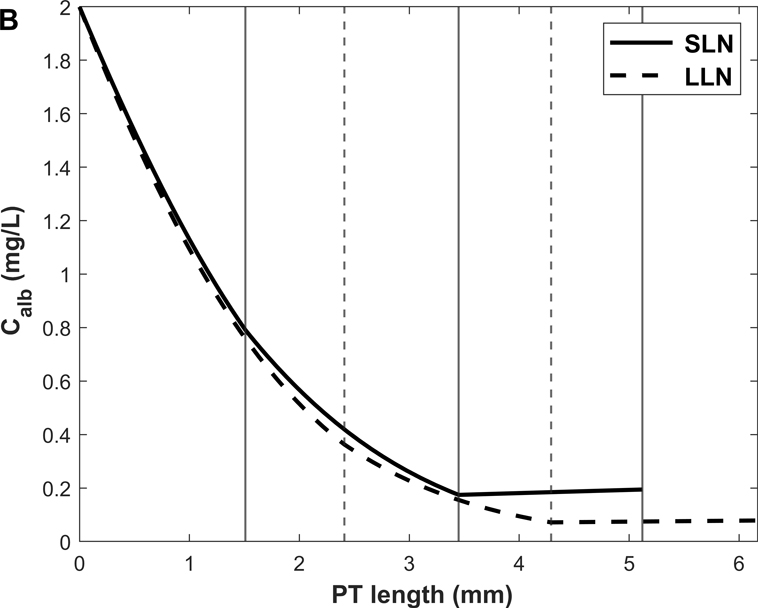
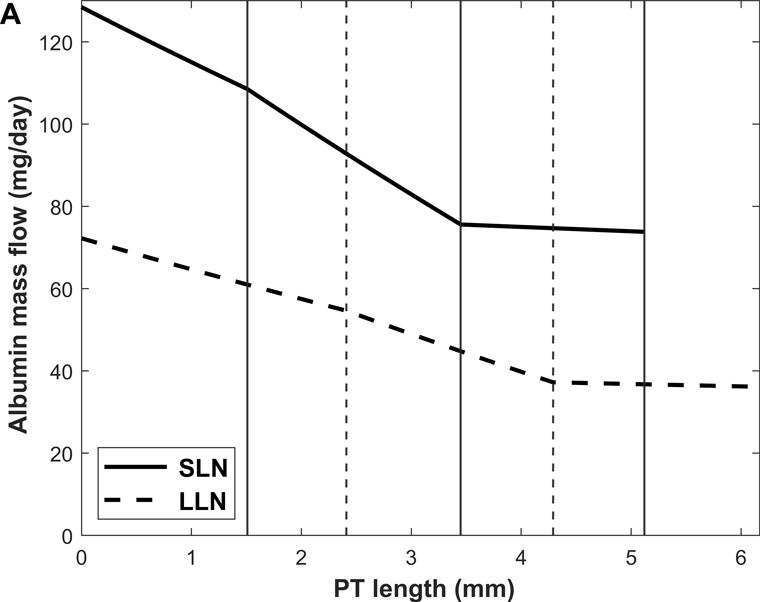
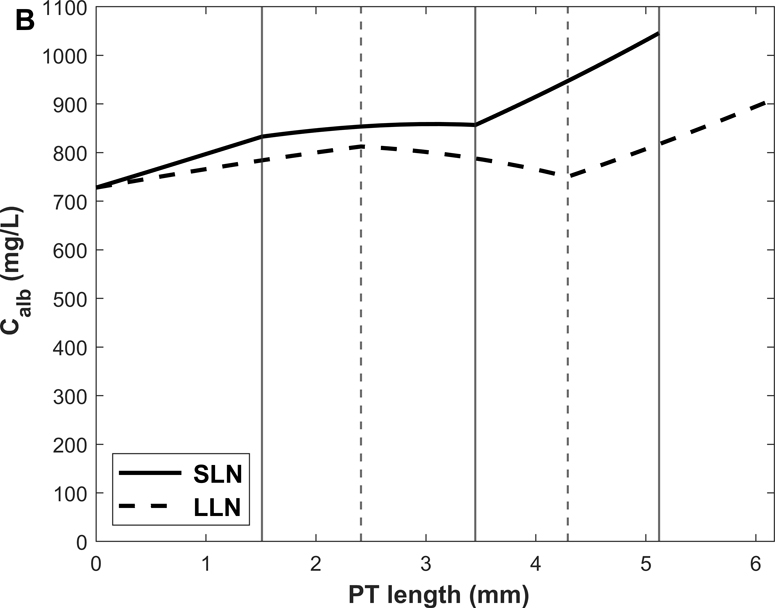
Predicted albumin mass flow and concentration profiles along short (SLN) and long (LLN) loop nephrons are shown in Fig. 3. The rate of albumin retrieval decreases along the PT and becomes almost negligible in S3: 79.3% of albumin is reabsorbed in S1, 20.3% in S2, and 0.4 % in S3 (Table 3). Since water reabsorption is faster than albumin uptake in S3, Calb is predicted to increase slightly along this sub-segment.
Figure 3.
Predicted albumin profiles under normal conditions: albumin mass flow (A) and albumin concentration (Calb) (B) in the PT lumen of short (SLN) and long (LLN) loop nephrons. The vertical lines denote the boundaries between S1-S2 and S2-S3 for SLN (solid lines) and LLN (dashed lines).
Table 3.
Predicted contributions of 3 pathways to albumin uptake under normal conditions
| Delivery | Uptake | Uptake via cubilin | Uptake via megalin | Uptake via fluid phase | |
|---|---|---|---|---|---|
| S1 | 0.848 | 0.653 | 0.520 | 0.132 | 0.0006 |
| S2 | 0.195 | 0.167 | 0.095 | 0.072 | 0.0004 |
| S3 | 0.028 | 0.003 | 0.001 | 0.002 | 0.0000 |
| Total | 0.025 (end of PT) | 0.823 | 0.616 | 0.206 | 0.0010 |
All values are in mg/day. Numbers in Table correspond to average of SLNs and LLNs assuming a 64:36 ratio.
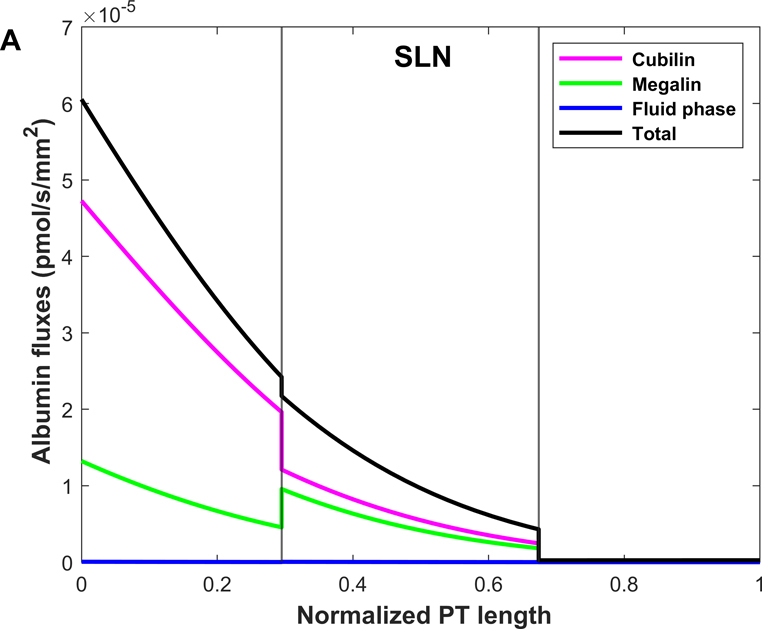
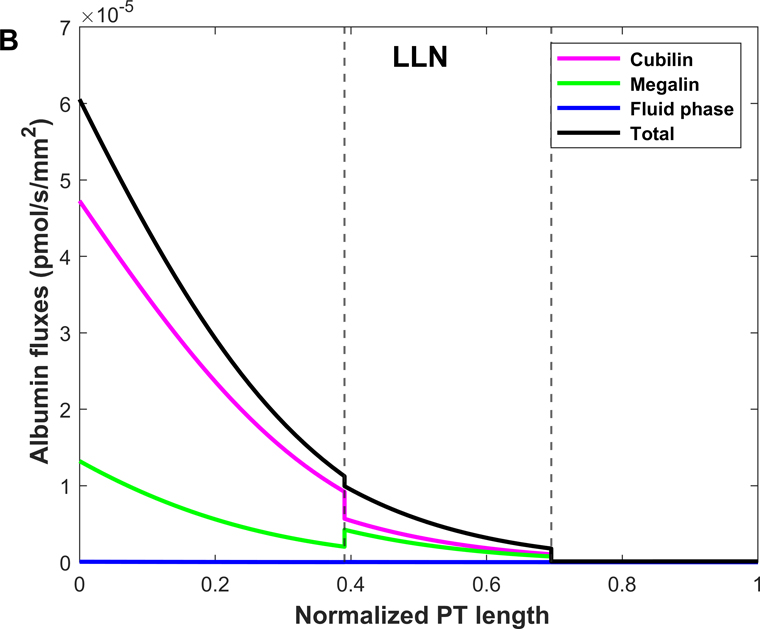
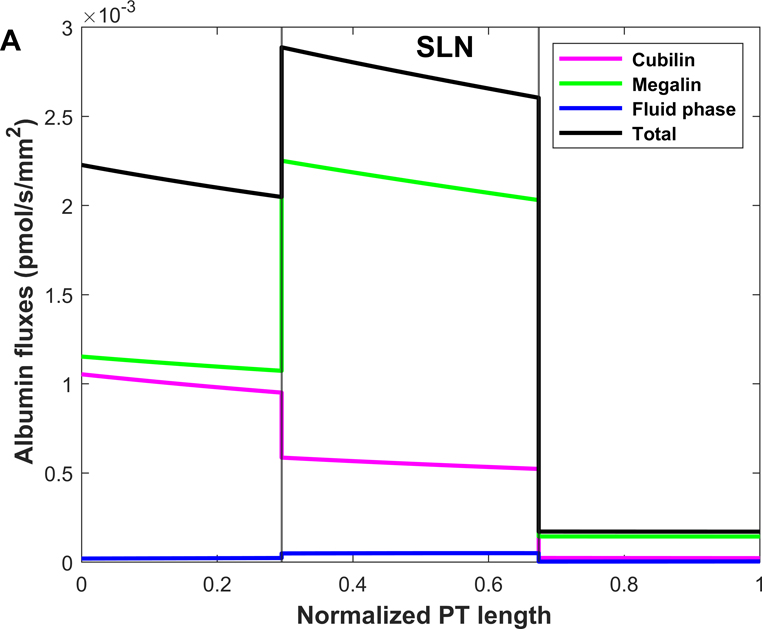
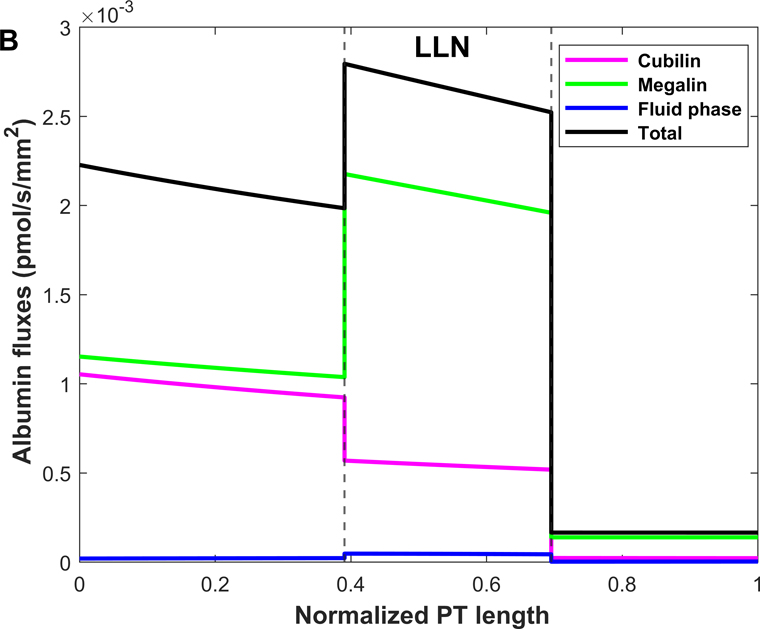
Shown in Fig. 4 are the fluxes of albumin across each pathway under normal conditions. The model predicts that overall, 74.9% of albumin is reabsorbed via cubilin, 25.0% via megalin, and 0.12% via fluid-phase uptake (Table 3). In S1, 4 times more albumin is reabsorbed via cubilin than via megalin, but the relative contributions of cubilin and megalin become similar in S2 and S3. Since LLNs have a longer S1 relative to SLNs (Christensen et al., 2021), they reabsorb more albumin via cubilin along the PT (77.5% in LLNs vs 73.4% in SLNs).
Figure 4.
Predicted albumin fluxes per nephron along SLN (A) and LLN (B) under normal conditions. The x-axis represents the axial coordinate divided by total PT length, and the vertical lines denote the boundaries between S1-S2 and S2-S3. The bulk of normally filtered albumin is retrieved in S1, via cubilin.
Albumin excretion in nephrotic mice
We then simulated the impact of nephrotic syndrome on the axial uptake of albumin, using parameters obtained from two nephrotic mouse models (Weyer et al., 2018; Butt et al., 2020). The concentration of albumin in the filtrate was computed as the product of plasma albumin (9.1 g/L) and the albumin sieving coefficient (0.08) in podocin KO mice (Weyer et al., 2018), that is, 728 mg/L, a 364-fold increase relative to its normal value (2 mg/L). We also assumed a 35% decrease in GFR (Butt et al., 2020).
As described in Methods, our model accounts for the effects of abundant plasma proteins that may affect albumin endocytosis, namely IgG and β2m. We assumed that the plasma concentration of IgG decreases 10-fold in nephrotic mice (Weyer et al., 2018), and that the sieving coefficient of IgG increases by a factor of 213, that is 5-fold less than that of albumin based on clearance data in nephrotic humans (Guasch et al., 1993; Blouch et al., 1997). With these hypotheses, the filtrate concentration of IgG was estimated as 2.1 mg/L. Since β2m is almost freely filtered under normal conditions, its concentration in the filtrate does not increase much in nephrotic mice; we set it equal to its plasma concentration, 1.5 mg/L. Decreases in GFR have been associated with increases in fractional water reabsorption (Landwehr et al., 1968). However, varying fw in our model has a small impact on model predictions (results not shown) so we maintained it constant.
Assuming no loss of nephrons, the single nephron GFR (SNGFR) was set equal to 65% its basal value. Absent changes in Vmax, the predicted excretion of albumin in nephrotic mice was 110 mg/day, a 4200-fold increase relative normal conditions, which is higher than the 3000-fold increase in podocin KO mice reported by Weyer et al. (2018). This discrepancy may be due in part to effects of glomerular dysfunction and heavy proteinuria on the expression or distribution of megalin/cubilin, as well as to challenges in reliably quantifying urinary albumin values (Weisz & Baty, 2018). Additionally, the extent to which GFR and SNGFR were impacted in podocin KO mice was not reported/is not known (see below).
Fig. 5 depicts the predicted variations in albumin mass flow and concentration along SLN and LLN, and shown in Fig. 6 are the corresponding fluxes of albumin across each pathway. Under nephrotic conditions, the concentration of albumin is > 10-fold- higher than its affinity to cubilin, and megalin-mediated endocytosis constitutes the predominant albumin uptake mechanism: 31.1% of albumin is reabsorbed via cubilin, 67.4% via megalin, and 1.5% via fluid-phase uptake. Since megalin expression is highest in S2, albumin uptake is highest in that segment as well: 41.4% of albumin is reabsorbed in S1, vs 55.5% in S2 and 3.1% in S3 (Table 4).
Figure 5.
Predicted albumin profiles under nephrotic conditions: albumin mass flow (A) and albumin concentration (B) in the PT lumen. The vertical lines denote the boundaries between S1-S2 and S2-S3 for SLN (solid lines) and LLN (dashed lines).
Figure 6.
Predicted albumin fluxes per nephron along SLN (A) and LLN (B) under nephrotic conditions. The x-axis represents the axial coordinate divided by total PT length, and the vertical lines denote the boundaries between S1-S2 and S2-S3. In the nephrotic state, the bulk of filtered albumin is retrieved in S2, via megalin.
Table 4.
Predicted contributions of 3 pathways to albumin uptake under nephrotic conditions
| Delivery | Uptake | Uptake via cubilin | Uptake via megalin | Uptake via fluid phase | |
|---|---|---|---|---|---|
| S1 | 200.7 | 37.6 | 17.6 | 19.6 | 0.39 |
| S2 | 75.7 | 50.3 | 10.2 | 39.2 | 0.91 |
| S3 | 42.8 | 2.9 | 0.4 | 2.4 | 0.06 |
| Total | 110.0 (end of PT) | 90.7 | 28.2 | 61.2 | 1.36 |
All values are in mg/day and based on a 35% decrease in GFR. Numbers in table correspond to average of SLNs and LLNs assuming a 64:36 ratio.
Determinants of uptake capacity
A key determinant of uptake capacity is the maximum reabsorption rate via cubilin and megalin, the only fitted parameter in this model. To examine the sensitivity of our predictions to this parameter, we assessed the impact of varying Vmax on model predictions. Because megalin and cubilin are believed to traffic coordinately, in this analysis we adjusted Vmax to the same extent for both receptors. Our results indicate that Vmax would have to be at least 8 times lower than our baseline value for the majority of albumin to be retrieved in S2 (as opposed to S1) under normal conditions. Conversely, Vmax would have to be at least 2.6 times higher than our baseline value for the majority of albumin to be retrieved in S1 (as opposed to S2) under nephrotic conditions.
In addition to receptor membrane abundance, uptake capacity is also a function of filtrate concentration and fluid flow. To further assess the robustness of our qualitative predictions, we examined the impact of filtrate concentration and GFR on albumin uptake under nephrotic conditions. Whereas fluid-phase uptake increases in direct proportion to filtrate concentration, receptor-mediated endocytosis eventually becomes concentration-independent and reaches a plateau. In our model, receptor-mediated endocytosis becomes saturated when the filtrate concentration of albumin is increased 10 times above its baseline value of 728 mg/L (nephrotic conditions). Under these supra-pathologic conditions, more albumin is retrieved in S2 via the fluid phase (12.8 mg/day) than via cubilin (10.9 mg/day), and fluid phase accounts for 14% of total uptake (Table 5).
Table 5.
Sensitivity of predicted albumin uptake under nephrotic conditions to model parameters
| Filtration (mg/day) | Fractional excretion | Total uptake (mg/day) | % via S1 | % via S2 | % via S3 | |
|---|---|---|---|---|---|---|
| Impact of GFR | ||||||
| No decrease in GFR | 308.8 | 65.2% | 107.3 31.0% via cubilin, 67.6% via megalin, 1.4% via fluid-phase |
41.8 | 55.1 | 3.1 |
| 35% decrease in GFR | 200.7 | 54.8% | 90.7 31.1% via cubilin, 67.4% via megalin, 1.5% via fluid-phase |
41.4 | 55.5 | 3.1 |
| 50% decrease in GFR | 154.4 | 46.2% | 83.0 31.3% via cubilin, 67.2% via megalin, 1.5% via fluid-phase |
41.4 | 55.4 | 3.2 |
| Impact of filtrate concentration | ||||||
| 10-fold increase in filtrate concentration* | 2007 | 93.5% | 129.5 23.3% via cubilin, 62.6% via megalin, 14.1% via fluid-phase |
38.0 | 58.4 | 3.6 |
| Direct contribution of receptors | ||||||
| No cubilin* | 200.7 | 67.8% | 64.6 97.6% via megalin, 2.4% via fluid-phase |
31.3 | 64.6 | 4.0 |
| No megalin* | 200.7 | 85.0% | 30.1 94.4% via cubilin, 5.6% via fluid-phase |
60.0 | 38.3 | 1.7 |
| No cubilin, no megalin* | 200.7 | 99.1% | 1.9 100% via fluid-phase |
23.0 | 70.9 | 6.1 |
Assuming a 35% decrease in GFR.
The extent to which the GFR decreases in nephrotic mice will vary with disease model and the progression of kidney injury. In the simulations above, we assumed a 35% decrease. Here, we considered 2 other scenarios: no change or a 50% decrease in GFR. Corresponding results, shown in Table 5, indicate that the fractional uptake of albumin via cubilin and megalin does not vary by more than 0.5% in these other cases. In other words, our prediction that the bulk of albumin uptake shifts towards S2 and megalin under nephrotic conditions is not sensitive to assumed GFR values.
Direct contributions of cubilin and megalin
In the following simulations, we abolished the direct effect of binding to cubilin, megalin, or both on albumin uptake. Since the absence of megalin alters the integrity of the other uptake pathways, the megalin-mediated uptake component is impossible to determine experimentally.
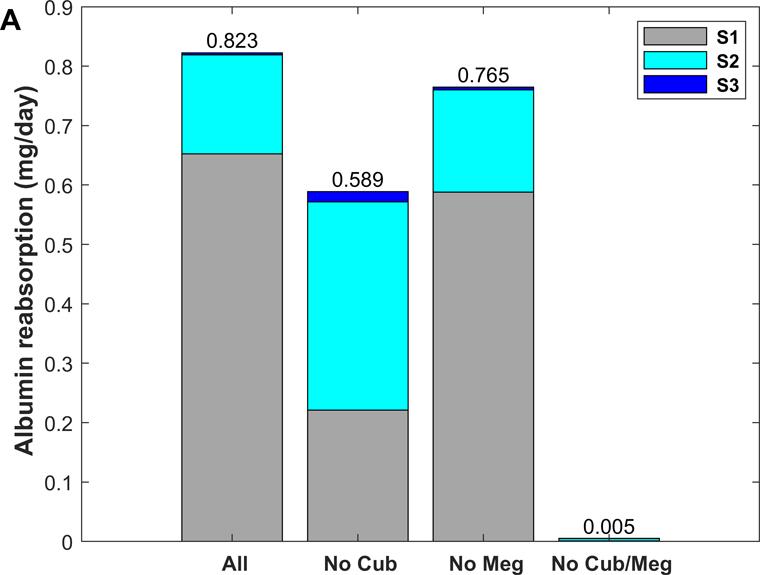
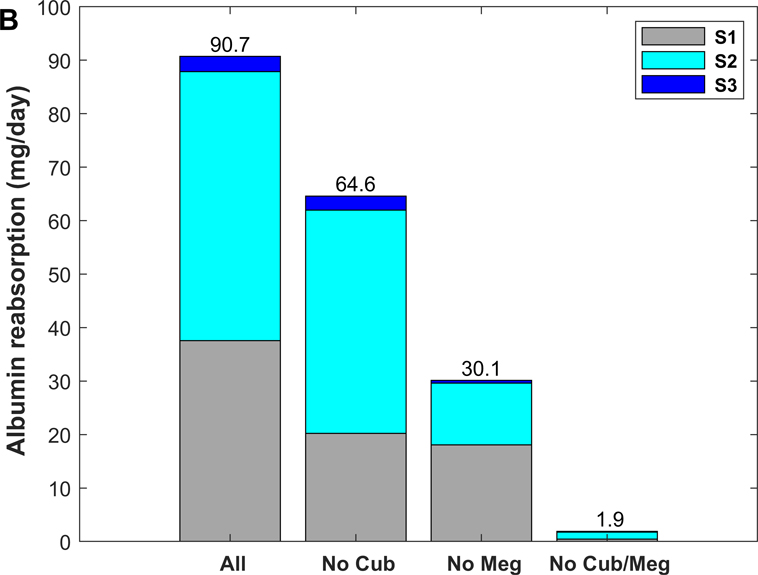
As shown in Fig. 7, without cubilin-mediated uptake, albumin retrieval is predicted to decrease by ~ 30%, as megalin-mediated uptake increases by ~ 0.4 (normal) and 2.0 (nephrotic) mg/day in compensation (Tables 2 and 5). Accordingly, the model predicts a large shift in albumin uptake from S1 towards mostly S2 (where megalin is more prominently expressed) under normal filtration conditions (Fig. 7A). This shift is less pronounced under nephrotic conditions (Fig. 7B), since S2 is already the sub-segment with the highest contribution when all three pathways are active.
Figure 7.
Predicted role of individual receptor components in albumin recovery, under normal (A) and nephrotic conditions (B): with all 3 pathways (“All”), without cubilin-mediated uptake (“No Cub”), without megalin-mediated uptake (“No Meg”), and without cubilin- and megalin-mediated uptake (“No Cub/Meg”).
Conversely, without megalin-mediated uptake, albumin uptake via cubilin increases only by ~ 0.2 mg/day under both conditions (Tables 2 and 5). In other words, the ability of cubilin to counterbalance the absence of megalin is negligible under nephrotic conditions.
When direct cubilin- and megalin-mediated endocytosis are both disabled, fluid-phase uptake increases 5-fold under normal conditions, and by ~40% under nephrotic conditions. The increase occurs mostly in S2, because of rising concentrations along the tubule. Under normal conditions, albumin uptake via fluid phase is predicted to be 3.5 times greater in S2 than in S1.
Axial uptake profile of other filtered proteins
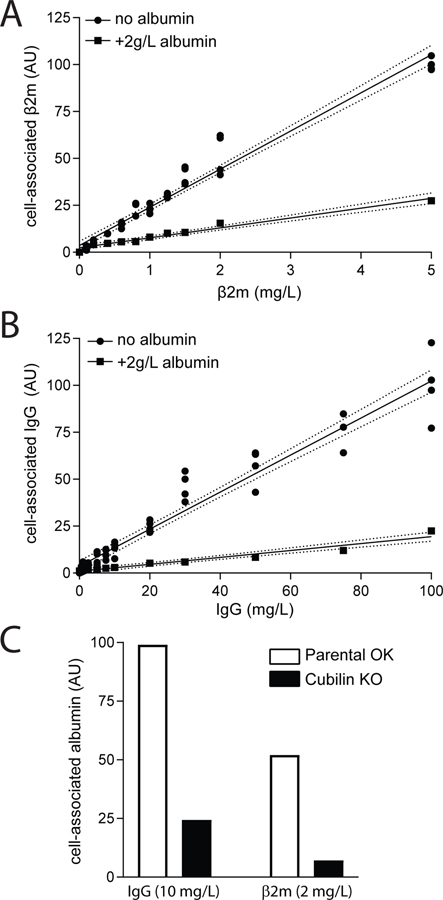
We measured concentration-dependent uptake of IgG and β2m to estimate their uptake affinities in order to predict the axial uptake profile of these two proteins under normal vs nephrotic conditions. The profiles we obtained for concentration-dependent uptake of β2M and IgG by OK cells is consistent in both cases with the presence of a single low-affinity, high-capacity site for uptake of these ligands (Fig. 8A–B). Although β2m and IgG have been reported to bind weakly to megalin (Leheste et al., 1999; Bryniarski et al., 2021), we found that in both cases, ligand uptake was dramatically blunted in CRISPR/Cas9 Cubn knockout OK cells (Fig. 8C). The contribution of fluid phase uptake was estimated by inclusion of 2 g/L albumin as a competitive inhibitor. For β2m, no saturation was observed at up to 5 mg/L (>3-fold the estimated serum concentration) (Fig. 8A), which is consistent with the Km value of 4.6 mg/L reported by Leheste et al. (1999). For IgG, uptake was linear at concentrations up to 100 mg/L, well above the estimated nephrotic tubular concentration of 10 mg/L (Fig. 8B). To quantify inhibition by albumin, we used concentrations of albumin consistent with normally-filtered levels (25 mg/L) and proteinuric conditions (375 mg/L and 750 mg/L), and measured the effect on uptake of β2m (0.6mg/L, 2mg/L, and 5 mg/L) or IgG (0.5 mg/L, 10mg/L, and 100 mg/L). Whereas even low concentrations of albumin (25 mg/L) significantly inhibited IgG uptake, β2m was competed only by nephrotic concentrations of albumin (Fig. 9). These data are consistent with a previous study where albumin was demonstrated to inhibit the uptake of IgG by OK cells (Nagai et al., 2011).
Figure 8.
Dose dependent uptake of β2m and IgG in PT cells. OK cells cultured on transwell supports under orbital shear stress were incubated with the indicated concentrations of Alexa Fluor-647 conjugated (A) β2m or (B) IgG for 15 min at 37°C. Cells were solubilized and cell-associated fluorescence quantified (circles). Individual data from four samples in two independent experiments are plotted. The fluid phase uptake component was estimated by inclusion of 2 g/L albumin in one filter at each ligand concentration (squares). Linear regression (solid line) with 95% confidence interval (dashed lines) is consistent with linear uptake across the concentration range tested (R2 = 0.963 and 0.941 for β2m and IgG, respectively). (C) Control (white bars) or CRISPR/Cas9 Cubn KO OK cells (black bars) were incubated as above with 2 mg/L β2m or 10 mg/L IgG and cell-associated fluorescence was quantified. Data from an individual point for each condition normalized to the IgG control are plotted for simplicity; however, comparable results were obtained using several other conditions for each ligand.
Figure 9.
Albumin inhibition profile of β2m and IgG in PT cells. OK cells cultured on transwell supports under orbital shear stress were incubated with the indicated concentrations of Alexa Fluor-647 conjugated (A) β2m or (B) IgG and 0, 25, 375, or 750 mg/L albumin for 15 min at 37°C. Cells were solubilized and cell-associated fluorescence quantified.
Based on the results of Fig. 8 and previous findings (Leheste et al., 1999), the affinity of cubilin to β2m was set to 4.6 mg/L (420 nM) and that to IgG was set to100 mg/L (625 nM) in the computational model. To verify that these assumptions are consistent with the remainder of our data, we ran simulations to mimic the competition experiments (Figs. 2 and 9). Model predictions reproduced the experimental data very well (results not shown).
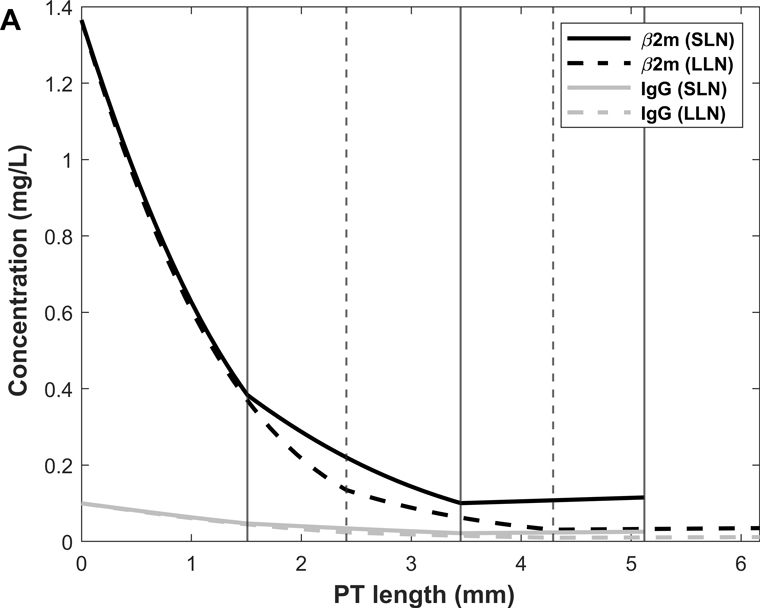
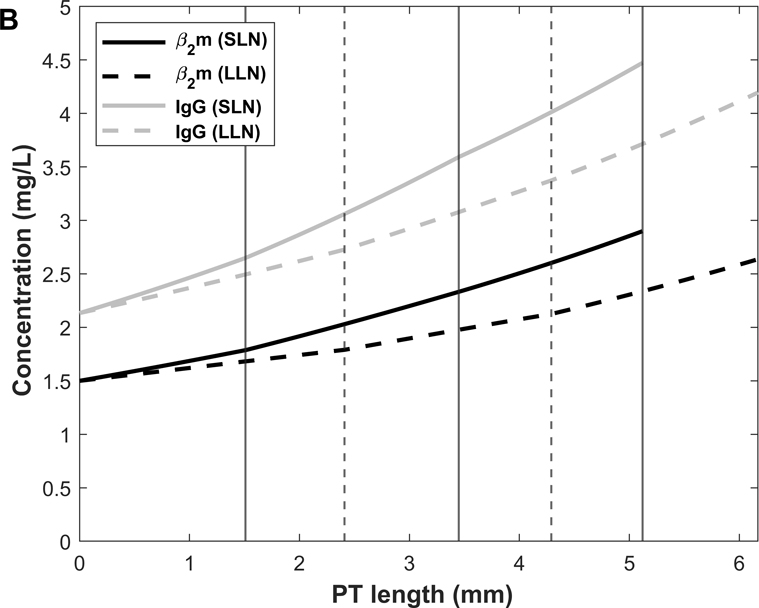
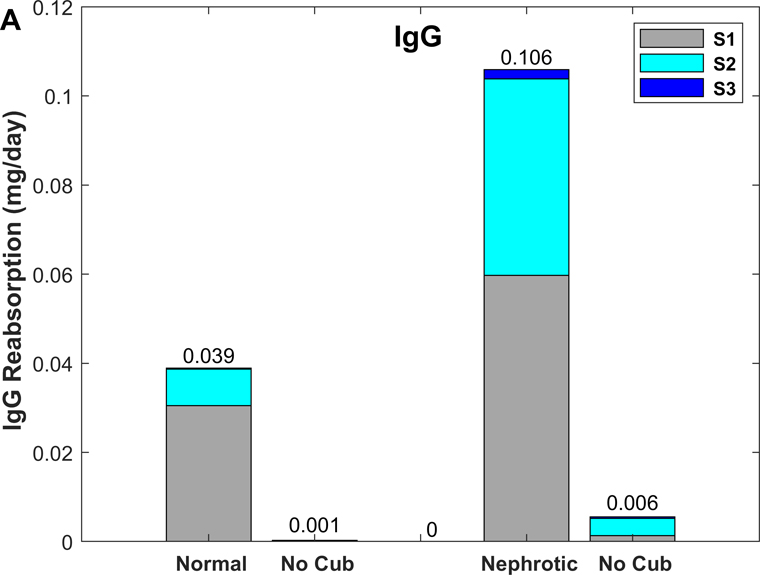
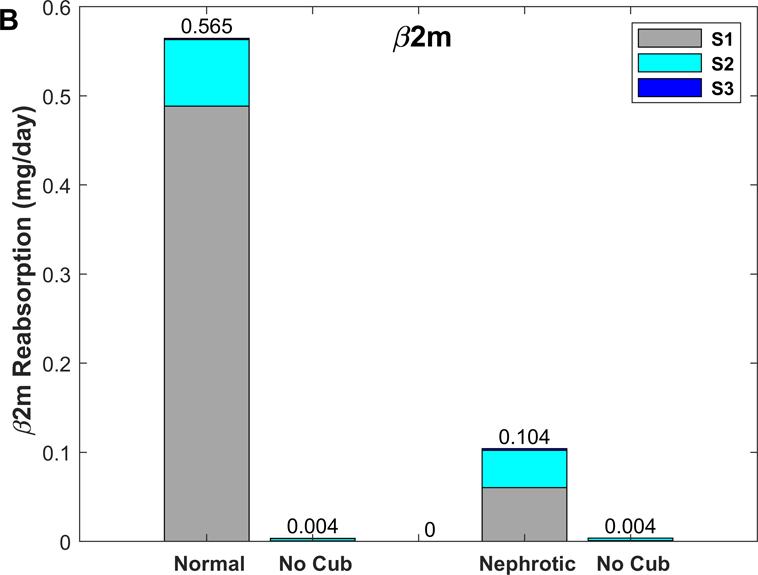
We then used the model to examine the spatial distribution of β2m and IgG uptake along the PT. Predicted β2m and IgG concentration profiles in normal and nephrotic conditions are shown in Fig. 10. Note that the amount of filtered β2m decreases under the nephrotic conditions we examined, because the filtrate concentration increase (10%) is smaller than the GFR decrease (35%). The predicted fractional excretions of β2m and IgG are, respectively, 2.5% and 8.2% in normal conditions, and 74.8% and 82.0% in nephrotic conditions (Table 6). The contribution of fluid-phase uptake is < 0.5% in normal conditions and increases to 3–5% under nephrotic conditions. In the latter case, uptake via cubilin is predicted to be slower than water reabsorption, hence the increase in ligand concentration along the PT (Fig. 10B). As shown in Fig. 11, 80–85% of β2m and IgG are reabsorbed in S1 in normal conditions, versus 15–20% in S2 and < 1% in S3 (Table 6). The contribution of S2 becomes larger (~ 40%) in nephrotic conditions (Fig. 11).
Figure 10.
Predicted IgG and β2m concentrations along the PT lumen under normal (A) and nephrotic (B) conditions. The vertical lines denote the boundaries between S1-S2 and S2-S3 for SLN (solid lines) and LLN (dashed lines).
Table 6.
Predicted uptake of IgG and β2m in the proximal tubule
| Filtration (mg/day) | FE (%) | Uptake (mg/day) (% via cubilin) | % via S1 | % via S2 | % via S3 | |
|---|---|---|---|---|---|---|
| IgG | ||||||
| Normal | 0.042 | 8.2% | 0.039 (99.8%) | 78.4 | 21.1 | 0.5 |
| Nephrotic | 0.588 | 82.0% | 0.106 (95.4%) | 56.3 | 41.7 | 2.0 |
| β2m | ||||||
| Normal | 0.579 | 2.5% | 0.565 (99.9%) | 86.5 | 13.3 | 0.2 |
| Nephrotic | 0.414 | 74.8% | 0.104 (96.9%) | 57.9 | 40.2 | 1.8 |
Figure 11.
Predicted uptake of IgG (A) and β2m (B) under normal and nephrotic conditions, with and without cubilin-mediated uptake.
We also examined the effects of abolishing cubilin-mediated uptake. In the absence of cubilin, the urinary excretion of IgG and β2m is predicted to increase by a factor of 12 and 39, respectively, under normal conditions (vs 10-fold for albumin). Under nephrotic conditions, abolishing cubilin-mediated uptake is predicted to raise the urinary excretion of IgG and β2m by 20–30% (vs 24% for albumin). Without cubilin-mediated uptake, fluid-phase endocytosis of IgG and β2m is predicted to increase 4- to 7-fold (0.06 to 0.26 μg/day for IgG, 0.5 to 3.5 μg/day for β2m) under normal conditions, and by 0.6–0.7 μg/day (4.9 to 5.5 μg/day for IgG, 3.2 to 3.9 μg/day for β2m) under nephrotic conditions. Thus, the capacity of fluid-phase endocytosis is also limited for IgG and β2m.
DISCUSSION
The model described herein predicts the rates of albumin uptake across three distinct pathways in the mouse PT, in normal and nephrotic states. It includes quantitative proteomic data (Limbutara et al., 2020) to estimate receptor abundance, data from OK cells to estimate receptor-specific affinity values (Ren et al., 2020), as well as data from KO models to distinguish between the contributions of megalin vs cubilin in vivo (Weyer et al., 2011; Weyer et al., 2018). It includes moreover new estimates of binding affinity and measurements of competitive inhibition for abundant serum/filtrate proteins. We have also compared the normal and nephrotic axial uptake profile of albumin with that of other proteins with distinct sieving coefficients and binding affinities for cubilin. To our knowledge, this is the first mathematical model to reveal subsegment-specific contributions to albumin uptake along the PT.
Our model reveals several striking differences in the recovery of albumin between normal and nephrotic conditions. Under normal conditions, the majority of albumin is recovered in the S1 segment, consistent with the rapid uptake in the early PT predicted in previous models of albumin recovery in human and mouse kidney (Lazzara & Deen, 2007; Gliozzi et al., 2020; Edwards et al., 2021). By contrast, under nephrotic conditions, albumin is recovered primarily in the S2 segment. This shift in axial recovery reflects both the high concentration of ligand that enters this segment and the relative abundance of megalin, which mediates low-affinity, high-capacity uptake of albumin. Thus, while 74.9% of normally filtered albumin is reabsorbed via cubilin, megalin-mediated recovery accounts for 67.4% of recovery under the nephrotic conditions we modeled. This observation is consistent with previous experimental data in nephrotic mice that demonstrates a preferential requirement for megalin vs cubilin expression in the uptake of albumin (Ren et al., 2020). Additionally, the data are generally consistent with the description of a “reserve” recovery pathway for filtered retinol binding protein 4 and β2m in nephrotic mouse kidneys (Christensen et al., 2021). Finally, the dearth of uptake in S3 segments that we modeled is consistent with the paucity of endocytic compartments described in ultrastructural studies of this segment (Christensen et al., 2012b; Christensen et al., 2021). Rigorously controlled imaging studies to quantify the axial distribution of internalized albumin and other filtered ligands in PT nephron sub-segments under nephrotic compared with normal conditions are needed to verify our predictions.
This model provides a kinetic rationale for why proteinuria stemming from a tubular defect (such as in Dent disease, Lowe syndrome, or cubilin KO) can occur when normally-filtered levels of albumin are inefficiently recovered even though there is a large excess in potential PT uptake capacity. Uptake capacity depends on amount of ligand, binding kinetics, and receptor abundance. At low albumin concentrations, uptake is rate-limited by the rate at which ligands bind to their receptors (specifically, by the concentration-to-affinity ratio). At high (nephrotic) albumin concentrations, binding sites approach saturation and uptake becomes rate-limited by receptor abundance. This explains why uptake can increase >25-fold under nephrotic conditions: as albumin concentration increases, binding kinetics cease to be rate-limiting; eventually, the availability of binding sites becomes the determining factor.
In proteinuria stemming from a glomerular defect, our model suggests that drugs that lower GFR, such as calcineurin inhibitors, may reduce the absolute urinary excretion of albumin to a greater extent than the reduction in GFR, all else remaining constant. As shown in Table 5, a 35% decrease in GFR in nephrotic mice is predicted to reduce albumin excretion from 202 mg/day to 110 mg/day, a 45% decrease. This discoordinated effect occurs because reducing the (single nephron) GFR increases solute residence time in the tubule and enhances uptake, and it may contribute to the efficacy of such drugs.
Our simulations also enabled us to estimate the contribution of fluid-phase uptake to the recovery of albumin and other filtered ligands. While PT cells do not have a dedicated endocytic pathway for fluid-phase uptake, a significant volume of fluid is expected to accompany the robust membrane internalization observed in rat PT (Birn et al., 1993) and which was estimated in OK cells to represent 0.6% of the cell volume/min (Gekle et al., 1995). Fluid-phase uptake was suggested to represent a major pathway for retrieval of high concentrations of albumin in microdissected rabbit nephrons (Park & Maack, 1984). Moreover, quantitation of dextran internalized by PT cells after injection in mice revealed an ~7-fold increase in the relative uptake of this fluid-phase marker in S2 segments of the PT compared with S1 (Fig. 1), suggesting the possibility of robust concentration-dependent salvage of albumin via this pathway. While these observations led us to suggest the possibility that recovery of concentrated albumin in the fluid-phase might contribute significantly to albumin retrieval in nephrotic conditions (Weisz, 2021), our model here shows that receptor-mediated rather than fluid-phase uptake accounts for the vast majority of ligand recovery. Only 0.12% of normally-filtered albumin was taken up in the fluid phase, and this increased to 1.5% under nephrotic conditions. In terms of total mass, the fluid-phase component of albumin uptake under the nephrotic conditions we modeled (1.36 mg/day) is slightly higher than total albumin uptake under normal conditions (0.82 mg/day). Whether the dramatic increase in retrieval of dextran we observed in S2 compared with S1 segments reflects a more robust endocytic pathway due to higher megalin expression and/or a dramatic increase in concentration remains to be determined.
While the direct contribution of megalin receptors to albumin retrieval is impossible to determine experimentally, we were able to evaluate the relative contributions of cubilin vs megalin receptors on axial uptake of albumin using our model. Strikingly, knockout of cubilin is predicted to shift the bulk of albumin uptake from S1 to S2 (Fig. 7), a prediction that may be testable by quantitative imaging studies in mouse models. In addition, the direct effects of megalin on normal albumin endocytosis are predicted to be relatively small, in contrast with the very substantial impact of knocking-down megalin (Weyer et al., 2011).
Our model distinguishes between SLNs and LLNs by considering their differences in length. As such, it predicts only small variations in their handling of albumin, such as higher concentrations at the exit in SLNs vs LLNs (Figs. 3 and 5). Recent topographic studies of mouse kidney nephrons revealed three general arrangements of PTs differing in their positioning, length, and tortuosity (Blanc et al., 2021). Further studies that enable discrimination and quantitation of nephron sub-segments within each group may provide additional variables that can be included in later expansions of this model.
Importantly, our studies also highlight the differences in axial uptake patterns of different ligands. Concentration-dependent studies of IgG and β2m endocytosis in OK cells were consistent with a single binding site for ligand uptake under physiologic and pathophysiologic conditions. Notably, uptake of both ligands was reduced drastically in Cubn KO cells, suggesting that their internalization is mediated primarily by CUBAM receptors. Moreover, uptake of β2m and IgG was significantly inhibited by physiologically-relevant concentrations of albumin, while neither ligand significantly impaired the uptake of albumin. Because of the heavy reliance on cubilin for uptake, predicted β2m and IgG axial recovery profiles qualitatively resemble that of albumin under normal conditions. However, while the contribution of S2 to ligand retrieval is more significant under nephrotic conditions, it is not dominant for IgG and β2m (as it is for albumin), since cubilin is more heavily expressed in S1. As a consequence, the concentration of both ligands is predicted to steadily increase along the PT axis under nephrotic conditions (Fig. 10). Though technically challenging, this could potentially be tested experimentally by micropuncture. Despite the increase in ligand concentration, the contribution of fluid-phase uptake to overall recovery remains small (<5% of total; Table 6).
We should note that our mouse model predicts that the fractional excretions of β2m and albumin are comparable (2.5% vs 3.0%). In contrast, data from Dent1 patients suggest that the fractional excretion of β2m may be 50 times lower than that of albumin (Edwards et al., 2021). This discrepancy could mean that our model assumes incorrect β2m affinity values and/or does not account for all existing β2m uptake pathways. Additional experimental data in a variety of mouse and cell models may help resolve these questions.
As with any model of kidney function, ours is limited by the challenges in obtaining quantitative data from human and animal studies. While many of the parameters for our model were obtained from measurements in mice, in some cases only data from rats or humans were available. To assign expression values for megalin, cubilin, and Dab2 to PT sub-segments, we utilized quantitative proteomic data from microdissected rat nephrons (Limbutara et al., 2020) rather than RNASeq data from microdissected mouse tubules (Chen et al., 2021). However, comparison of the transcriptomic profiles between the two species (Lee et al., 2015; Chen et al., 2021) suggests that megalin mRNA levels in mouse S2 segments are comparable to those of S1 in mouse PT, whereas they are higher in S2 vs S1 in the rat. Owing to the paucity of available data in mice, our model also assumes that SLNs and LLNs vary only in terms of their length. The heterogeneity in orientation and tortuosity of individual nephrons observed in recent studies using cleared and microdissected tissues suggest additional variations between uptake profiles in SLNs vs LLNs that we cannot yet account for (Woodhall et al., 1978; Schuh et al., 2018; Blanc et al., 2021). This may include variations in fluid reabsorption that could have significant effects on ligand uptake in our model.
In addition to variations in tubular water transport, intravital studies reveal considerable nephron-to-nephron variability in filtration rate (Peti-Peterdi et al., 2015). Furthermore, there is significant variability in the severity of disease within and between mouse models of nephrosis that prevents definitive assignment of SNGFR among other variables. This variability may be due in part to the influence of protein casts and fibrosis on hydrodynamics, as well as to signaling and inflammatory responses as kidney disease progresses. Our model also does not account for possible changes in axial endocytic capacity as disease progresses. Megalin, cubilin, and Dab2 expression have been shown to vary temporally or spatially during disease progression, and differential effects on transcription of these proteins or changes in other components that drive ligand uptake could impact our model (Liu et al., 2015; Christensen et al., 2021). Such changes may contribute to the uptake of β2m observed in the S3 segments of cystinotic mice and in podocin KO mice (Gaide Chevronnay et al., 2014; Christensen et al., 2021).
Our model represents a useful starting point to explain the remarkable ability of the PT to accommodate wide variations in filtered protein load. Some predictions of our model as noted above can be experimentally tested to confirm our assumptions. Additionally, the increasing availability of data from human patients and proteinuric disease animal models (Ma et al., 2016; Bedin et al., 2020), as well as advancements in quantitative approaches to measure uptake of filtered proteins in vivo (Martins et al., 2021) can be used to further refine our model of albumin uptake and expand it to include a broader spectrum of ligands.
Supplementary Material
KEY POINTS.
We used new and published data to develop a mathematical model that predicts the profile of albumin uptake in the mouse proximal tubule (PT) in normal and nephrotic states, and partially accounts for competitive inhibition of uptake by normally filtered and pathologic ligands.
Three pathways, consisting of high-affinity uptake by cubilin receptors, low-affinity uptake by megalin receptors, and fluid phase uptake, contribute to the overall retrieval of filtered proteins.
The axial profile and efficiency of protein uptake depend on the initial filtrate composition and the individual protein affinities for megalin and cubilin.
Under normal conditions, the majority of albumin is retrieved in S1 but shifts to S2 under nephrotic conditions. Other proteins exhibit different uptake profiles.
Our model explains how tubular proteinuria can occur despite a large excess in potential PT uptake capacity.
Acknowledgments
We thank Dr. Ossama Kashlan for helpful discussions.
Funding
R01-DK118726 (OAW), R01-DK125049 (OAW), S10-OD021627 (OAW), NIH F31DK121394 (KES), and the Pittsburgh Center for Kidney Research (P30 DK079307).
Non-standard abbreviations:
- β2m
beta-2 microglobulin
- GFR
glomerular filtration rate
- LLN
long loop nephron
- PT
proximal tubule
- SLN
short loop nephron
- SNGFR
single nephron glomerular filtration rate
Biography

Aurélie Edwards is a Research Professor in Biomedical Engineering at Boston University. Her research focuses on solute transport mechanisms and regulation in the kidney. Current areas of interest include lifecycle adaptations in renal transporter profiles to maintain homeostasis, and the mechanisms underlying proteinuria.
Footnotes
Competing Interests
The authors report no conflict of interest in connection with this article.
Contributor Information
Aurélie Edwards, Department of Biomedical Engineering, Boston University, Boston, MA 02215, USA..
Kimberly R. Long, Renal-Electrolyte Division, Department of Medicine, University of Pittsburgh School of Medicine, Pittsburgh, PA 15261, USA.
Catherine J. Baty, Renal-Electrolyte Division, Department of Medicine, University of Pittsburgh School of Medicine, Pittsburgh, PA 15261, USA.
Katherine E. Shipman, Renal-Electrolyte Division, Department of Medicine, University of Pittsburgh School of Medicine, Pittsburgh, PA 15261, USA.
Ora A. Weisz, Renal-Electrolyte Division, Department of Medicine, University of Pittsburgh School of Medicine, Pittsburgh, PA 15261, USA.
Data availability statement
Not applicable.
REFERENCES
- Bedin M, Boyer O, Servais A, Li Y, Villoing-Gaude L, Tete MJ, Cambier A, Hogan J, Baudouin V, Krid S, Bensman A, Lammens F, Louillet F, Ranchin B, Vigneau C, Bouteau I, Isnard-Bagnis C, Mache CJ, Schafer T, Pape L, Godel M, Huber TB, Benz M, Klaus G, Hansen M, Latta K, Gribouval O, Moriniere V, Tournant C, Grohmann M, Kuhn E, Wagner T, Bole-Feysot C, Jabot-Hanin F, Nitschke P, Ahluwalia TS, Kottgen A, Andersen CBF, Bergmann C, Antignac C & Simons M. (2020). Human C-terminal CUBN variants associate with chronic proteinuria and normal renal function. J Clin Invest 130, 335–344. [DOI] [PMC free article] [PubMed] [Google Scholar]
- Birn H, Christensen EI & Nielsen S. (1993). Kinetics of endocytosis in renal proximal tubule studied with ruthenium red as membrane marker. Am J Physiol 264, F239–250. [DOI] [PubMed] [Google Scholar]
- Blanc T, Goudin N, Zaidan M, Traore MG, Bienaime F, Turinsky L, Garbay S, Nguyen C, Burtin M, Friedlander G, Terzi F & Pontoglio M. (2021). Three-dimensional architecture of nephrons in the normal and cystic kidney. Kidney Int 99, 632–645. [DOI] [PubMed] [Google Scholar]
- Blouch K, Deen WM, Fauvel JP, Bialek J, Derby G & Myers BD. (1997). Molecular configuration and glomerular size selectivity in healthy and nephrotic humans. Am J Physiol 273, F430–437. [DOI] [PubMed] [Google Scholar]
- Bryniarski MA, Zhao B, Chaves LD, Mikkelsen JH, Yee BM, Yacoub R, Shen S, Madsen M & Morris ME. (2021). Immunoglobulin G Is a Novel Substrate for the Endocytic Protein Megalin. AAPS J 23, 40. [DOI] [PubMed] [Google Scholar]
- Butt L, Unnerso-Jess D, Hohne M, Edwards A, Binz-Lotter J, Reilly D, Hahnfeldt R, Ziegler V, Fremter K, Rinschen MM, Helmstadter M, Ebert LK, Castrop H, Hackl MJ, Walz G, Brinkkoetter PT, Liebau MC, Tory K, Hoyer PF, Beck BB, Brismar H, Blom H, Schermer B & Benzing T. (2020). A molecular mechanism explaining albuminuria in kidney disease. Nat Metab 2, 461–474. [DOI] [PubMed] [Google Scholar]
- Chen L, Chou CL & Knepper MA. (2021). A Comprehensive Map of mRNAs and Their Isoforms across All 14 Renal Tubule Segments of Mouse. J Am Soc Nephrol 32, 897–912. [DOI] [PMC free article] [PubMed] [Google Scholar]
- Christensen EI, Birn H, Storm T, Weyer K & Nielsen R. (2012a). Endocytic receptors in the renal proximal tubule. Physiology (Bethesda) 27, 223–236. [DOI] [PubMed] [Google Scholar]
- Christensen EI, Kristoffersen IB, Grann B, Thomsen JS, Andreasen A & Nielsen R. (2021). A well-developed endolysosomal system reflects protein reabsorption in segment 1 and 2 of rat proximal tubules. Kidney International 99, 841–853. [DOI] [PubMed] [Google Scholar]
- Christensen EI, Wagner CA & Kaissling B. (2012b). Uriniferous tubule: structural and functional organization. Compr Physiol 2, 805–861. [DOI] [PubMed] [Google Scholar]
- Clark JZ, Chen L, Chou C-L, Jung HJ, Lee JW & Knepper MA. (2019). Representation and relative abundance of cell-type selective markers in whole-kidney RNA-Seq data. Kidney International 95, 787–796. [DOI] [PMC free article] [PubMed] [Google Scholar]
- Dachy A, Paquot F, Debray G, Bovy C, Christensen EI, Collard L & Jouret F. (2015). In-depth phenotyping of a Donnai-Barrow patient helps clarify proximal tubule dysfunction. Pediatr Nephrol 30, 1027–1031. [DOI] [PubMed] [Google Scholar]
- Drueke TB & Massy ZA. (2009). Beta2-microglobulin. Semin Dial 22, 378–380. [DOI] [PubMed] [Google Scholar]
- Dunn SR, Qi Z, Bottinger EP, Breyer MD & Sharma K. (2004). Utility of endogenous creatinine clearance as a measure of renal function in mice. Kidney Int 65, 1959–1967. [DOI] [PubMed] [Google Scholar]
- Edwards A, Christensen EI, Unwin RJ & Norden AGW. (2021). Predicting the protein composition of human urine in normal and pathological states: Quantitative description based on Dent1 disease (CLCN5 mutation). J Physiol 599, 323–341. [DOI] [PubMed] [Google Scholar]
- Eshbach ML & Weisz OA. (2017). Receptor-Mediated Endocytosis in the Proximal Tubule. Annual Review of Physiology 79, 425–448. [DOI] [PMC free article] [PubMed] [Google Scholar]
- Gaide Chevronnay HP, Janssens V, Van Der Smissen P, N’Kuli F, Nevo N, Guiot Y, Levtchenko E, Marbaix E, Pierreux CE, Cherqui S, Antignac C & Courtoy PJ. (2014). Time course of pathogenic and adaptation mechanisms in cystinotic mouse kidneys. J Am Soc Nephrol 25, 1256–1269. [DOI] [PMC free article] [PubMed] [Google Scholar]
- Gekle M, Mildenberger S, Freudinger R & Silbernagl S. (1995). Endosomal alkalinization reduces Jmax and Km of albumin receptor-mediated endocytosis in OK cells. Am J Physiol 268, F899–906. [DOI] [PubMed] [Google Scholar]
- Gliozzi ML, Espiritu EB, Shipman KE, Rbaibi Y, Long KR, Roy N, Duncan AW, Lazzara MJ, Hukriede NA, Baty CJ & Weisz OA. (2020). Effects of Proximal Tubule Shortening on Protein Excretion in a Lowe Syndrome Model. J Am Soc Nephrol 31, 67–83. [DOI] [PMC free article] [PubMed] [Google Scholar]
- Guasch A, Deen WM & Myers BD. (1993). Charge selectivity of the glomerular filtration barrier in healthy and nephrotic humans. J Clin Invest 92, 2274–2282. [DOI] [PMC free article] [PubMed] [Google Scholar]
- Hashimoto S, Adams JW, Bernstein KE & Schnermann J. (2005). Micropuncture determination of nephron function in mice without tissue angiotensin-converting enzyme. Am J Physiol Renal Physiol 288, F445–452. [DOI] [PubMed] [Google Scholar]
- Honjo K, Kubagawa Y, Jones DM, Dizon B, Zhu Z, Ohno H, Izui S, Kearney JF & Kubagawa H. (2012). Altered Ig levels and antibody responses in mice deficient for the Fc receptor for IgM (FcmuR). Proc Natl Acad Sci U S A 109, 15882–15887. [DOI] [PMC free article] [PubMed] [Google Scholar]
- Ichii O, Yabuki A, Ojima T, Matsumoto M & Suzuki S. (2006). Rodent renal structure differs among species. J Vet Med Sci 68, 439–445. [DOI] [PubMed] [Google Scholar]
- Kalakeche R, Hato T, Rhodes G, Dunn KW, El-Achkar TM, Plotkin Z, Sandoval RM & Dagher PC. (2011). Endotoxin uptake by S1 proximal tubular segment causes oxidative stress in the downstream S2 segment. J Am Soc Nephrol 22, 1505–1516. [DOI] [PMC free article] [PubMed] [Google Scholar]
- Klein-Schneegans AS, Kuntz L, Fonteneau P & Loor F. (1989). Serum concentrations of IgM, IgG1, IgG2b, IgG3 and IgA in C57BL/6 mice and their congenics at the lpr (lymphoproliferation) locus. J Autoimmun 2, 869–875. [DOI] [PubMed] [Google Scholar]
- Kur E, Christa A, Veth KN, Gajera CR, Andrade-Navarro MA, Zhang J, Willer JR, Gregg RG, Abdelilah-Seyfried S, Bachmann S, Link BA, Hammes A & Willnow TE. (2011). Loss of Lrp2 in zebrafish disrupts pronephric tubular clearance but not forebrain development. Dev Dyn 240, 1567–1577. [DOI] [PMC free article] [PubMed] [Google Scholar]
- Landwehr DM, Schnermann J, Klose RM & Giebisch G. (1968). Effect of reduction in filtration rate on renal tubular sodium and water reabsorption. Am J Physiol 215, 687–695. [DOI] [PubMed] [Google Scholar]
- Lazzara MJ & Deen WM. (2007). Model of albumin reabsorption in the proximal tubule. Am J Physiol Renal Physiol 292, F430–439. [DOI] [PubMed] [Google Scholar]
- Lee JW, Chou CL & Knepper MA. (2015). Deep Sequencing in Microdissected Renal Tubules Identifies Nephron Segment-Specific Transcriptomes. J Am Soc Nephrol 26, 2669–2677. [DOI] [PMC free article] [PubMed] [Google Scholar]
- Leheste JR, Rolinski B, Vorum H, Hilpert J, Nykjaer A, Jacobsen C, Aucouturier P, Moskaug JO, Otto A, Christensen EI & Willnow TE. (1999). Megalin knockout mice as an animal model of low molecular weight proteinuria. Am J Pathol 155, 1361–1370. [DOI] [PMC free article] [PubMed] [Google Scholar]
- Letts RF, Zhai XY, Bhikha C, Grann BL, Blom NB, Thomsen JS, Rubin DM, Christensen EI & Andreasen A. (2017). Nephron morphometry in mice and rats using tomographic microscopy. Am J Physiol Renal Physiol 312, F210–F229. [DOI] [PubMed] [Google Scholar]
- Limbutara K, Chou C-L & Knepper MA. (2020). Quantitative Proteomics of All 14 Renal Tubule Segments in Rat. Journal of the American Society of Nephrology 31, 1255–1266. [DOI] [PMC free article] [PubMed] [Google Scholar]
- Liu D, Wen Y, Tang TT, Lv LL, Tang RN, Liu H, Ma KL, Crowley SD & Liu BC. (2015). Megalin/cubulin-lysosome-mediated albumin reabsorption is involved in the tubular cell activation of NLRP3 inflammasome and tubulointerstitial inflammation. J Biol Chem 290, 18018–18028. [DOI] [PMC free article] [PubMed] [Google Scholar]
- Long KR, Rbaibi Y, Bondi CD, Ford BR, Poholek AC, Boyd-Shiwarski CR, Tan RJ, Locker JD & Weisz OA. (2021). Cubilin-, Megalin- and Dab2-dependent transcription revealed by CRISPR/Cas9 knockout in kidney proximal tubule cells. Am J Physiol Renal Physiol. [DOI] [PMC free article] [PubMed] [Google Scholar]
- Long KR, Shipman KE, Rbaibi Y, Menshikova EV, Ritov VB, Eshbach ML, Jiang Y, Jackson EK, Baty CJ & Weisz OA. (2017). Proximal tubule apical endocytosis is modulated by fluid shear stress via an mTOR-dependent pathway. Mol Biol Cell 28, 2508–2517. [DOI] [PMC free article] [PubMed] [Google Scholar]
- Ma J, Guan M, Bowden DW, Ng MC, Hicks PJ, Lea JP, Ma L, Gao C, Palmer ND & Freedman BI. (2016). Association Analysis of the Cubilin (CUBN) and Megalin (LRP2) Genes with ESRD in African Americans. Clin J Am Soc Nephrol 11, 1034–1043. [DOI] [PMC free article] [PubMed] [Google Scholar]
- Martins JR, Haenni D, Bugarski M, Polesel M, Schuh C & Hall AM. (2021). Intravital kidney microscopy: entering a new era. Kidney Int, 527–535. [DOI] [PubMed] [Google Scholar]
- Meneton P, Ichikawa I, Inagami T & Schnermann J. (2000). Renal physiology of the mouse. Am J Physiol Renal Physiol 278, F339–351. [DOI] [PubMed] [Google Scholar]
- Mink JG & Benner R. (1979). Serum and secretory immunoglobulin levels in preleukaemic AKR mice and three other mouse strains. Adv Exp Med Biol 114, 605–612. [DOI] [PubMed] [Google Scholar]
- Mori KP, Yokoi H, Kasahara M, Imamaki H, Ishii A, Kuwabara T, Koga K, Kato Y, Toda N, Ohno S, Kuwahara K, Endo T, Nakao K, Yanagita M, Mukoyama M & Mori K. (2017). Increase of Total Nephron Albumin Filtration and Reabsorption in Diabetic Nephropathy. Journal of the American Society of Nephrology 28, 278. [DOI] [PMC free article] [PubMed] [Google Scholar]
- Nagai J, Christensen EI, Morris SM, Willnow TE, Cooper JA & Nielsen R. (2005). Mutually dependent localization of megalin and Dab2 in the renal proximal tubule. Am J Physiol Renal Physiol 289, F569–576. [DOI] [PubMed] [Google Scholar]
- Nagai J, Sato K, Yumoto R & Takano M. (2011). Megalin/cubilin-mediated uptake of FITC-labeled IgG by OK kidney epithelial cells. Drug Metab Pharmacokinet 26, 474–485. [DOI] [PubMed] [Google Scholar]
- Norden AG, Lapsley M, Lee PJ, Pusey CD, Scheinman SJ, Tam FW, Thakker RV, Unwin RJ & Wrong O. (2001). Glomerular protein sieving and implications for renal failure in Fanconi syndrome. Kidney Int 60, 1885–1892. [DOI] [PubMed] [Google Scholar]
- Park CH & Maack T. (1984). Albumin absorption and catabolism by isolated perfused proximal convoluted tubules of the rabbit. The Journal of Clinical Investigation 73, 767–777. [DOI] [PMC free article] [PubMed] [Google Scholar]
- Park HJ, Fan Z, Bai Y, Ren Q, Rbaibi Y, Long KR, Gliozzi ML, Rittenhouse N, Locker JD, Poholek AC & Weisz OA. (2020). Transcriptional Programs Driving Shear Stress-Induced Differentiation of Kidney Proximal Tubule Cells in Culture. Frontiers in Physiology 11. [DOI] [PMC free article] [PubMed] [Google Scholar]
- Peti-Peterdi J, Kidokoro K & Riquier-Brison A. (2015). Novel in vivo techniques to visualize kidney anatomy and function. Kidney Int 88, 44–51. [DOI] [PMC free article] [PubMed] [Google Scholar]
- Raghavan V, Rbaibi Y, Pastor-Soler NM, Carattino MD & Weisz OA. (2014). Shear stress-dependent regulation of apical endocytosis in renal proximal tubule cells mediated by primary cilia. Proc Natl Acad Sci U S A 111, 8506–8511. [DOI] [PMC free article] [PubMed] [Google Scholar]
- Ren Q, Weyer K, Rbaibi Y, Long KR, Tan RJ, Nielsen R, Christensen EI, Baty CJ, Kashlan OB & Weisz OA. (2020). Distinct functions of megalin and cubilin receptors in recovery of normal and nephrotic levels of filtered albumin. American Journal of Physiology-Renal Physiology 318, F1284–F1294. [DOI] [PMC free article] [PubMed] [Google Scholar]
- Schuh CD, Polesel M, Platonova E, Haenni D, Gassama A, Tokonami N, Ghazi S, Bugarski M, Devuyst O, Ziegler U & Hall AM. (2018). Combined Structural and Functional Imaging of the Kidney Reveals Major Axial Differences in Proximal Tubule Endocytosis. Journal of the American Society of Nephrology 29, 2696–2712. [DOI] [PMC free article] [PubMed] [Google Scholar]
- Weinstein AM, Weinbaum S, Duan Y, Du Z, Yan Q & Wang T. (2007). Flow-dependent transport in a mathematical model of rat proximal tubule. Am J Physiol Renal Physiol 292, F1164–1181. [DOI] [PubMed] [Google Scholar]
- Weisz OA. (2021). Endocytic adaptation to functional demand by the kidney proximal tubule. J Physiol 599, 3437–3446. [DOI] [PMC free article] [PubMed] [Google Scholar]
- Weisz OA & Baty CJ. (2018). Lemmings into the sea or back across the bridge? The fate of albumin in nephrotic syndrome. Kidney Int 93, 296–298. [DOI] [PubMed] [Google Scholar]
- Weyer K, Andersen PK, Schmidt K, Mollet G, Antignac C, Birn H, Nielsen R & Christensen EI. (2018). Abolishment of proximal tubule albumin endocytosis does not affect plasma albumin during nephrotic syndrome in mice. Kidney Int 93, 335–342. [DOI] [PubMed] [Google Scholar]
- Weyer K, Storm T, Shan J, Vainio S, Kozyraki R, Verroust PJ, Christensen EI & Nielsen R. (2011). Mouse model of proximal tubule endocytic dysfunction. Nephrol Dial Transplant 26, 3446–3451. [DOI] [PubMed] [Google Scholar]
- Woodhall PB, Tisher CC, Simonton CA & Robinson RR. (1978). Relationship between para-aminohippurate secretion and cellular morphology in rabbit proximal tubules. J Clin Invest 61, 1320–1329. [DOI] [PMC free article] [PubMed] [Google Scholar]
- Zhai XY, Birn H, Jensen KB, Thomsen JS, Andreasen A & Christensen EI. (2003). Digital three-dimensional reconstruction and ultrastructure of the mouse proximal tubule. J Am Soc Nephrol 14, 611–619. [DOI] [PubMed] [Google Scholar]
- Zhai XY, Nielsen R, Birn H, Drumm K, Mildenberger S, Freudinger R, Moestrup SK, Verroust PJ, Christensen EI & Gekle M. (2000). Cubilin- and megalin-mediated uptake of albumin in cultured proximal tubule cells of opossum kidney. Kidney Int 58, 1523–1533. [DOI] [PubMed] [Google Scholar]
Associated Data
This section collects any data citations, data availability statements, or supplementary materials included in this article.
Supplementary Materials
Data Availability Statement
Not applicable.


