

SUMMARY
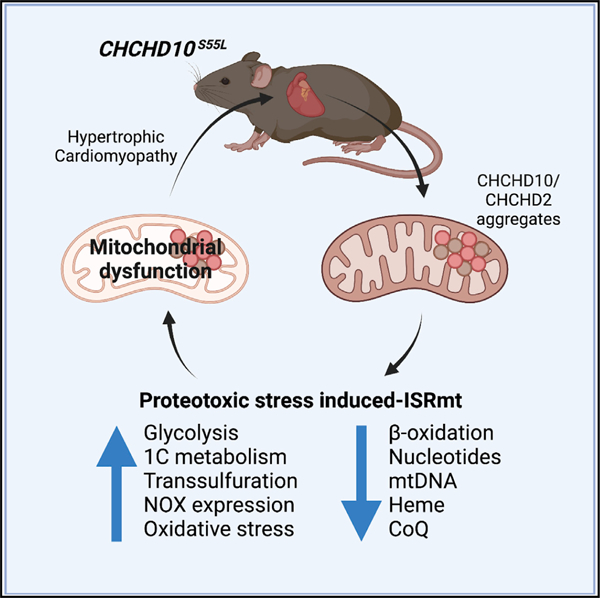
Mitochondrial cardiomyopathies are fatal diseases, with no effective treatment. Alterations of heart mitochondrial function activate the mitochondrial integrated stress response (ISRmt), a transcriptional program affecting cell metabolism, mitochondrial biogenesis, and proteostasis. In humans, mutations in CHCHD10, a mitochondrial protein with unknown function, were recently associated with dominant multi-system mitochondrial diseases, whose pathogenic mechanisms remain to be elucidated. Here, in CHCHD10 knockin mutant mice, we identify an extensive cardiac metabolic rewiring triggered by proteotoxic ISRmt. The stress response arises early on, before the onset of bioenergetic impairments, triggering a switch from oxidative to glycolytic metabolism, enhancement of transsulfuration and one carbon (1C) metabolism, and widespread metabolic imbalance. In parallel, increased NADPH oxidases elicit antioxidant responses, leading to heme depletion. As the disease progresses, the adaptive metabolic stress response fails, resulting in fatal cardiomyopathy. Our findings suggest that early interventions to counteract metabolic imbalance could ameliorate mitochondrial cardiomyopathy associated with proteotoxic ISRmt.
Graphical abstract
In brief
Sayles et al. report that mutant CHCHD10 proteotoxicity activates the mitochondrial integrated stress response (ISRmt) in a mouse model of mitochondrial cardiomyopathy. Chronic ISRmt causes profound metabolic imbalances, culminating in oxidative stress and iron dysregulation, ultimately resulting in mitochondrial dysfunction and contributing to disease pathogenesis.
INTRODUCTION
Mitochondrial oxidative metabolism is the main source of energy in the heart, which underscores the critical role of mitochondrial function in cardiac health (Zhou and Tian, 2018). Mitochondria compose 30% of cardiomyocyte volume and supply energy through oxidative phosphorylation (OXPHOS) (Piquereau et al., 2013). A healthy heart is metabolically flexible, as it is able to shift between OXPHOS substrates to maintain adequate energy production (Bertero and Maack, 2018). Under physiological conditions, it prioritizes fatty acid utilization through β-oxidation, while glycolysis is a secondary energy source (Stanley et al., 2005). However, under stress, metabolic rewiring adapts substrate utilization by upregulating glycolysis (Lopaschuk and Jaswal, 2010). Such metabolic rewiring can modify the normal balance of anabolic and catabolic pathways, and in hypertrophic cardiomyopathies, alterations of metabolic pathways ultimately cause a severe dysregulation of metabolites that can contribute to heart failure (Lopaschuk et al., 2010).
Abnormalities of cardiac mitochondria arise in genetic diseases associated with alterations of OXPHOS (El-Hattab and Scaglia, 2016). In these diseases, hypertrophic cardiomyopathy and heart failure (Brunel-Guitton et al., 2015) are accompanied by metabolic remodeling (Nakamura and Sadoshima, 2018) suggestive of mitochondrial integrated stress response (ISRmt) (Dogan et al., 2014; Forsstrom et al., 2019; Kaspar et al., 2021; Khan et al., 2017; Kuhl et al., 2017; Nikkanen et al., 2016). The ISRmt activates the activating transcription factors ATF4 and ATF5, which downregulate the expression of OXPHOS proteins, while upregulating chaperones, proteases, proteasome subunits, and other proteostasis components aimed to reduce proteotoxic stress (Boos et al., 2020; Higuchi-Sanabria et al., 2018). This retrograde signaling from mitochondria involves the regulator of metabolism and protein synthesis mechanistic target of rapamycin (mTOR) and the activator of antioxidant defenses nuclear factor erythroid 2-related factor 2 (NRF2). The ISRmt causes a profound metabolic rewiring, including activation of serine biosynthesis and one-carbon (1C) metabolism, which provides 1C units for biosynthetic pathways that use folate carriers, such as methionine biosynthesis to promote glutathione (GSH) production by transsulfuration (Mehrmohamadi et al., 2014; Nikkanen et al., 2016). Serine-1C metabolism also generates the NADPH necessary to reduce oxidized GSH. While these adaptive mechanisms could be cardioprotective in the short term, unresolved, chronic ISRmt could contribute to the pathogenesis of mitochondrial cardiomyopathies by causing metabolic imbalances. In agreement with this hypothesis, ISRmt leads to metabolic imbalance in the heart and muscle with genetic alterations of mtDNA maintenance, transcription, or translation (Dogan et al., 2014; Forsstrom et al., 2019; Kaspar et al., 2021; Khan et al., 2017; Kuhl et al., 2017; Nikkanen et al., 2016). However, the cardiac effects of mutations in mitochondrial proteins not involved in mtDNA functions remain to be elucidated.
Here, we investigated cardiac metabolic reprogramming in a mouse model of mitochondrial disease caused by mutant coiled-coil-helix-coiled-coil-helix domain containing protein 10 (CHCHD10). In humans, mutations in CHCHD10 are linked to autosomal dominant multi-systemic mitochondrial disorders (Ajroud-Driss et al., 2015). S55L mutant CHCHD10 (equivalent to the human mutation S59L) knockin mouse models (D10S55L mice) develop a fatal mitochondrial cardiomyopathy (Anderson et al., 2019; Genin et al., 2019; Liu et al., 2020). Mutant CHCHD10 causes alterations of mitochondrial architecture and function in the heart, while CHCHD10 knockout has no consequences (Anderson et al., 2019), unless the paralog protein CHCHD2 is also deleted (Liu et al., 2020), suggesting that S55L CHCHD10 causes mitochondrial cardiomyopathy through dominant-negative or toxic gain-of-function mechanisms.
Using longitudinal multi-pronged approaches, including transcriptomics, metabolomics, and proteomics, as well as molecular and biochemical analyses in the D10S55L mouse heart, we show that constitutively activated ISRmt is associated with mitochondrial protein aggregation and leads to extensive metabolic rewiring. We demonstrate that ISRmt and metabolic rewiring precede OXPHOS defects. We propose that the ISRmt and metabolic reprogramming are initially adaptive, but as proteotoxic stress progresses and mitochondrial damage ensues, they ultimately contribute to cardiac failure. These findings provide clues to understand the pathogenic role of chronic ISRmt in mitochondrial cardiomyopathies.
RESULTS
D10S55L heart exhibits transcriptional and protein expression profiles indicative of cardiomyopathy
The D10S55L knockin mouse provides a viable model to study mitochondrial cardiomyopathy caused by protein misfolding and aggregation. The disease is characterized by decreased left ventricular contractility accompanied by increased fibrosis and vacuolization in cardiac tissue (Anderson et al., 2019; Liu et al., 2020). Here, to investigate the temporal evolution of the molecular events underlying the cardiomyopathy, we analyzed longitudinal transcriptomic profiles (Table S1). Based on the time course of symptom progression (Anderson et al., 2019), the time points were defined as ‘‘pre-symptomatic’’ (75 days of age), ‘‘early symptomatic’’ (125 days), ‘‘symptomatic’’ (225 days), and ‘‘end stage’’ (325 days).
First, we performed a principal-component analysis (PCA) on DESeq2-generated variable stabilized RNA sequencing (RNA-seq) counts from D10S55L and wild-type (WT) littermate hearts. PCA showed the clear clustering of samples by genotype (Figure 1A), but not by age or sex. Many genes were differentially expressed (DEGs with adjusted p < 0.05) in D10S55L hearts relative to WT at all time points (Figure 1B). Mammalian phenotype analysis (by Enrichr; Chen et al., 2013; Kuleshov et al., 2016) on DEGs (Figures 1C–1F) revealed a significant enrichment of pathways indicative of mitochondrial cardiomyopathy with abnormal cellular respiration (e.g., Essra, Acadvl) and abnormal cardiovascular system physiology (e.g., Tmod1, Vcp) starting at 75 days, followed at 125 days by abnormal sarcomere morphology (e.g., Casz1, Lmod3) and decreased ventricle muscle contractility (e.g., Fhod3, Ryr2). At 225 days, affected pathways included abnormal myocardial fiber physiology (e.g., Kcne1, Maoa) and increased response of the heart to induced stress (e.g., Mlip, Flt1), and at 325 days, oxidative stress (e.g., Ncf1, Hmox1) and cardiac hypertrophy (e.g., Myh6, Cd36) were evident.
Figure 1. D10S55L heart exhibits transcriptional and protein expression profiles indicative of cardiomyopathy.

(A). PCA plot showing overall differential gene expression between WT and D10S55L hearts at different ages.
(B). Number of DEGs.
(C–F) Top 10 significant results from mammalian phenotype analysis of DEGs by time point.
(G). Heatmap of the expression of genes and proteins (represented as log2(fold change) [log2(FC)]) associated with cardiac hypertrophy by age, comparing D10S55L to WT (*p adj < 0.05).
(H). Western blot analysis of 125-day heart lysates immunoblotted (IB) for RTN4 (n = 2).
Cardiac stress induces gene expression changes aimed to maintain contractile force, notably reverting to a fetal heart transcriptional profile (Taegtmeyer et al., 2010). Accordingly, we found a characteristic cardiac hypertrophy gene expression signature starting at 75 days (Figure 1G), marked by a decrease in myosin heavy-chain alpha (Myh6) and an increase in myosin heavy-chain beta (Myh7), an adaptive isoform switch to increase heart contractile velocity (Nakao et al., 1997). We also observed an increase in fetal genes Nppa and Nppb, encoding atrial natriuretic factor and brain natriuretic factor, respectively, which are often derepressed under cardiac stress (Man et al., 2018). Lastly, we found an increase in reticulon 4 (Rtn4), whose expression was elevated in models of hypertrophic cardiomyopathy (Sasagawa et al., 2016). These data were corroborated by proteomics analyses of heart lysates at 125 days (Table S2), which showed changes in the levels of MYH6, MYH7, NPPA, and NPPB (Figure 1G), as well as RTN4 (Figure 1G), which was confirmed by western blot (Figure 1H). These findings indicate that D10S55L mice suffer from cardiac stress as early as 75 days of age.
Mitochondrial gene expression changes precede OXPHOS impairment in D10S55L heart
Next, we generated a list of 1,627 DEGs (Figure 2A) that were identified at all time points. Gene Ontology (GO) analyses showed that the most significantly enriched biological processes (Figure 2B), molecular functions (Figure S1A), and cellular components (Figure S1B) were associated with the respiratory electron transport chain, NADH dehydrogenase activity, and mitochondria, respectively, indicating a profound rearrangement of the OXPHOS system. Since the heart is energetically OXPHOS dependent (Gustafsson and Gottlieb, 2008), we focused on respiratory chain complex subunits and assembly factors. Most respiratory chain complexes I–IV and complex V subunits were downregulated at all time points, with a corresponding decrease in protein levels at 125 days (Figure 2C), with few exceptions, notably increased Cox6a1 and Cox8a of complex IV. The former was also elevated by proteomics and western blot (Figure S1C). Furthermore, the levels of complex IV assembly factor Cox19 were elevated. Complex II assembly factors succinate dehydrogenase complex assembly factor 1 (SDHAF) were elevated at the protein level, despite a decrease in the corresponding transcripts. In complex IV, the isoform switch from heart-specific Cox6a2 to liver-specific Cox6a1 can result in the modulation of enzyme activity (Fornuskova et al., 2010) and, for complex II, elevated SDHAF could increase complex assembly and counteract the reduced levels of structural subunits. We also found that most enzymes of coenzyme Q (CoQ) biosynthesis were downregulated at both the transcript and protein levels (Figure 2D). In accordance with this, the levels of heart CoQ9 were significantly decreased at 125 days in D10S55L hearts (Figure 2E). To determine whether the transcriptional repression of electron transport chain (ETC) components affects ETC complexes, we performed blue native PAGE of 125-day heart mitochondria but did not discern differences in the amount or migration complexes I–IV, ATP synthase, or supercomplexes (Figure 2F).
Figure 2. Decreased OXPHOS gene expression precedes OXPHOS defects in D10S55L hearts.
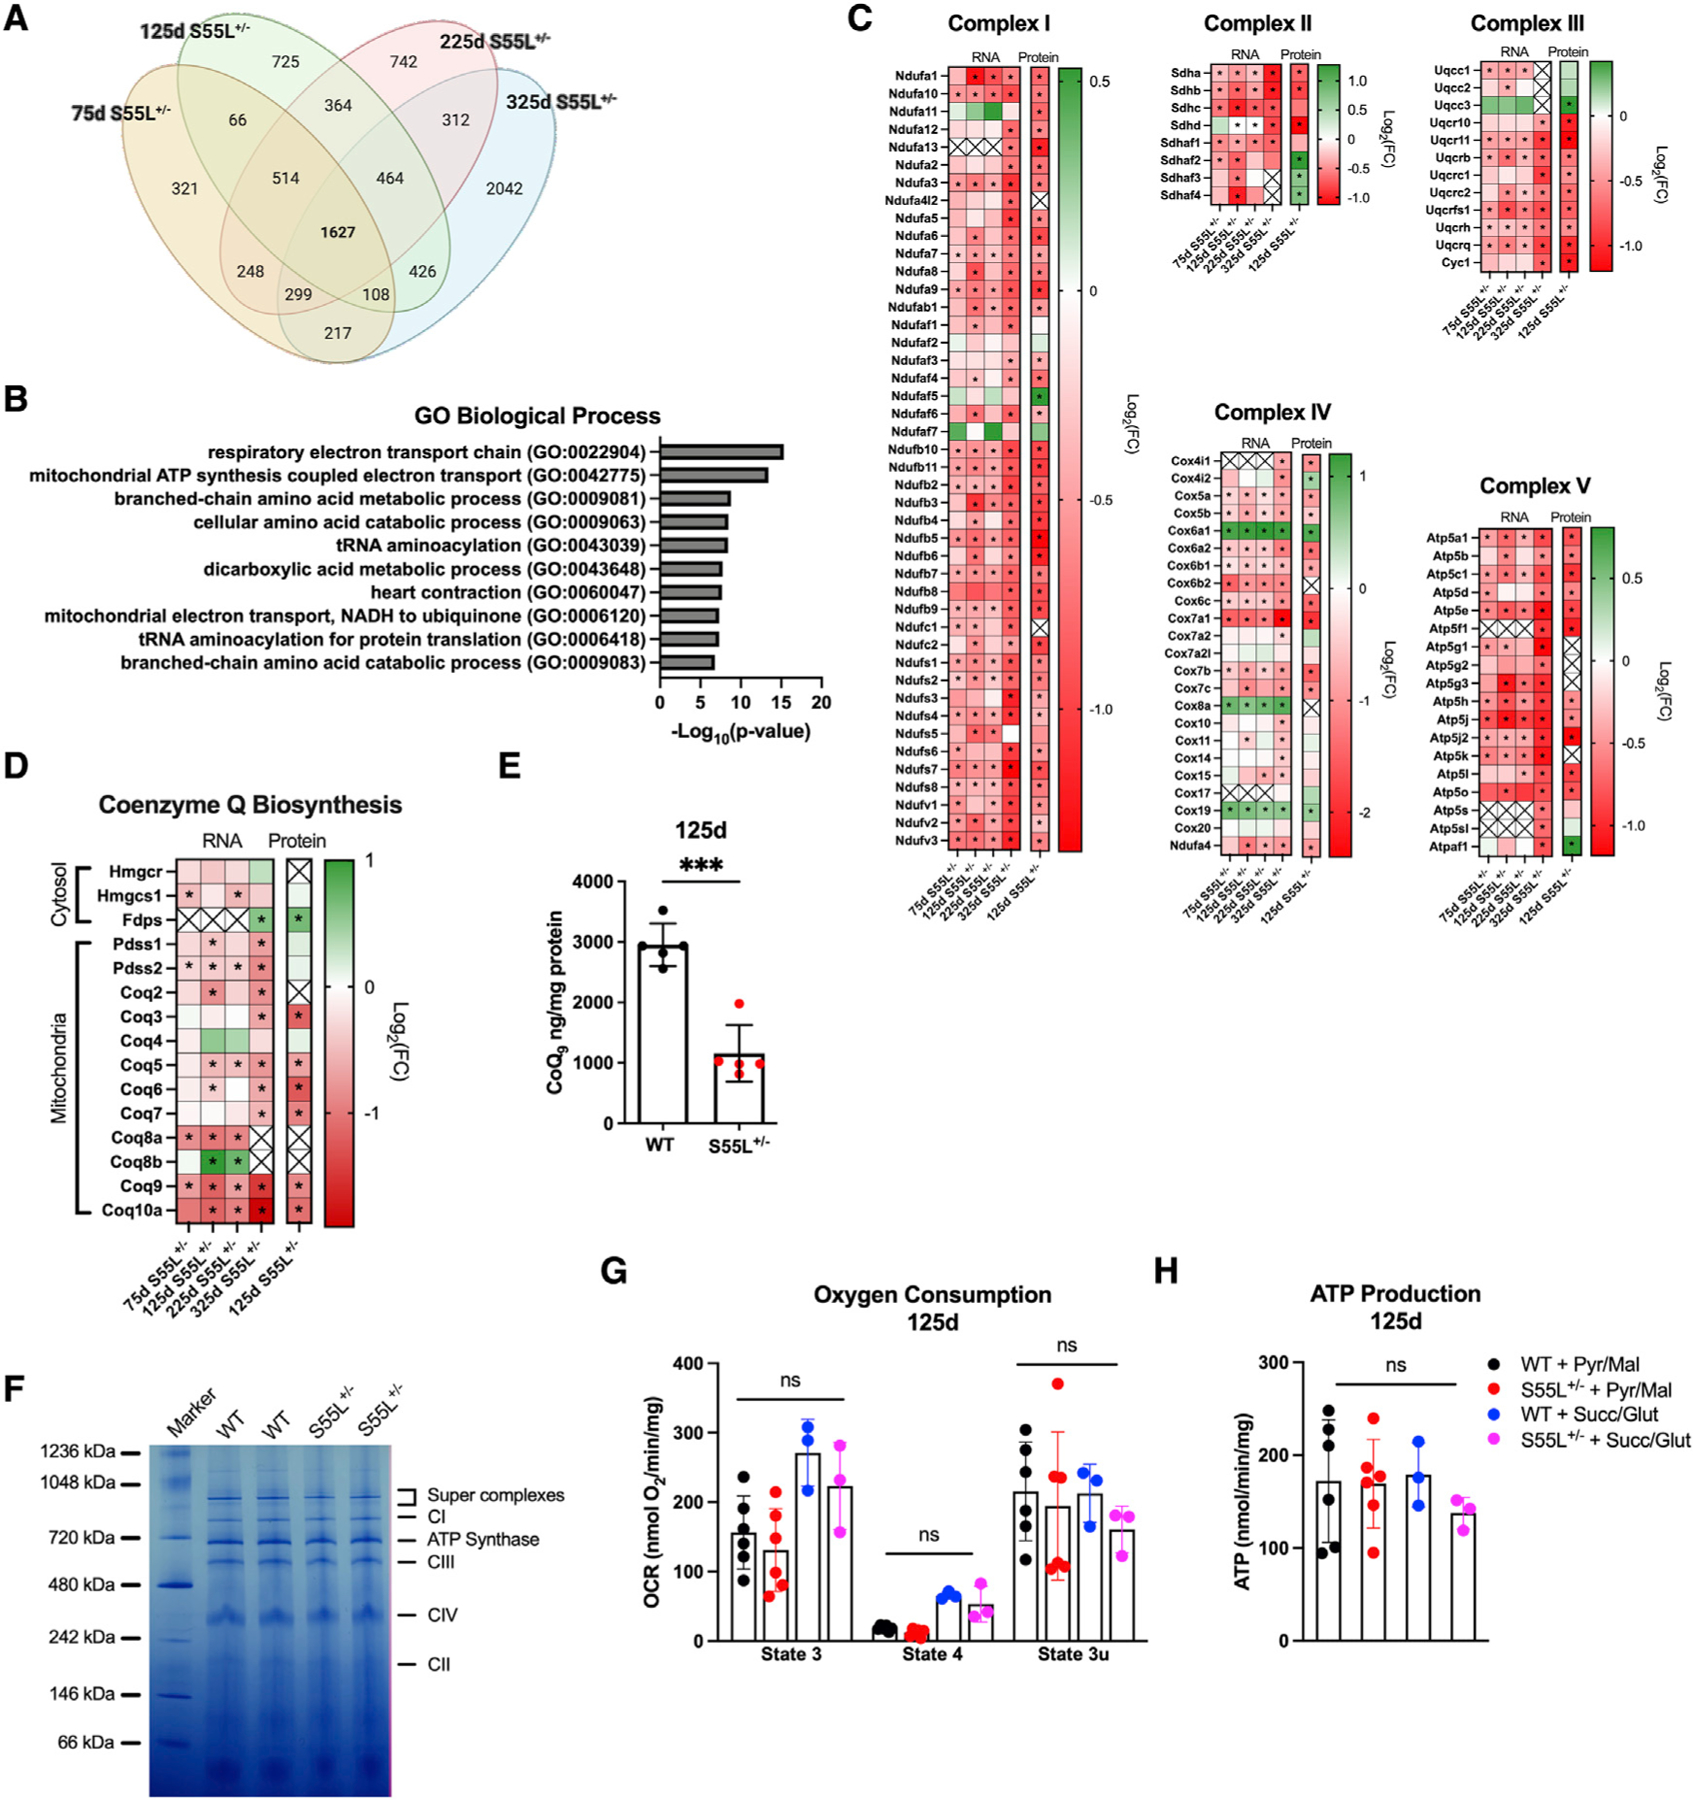
(A). Venn diagram of DEGs in D10S55L and WT hearts.
(B). Top 10 results from Gene Ontology analysis for biological processes showing the enrichment of genes associated with mitochondria.
(C). Heatmap of the expression of genes and proteins associated with OXPHOS complexes I–V.
(D). Heatmap of the expression of genes and proteins involved in CoQ biosynthesis.
(E). CoQ9 measurements in WT and D10S55L hearts at 125 days expressed as nanograms per milligrams of protein (n = 5) (the data are represented as means ± SDs, ***p < 0.0005).
(F). Blue native PAGE of mitochondria from D10S55L and WT heart at 125 days.
(G). Oxygen consumption rates of D10S55L and WT heart mitochondria at 125 days expressed as picomoles of O2 per minute per milligram (n = 3–6/genotype) in state III, state IV, and state IIIu (uncoupled) (the data are represented as means ± SDs).
(H). ATP synthesis rates of D10S55L and WT heart mitochondria at 125 days expressed as nanomoles per minute per milligram (n = 3–6/genotype) (the data are represented as means ± SDs).
For all of the heatmaps, *p adj < 0.05. See also Figure S1.
To assess whether changes in OXPHOS expression affected mitochondrial bioenergetics, we measured the oxygen consumption rate (OCR) and the ATP synthesis rate in freshly isolated mitochondria at 125 days. With both complex I-linked (pyruvate and malate) and complex II-linked (succinate and glutamate) substrates, D10S55L heart mitochondria had OCR comparable to WT controls in state 3 (ADP-stimulated respiration), state 4 (carboxyatractyloside-inhibited ADP/ATP translocase), and uncoupled state (SF-6847 uncoupled) (Figure 2G). There was no significant difference in respiratory control ratio (state 3/state 4), between genotypes (data not shown), indicating a lack of uncoupling and suggesting that mitochondrial inner membrane integrity was preserved at this age. Furthermore, mitochondria from mutant and WT hearts had comparable ATP synthesis rates supported by complex I or complex II substrates (Figure 2H). Taken together, these results suggest that at 125 days, D10S55L heart mitochondria maintain a normal complex assembly and OXPHOS function, which do not decline until the disease end stage (325 days) (Anderson et al., 2019).
The D10S55L heart shifts from oxidative to glycolytic energy metabolism
The healthy heart relies primarily on β-oxidation for mitochondrial OXPHOS (Grynberg and Demaison, 1996). However, D10S55L mice experienced transcriptional downregulation of lipid transporters (Fatp, Cd36, Slc25a20) and key enzymes (Acsl1, Acadvl, Cpt2) of β-oxidation (Figures 3A and 3B). Proteomic analyses of β-oxidation components at 125 days were consistent with the transcriptional profiles; however, there was an increase in carnitine-acylcarnitine translocase (CACT) at the protein level (Figure 3B). Western blots confirmed the transcriptomic results that showed a decrease in CACT levels (Figure S2A). The other component of the carnitine palmitoyltransferase system (Cpt1) was increased at the mRNA levels, but unchanged at the protein level. Based on these findings, we investigated the metabolic consequences by untargeted metabolomics (Table S3). Levels of L-palmitoylcarnitine were increased at 75 days, but then decreased starting at 125 days (Figure 3C), suggesting a decrease in β-oxidation. This evidence indicates that heart metabolism becomes less dependent on β-oxidation as the disease progresses. Furthermore, most tricarboxylic acid (TCA) cycle enzymes were downregulated (Figure S2B). Although we did not observe significant changes in TCA metabolites (Figure S2C), the downregulation of the pyruvate dehydrogenase complex and TCA enzymes suggests a decrease in the utilization of acetyl-coenzyme A (CoA).
Figure 3. D10S55L hearts rewire energy metabolism to stimulate glucose over fatty acid utilization.

(A). Schematics of β-oxidation in the heart. Downregulated enzymes and transporters are labeled in red, upregulated in green, and unchanged in black. Metabolites are labeled in red if downregulated or black if unchanged.
(B). Heatmap of the expression of genes and proteins of β-oxidation.
(C). Heatmap of metabolites (represented as log2(FC)) of β-oxidation.
(D). Schematic of glycolysis in the heart and enzyme isoforms. Enzymes and transporters are labeled in red if downregulated, green if upregulated, or black if unchanged. For metabolites, blue indicates upregulated, red indicates downregulated, and black indicates unchanged.
(E). Heatmap of the expression of genes and proteins of glycolysis.
(F). Heatmap of metabolites of glycolysis.
For all of the heatmaps, *p adj < 0.05. See also Figure S2.
A decrease in fatty acid utilization and acetyl-CoA oxidation (Karwi et al., 2018) is a metabolic feature of cardiac hypertrophy, accompanied by upregulated glucose utilization (Lopaschuk and Jaswal, 2010; Lopaschuk et al., 2010). Healthy adult hearts preferentially import glucose via insulin-sensitive GLUT4, while expressing insulin-insensitive GLUT1 at low levels. Glucose is phosphorylated to glucose-6-phosphate predominantly by hexokinase 2 (HK2), while HK1 is mostly expressed in the fetal heart (Tran and Wang, 2019). We found that the D10S55L heart downregulates Glut4 and Hk2, while Glut1 and Hk1 are upregulated, starting at 75 days (Figures 3D and 3E), which is consistent with increased glycolytic activity. D10S55L hearts showed an increased expression of lactate dehydrogenase A (LDHA) and α-enolase (ENO1), paralleling the predominant fetal isoform expression observed in hypertrophic cardiomyopathy (Lopaschuk and Jaswal, 2010; Thrasher et al., 1981). While normally the adult heart expresses only the muscle isoform of phosphofructokinase (Pfkm), increased expression of Pfkl and Pfkp in the D10S55L heart further indicates a fetal gene expression profile (Thrasher et al., 1981). Metabolites of the glycolytic pathway were largely unchanged, except for a moderate increase in pyruvate at 225 days and a more significant decrease in glyceraldehyde-3-phosphate (G3P) at 125 and 225 days (Figure 3F). The former could be related to a decrease in the levels of mitochondrial pyruvate transporter (Mpc2; Figure 3E), while the latter could be due to a diversion to alternate pathways, such as serine biosynthesis for 1C metabolism. Together, these results indicate that glucose utilization is enhanced in the D10S55L heart as part of a metabolic adaptation, likely resulting from the downregulation of β-oxidation and OXPHOS.
CHCHD10 aggregation is associated with ISRmt in the D10S55L heart
The rewiring of energy metabolism and the transcriptional profile of mitochondrial proteins at early disease stages, in the absence of overt OXPHOS dysfunction, suggests that the D10S55L heart activates the ISRmt. A possible cause of mitochondrial stress is the alteration of proteostasis, which is essential for mitochondrial integrity and function (Jadiya and Tomar, 2020). Normally, misfolded mitochondrial proteins are handled by dedicated chaperones and proteases or by the cytosolic proteasome. However, if the load of misfolded proteins exceeds the quality control capabilities, then proteotoxic stress ensues (Boos et al., 2020). We assessed the accumulation of aggregated forms of CHCHD10 and its paralog protein partner CHCHD2. Both proteins were most abundant in the mitochondrial fraction, although also detected in the cytosolic fraction, in both mutant and WT hearts (Figure 4A). Levels of cytosolic CHCHD10 and CHCHD2 were similar in D10S55L and WT hearts, but both proteins were strongly increased in D10S55L mitochondrial fractions, as early as 75 days. Since the transcript levels of Chchd10 and Chchd2 were unchanged (Figures S3A and S3B), the accumulation in mitochondria was not the result of increased gene expression. Next, we performed a time course analysis of protein aggregation using a filter trap technique (Palomo et al., 2018). In D10S55L mitochondrial fractions, we detected an accumulation of detergent insoluble and unfilterable CHCHD10 and CHCHD2 immunoreactive material, indicative of large protein aggregates, as early as 75 days (Figure 4B). Large protein aggregates were detected in the mitochondrial fraction and not in the cytosolic fraction (Figure 4C).
Figure 4. CHCHD10 and CHCHD2 accumulate and aggregate in mitochondria early in disease progression.

(A). Western blot of total (T), cytosolic (C) and mitochondrial (M) fractions of hearts at 75 days, IB for CHCHD10, CHCHD2, Vdac1 (outer mitochondrial membrane [OMM] marker), Tim23 (inner mitochondrial membrane [IMM] marker), and cyclophilin D (Ppid, mitochondrial matrix marker).
(B). Filter trap of mitochondrial samples from WT and D10S55L hearts at 75, 125, and 325 days IB for CHCHD10 or CHCHD2.
(C). Filter trap of T, C, and M fractions at 75 days; IB for CHCHD10 or CHCHD2.
(D). Heatmap of the expression of genes and proteins associated with the proteasome.
(E). Volcano plots of DEGs of mitochondrial quality control mechanisms. The total number of DEGs is indicated for each age in red (–log10P = –log10(p adj)).
(F). Heatmap of the expression of genes and proteins of mitochondrial protein quality control.
(G). Heatmap of the expression of genes and proteins of ISRmt. For all of the heatmaps, *p adj < 0.05. See also Figures S3–S6.
Since misfolded mitochondrial proteins can lead to proteasome activation (Hansen and Herrmann, 2019), we analyzed the proteasome subunits. In D10S55L hearts, there was a general increase in the expression of subunits of the catalytic core (20S) (Psma, Psmb), regulatory core (19S) base (Psmc) and lid (Psmd), and assembly chaperones (Psmg) (Figure 4D), with an increase in the corresponding proteins. The upregulation of a subset of proteasome subunits, PSMA7, PSMB2, PSMD11, and PSMD4, was confirmed by western blot (Figures S4A–S4D). The coordinated upregulation of the regulatory core and assembly subunits suggest increased activity of the proteasome due to increased accessibility to the catalytic core (Taylor and Rutter, 2011).
Mitochondria rely on quality control systems to prevent the accumulation of misfolded proteins, including chaperones, proteases, and selective mitochondrial autophagy (mitophagy) (Pickles et al., 2018). To understand the level of engagement of mitochondrial quality control in the D10S55L heart, we analyzed the expression of broadly categorized ‘‘mitophagy genes’’ in GeneCards (https://www.genecards.org/Search/Keyword?queryString=mitophagy). The number of mitophagy-related DEGs increased over time in D10S55L hearts (Figure 4E), suggesting the progressive activation of mitochondrial quality control pathways. Next, we looked at the expression of a selected pool of genes encoding well-characterized players in mitochondrial quality control (Figure 4F). The autophagy receptor p62 (Sqstm1) and the matrix proteases LONP1 and caseinolytic peptidase P/caseinolytic peptidase X (CLPP/CLPX), as well as the chaperones HSP60 (Hspd1), HSP10 (Hspe1), and HSP90 (Hsp90aa1) were upregulated. Western blot analysis confirmed elevated levels of a subset of these proteins, including p62, LONP1, CLPX, and HSP60 (Figures S5A–S5D). LC3B, involved in autophagosome formation and mitophagy, was elevated by proteomics (Figure 4F) and western blot (Figure S6A), although it did not reach statistical significance. The level of the mitophagy receptor prohibitin 2 (PHB2) (Wei et al., 2017) was reduced at the protein level by proteomics, but western blot analyses did not detect PHB2 level changes between WT and D10S55L hearts (Figure S6B). However, stomatin-like protein 2, mitochondrial (STOML2), which regulates mitochondrial protease activity (Wai et al., 2016) and functionally interacts with PHB2 (Christie et al., 2011), was elevated by both proteomics (Figure 4F) and western blot (Figure S6C). Furthermore, the mitochondrial fusion protein MFN1 was decreased, while the mitochondrial fission protein DRP1 (Dnm1l) and its mitochondrial receptor FIS1 were increased, suggesting mitochondrial fragmentation, possibly to facilitate mitophagy. Overall, these findings indicate that mitochondrial quality control mechanisms are induced in a time-dependent manner in D10S55L hearts.
Protein aggregation and mitochondrial quality control activation suggest that the D10S55L heart attempts to cope with a proteotoxic stress initiated in mitochondria. To test this hypothesis, we looked at an array of genes that have been involved in ISRmt in models of mtDNA alterations (Dogan et al., 2014; Forsstrom et al., 2019; Kaspar et al., 2021; Khan et al., 2017; Kuhl et al., 2017; Nikkanen et al., 2016). Transcriptional regulators (Atf4, Atf5, Ddit3, Trib3, Hif1a), myokines (Fgf21 and Gdf15), and stress-induced enzymes (Asns and Chac1) were transcriptionally upregulated at all time points (Figure 4G). Corresponding increases were also evident for asparagine synthetase (ASNS) and Tribbles homolog 3 (TRIB3) detected at 125 days by proteomics. Interestingly, the endoplasmic reticulum (ER) stress factor Hspa5 (BiP) was downregulated at the mRNA level but was elevated at the protein level by both proteomics (Figure 4G) and western blot (Figure S6D), suggesting posttranscriptional regulatory mechanisms. Together, these data indicate that the D10S55L heart activates the ISRmt as early as 75 days.
ISRmt is associated with an extensive metabolic rewiring in the D10S55L heart
In skeletal muscle and heart with mtDNA defects, ISRmt induces metabolic rearrangements (Dogan et al., 2014; Forsstrom et al., 2019; Kaspar et al., 2021; Khan et al., 2017; Kuhl et al., 2017; Nikkanen et al., 2016), involving a range of pathways, such as de novo serine biosynthesis, 1C metabolism, and transsulfuration (Figure 5A). In the heart of D10S55L mice, serine biosynthesis enzymes (Phgdh, Psat1, Psph1) were upregulated starting at 75 days and persisted at all time points (Figure 5B). Serine is a precursor of the folate cycle and transsulfuration, which are connected via the shuttling of metabolites of the methionine cycle (Figure 5A). Notably, enzymes of the folate cycle (Shmt2, Mthfd1l, Mthfd2), methionine cycle (Mthfr), and the transsulfuration (Cth, Gss, Gsr, Csad) were upregulated in D10S55L hearts (Figure 5B). Proteomics at 125 days confirmed increased levels of these enzymes. Moreover, Mtr of the methionine cycle was transcriptionally downregulated at 125 days, but increased at the protein level by proteomics (Figure 5B) and western blot (Figure S7A), suggesting posttranslational regulation. Another enzyme of the methionine cycle, Mat2b, was downregulated at the transcript level and upregulated by proteomics. However, western blot showed decreased MAT2B (Figure S7B), in accordance with the transcript levels.
Figure 5. ISRmt activation leads to metabolic imbalance.

(A). Schematics of the interplay between ISRmt metabolic pathways, including serine metabolism, transsulfuration, and 1C metabolism (folate/methionine cycle). Genes/proteins are labeled in green if upregulated or red if downregulated. Metabolites are labeled in blue if upregulated or red if downregulated. Black indicates no change.
(B). Heatmap of the expression of genes and proteins of 1C metabolism, serine biosynthesis, and the transsulfuration pathway.
(C). Heatmap of metabolites of the NAD family, methionine cycle, transsulfuration pathway, and serine biosynthesis. (D and E) Schematics of purine (D) and pyrimidine (E) synthesis and recycling.
(F). Heatmap of the expression of genes and proteins of nucleotide biosynthesis.
(G). Heatmap of purine and pyrimidine levels.
For all of the heatmaps, *p adj < 0.05. See also Figures S7–S9.
Metabolomics showed increased D-2-hydroxyglutarate (D-2HG), serine, and glycine, as early as 75 days (Figure 5C). Most amino acids were increased or unchanged, except for glutamine, which was decreased at all time points (Figure S7C). It is possible that, due to the downregulation of ETC machinery and the OXPHOS defect, reductive glutamine anaplerosis is activated in the D10S55L heart to provide substrate-level phosphorylation, as we previously demonstrated in a model of mitochondrial myopathy (Chen et al., 2018). In addition, as observed in other models of cardiac hypertrophy (Sun et al., 2016), we found increased branched-chain amino acids (BCAA), along with decreased BCAA catabolism enzymes (Figures S7C and S7D). We also observed an elevation in metabolites of the methionine cycle, including S-adenosylmethionine (SAM) and S-adenosylhomocysteine (SAH) (Figure 5C). In the transsulfuration pathway, there was an increase in cystathionine at 75 days. At this time, GSH levels were preserved, but at 125 days, GSH was significantly decreased, despite a sustained increase in cystathionine (Figure 5C). Moreover, downstream of GSH, the levels of taurine were decreased. This is significant because in physiological conditions, taurine is abundant in the heart to maintain contractility, and taurine depletion has been associated with cardiomyopathy (Schaffer et al., 2010). Overall, transcriptomics and metabolomic changes in the D10S55L heart suggest an increased demand for GSH, which is initially met by increased serine and 1C metabolism, as previously described (Kuhl et al., 2017; Nikkanen et al., 2016). However, after 125 days, the decline in GSH, NAD, and NADP+ suggests that adaptation becomes insufficient, possibly due to the increased utilization of these metabolites.
The metabolism of 1C and derived folate intermediates are necessary for de novo purine (Figure 5D) and pyrimidine (Figure 5E) biosynthesis. For purine biosynthesis, 5-aminoimida-zole-4-carboxamide ribonucleotide (AICAR) conversion to inosine monophosphate (IMP) requires AICAR transformylase/IMP cyclohydrolase (ATIC), which was upregulated in D10S55L hearts together with IMPDH2 (Figure 5F). However, transcript levels of Gmpr and Gmps were decreased, although these enzymes were elevated by proteomics. We did not detect changes in the protein levels of guanosine monophosphate receptor 1/2 (GMPR1/2) or GMP synthase (GMPS) by Western blot (Figures S8A and S8B). At the metabolite level, while AICAR was elevated, IMP and adenine derivatives were decreased (Figure 5G). Moreover, likely due to the decline in adenosine, we observed an upregulation of enzymes of the adenosine recycling pathway (Aprt, Nt5e). Adenosine kinase (Adk) was transcriptionally downregulated, but protein levels were increased by proteomics (Figure 5G). However, western blot showed no changes in ADK levels (Figure S8C). In the de novo pyrimidine biosynthesis pathway, there was a decrease in uridine monophosphate (UMP) and cytidine monophosphate (CMP) levels, despite an increase in enzymes involved in the pathway (i.e., Nt5e and Ctps). Moreover, valine, which can derive from pyrimidine degradation, was increased at 125 and 225 days (Figure S7C). In general, we found an upregulation of nucleotide biosynthetic enzymes, likely as a compensatory mechanism for the depletion of several key nucleotides. Unbalanced nucleotide pools have been associated with mtDNA instability in mitochondrial disease (Viscomi and Zeviani, 2017). In the D10S55L heart, we observed a decrease in mtDNA levels at 225 days (Figure S9A), despite normal transcript levels of key mtDNA replication and maintenance components, such as Tfam, Twnk, and Polg (Figure S9B), suggesting that mtDNA depletion may be due to nucleotide imbalance. Transcriptomics and proteomics identified the downregulation of seven of the mtDNA-encoded OXPHOS genes (Figure S9C). However, mtDNA-encoded ribosomal RNAs and transfer RNAs were largely unchanged. Taken together, these results suggest that mtDNA depletion reduces the expression of OXPHOS sub-units, in parallel with the decline in nuclear-encoded OXPHOS subunits.
Purine and pyrimidine de novo biosynthesis pathways require folate derivatives from 1C metabolism, 10-formyltetrahydrofolate (10-formylTHF), and 5,10meTHF, respectively. These intermediates are irreversibly consumed by methylenetetrahydrofolate reductase (MTHFR), whose transcript was increased in the D10S55L heart, presumably causing a depletion of folate derivatives. Surprisingly, we observed increased levels of guanosine and uric acid (Figure 5G), the final degradation product of purines. This finding could be explained by the fact that GMPR requires NADPH, which was decreased in mutant hearts, resulting in the decreased conversion of GMP to IMP. NADPH is a product of 1C metabolism (Figure 5A) and is consumed to reduce GSH. It is plausible that mutant hearts are depleted of NADPH due to increased GSH requirements. In summary, the enhancement of transsulfuration in the D10S55L hearts to support GSH synthesis results in a chronic nucleotide imbalance, mtDNA depletion, and a loss of cardioprotective taurine.
Antioxidant pathways are activated in the D10S55L heart
Although the D10S55L heart rewires metabolism to drive GSH production via transsulfuration, at 125 days, we found a decrease in GSH levels (Figure 5C), suggesting that the consumption of GSH outweighs the production. GSH forms thiol bonds with cysteine residues of proteins to prevent irreversible oxidative damage, which can contribute to heart failure (Bajic et al., 2019). Among the genes involved in GSH-linked antioxidant mechanisms, glutathione peroxidases (Gpx) were upregulated overall, both at the mRNA and protein levels (Figure 6A). Glutathione S-transferases (Gst), detoxifying enzymes that conjugate GSH to macromolecules, showed variable expression profiles, with most of the genes downregulated transcriptionally, but not at the protein level. However, Gst kappa-1 (Gstk1) was markedly downregulated both at the transcript and protein levels. Interestingly, Gstk1 downregulation has been associated with various models of hypertrophic cardiomyopathy, and its genetic ablation causes reduced left ventricular contractility (Sasagawa et al., 2016). Therefore, Gstk1 downregulation in D10S55L mice may play a role in the cardiomyopathy.
Figure 6. D10S55L hearts display antioxidant responses and altered expression of iron-regulatory genes.

(A) Heatmap of the expression of genes and proteins of glutathione metabolism.
(B and C) Western blot of protein glutathionylation in WT and D10S55L heart lysates from 75, 125, 225, and 325 days, quantified in (C) (n = 2/2/3/3, respectively) (the data are represented as means ± SDs, **p < 0.005, ***p < 0.0005, ****p < 0.00005).
(D). Heatmap of expression of genes and proteins of antioxidant responses.
(E). H2O2 emission from WT and D10S55L heart mitochondria at 125 days expressed as picomoles per minute per milligram (n = 6) (the data are represented as means ± SDs, **p < 0.005).
(F). Heatmap of gene expression of NADPH oxidase (Nox2/4) and associated proteins.
(G). Schematics of heme metabolism. Enzymes are labeled in green if upregulated or red if downregulated at 325 days.
(H). Heatmap of the expression of genes and proteins of heme metabolism.
(I). Heart mitochondrial heme at 125 days represented as relative light units (RLUs) (n = 6) (the data are represented as means ± SDs, **p < 0.005).
(J). Schematics of iron regulation, involving iron import, storage, and mitochondrial utilization. Enzymes and transporters are labeled in green if upregulated, red if downregulated, or black if unchanged in D10S55L hearts.
(K). Heatmap of the expression of genes and proteins of iron regulation.
(L). Heart mitochondrial total iron at 125 days represented as micrograms per microliter (n = 6) (the data are represented as means ± SDs).
(M). Heatmap of the expression of genes and proteins of ISC biogenesis. For all of the heatmaps, *p adj < 0.05. See also Figure S10.
We found increased levels of glutathionylated proteins in D10S55L hearts starting at 125 days (Figures 6B and 6C), while the levels of protein carbonylation and lipid peroxidation (malondialdehyde [MDA]) were unchanged in mutant hearts at all time points (Figures S10A and S10B). Taken together, these results suggest that D10S55L hearts mount an antioxidant response, which effectively prevents oxidative damage to macromolecules, but depletes GSH pools. Furthermore, peroxiredoxins Prdx1 and Prdx6 were upregulated at the mRNA and protein levels (Figure 6D). Despite transcriptional downregulation, PRDX2 was increased by proteomics (Figure 6D) and western blot, although it did not reach statistical significance (Figure S10C). Prdx4 was undetected by transcriptomics, but it was elevated by proteomics (Figure 6D) and western blot (Figure S10D). Furthermore, catalase (Cat) was highly increased at both the transcript and protein levels, as were several NRF2 target genes containing antioxidant response elements (AREs), including Nqo1, Srxn1, Hmox1, and Txnrd1 (Figure 6D).
We then investigated whether mitochondria were the source of oxidative stress in D10S55L hearts. Surprisingly, at 125 days, a time point at which GSH is depleted and protein glutathionylation is increased, D10S55L heart mitochondria emit less H2O2 than WT mitochondria, when respiring with succinate and glutamate as substrates (Figure 6E). This result suggests that mitochondria do not contribute to oxidative stress in D10S55L hearts, either because they produce fewer reactive oxygen species (ROS) or because they scavenge them more efficiently. In hypertrophic cardiomyopathy, NADPH oxidases (Nox2/4) are upregulated (Zhao et al., 2015). The pathophysiological significance of this upregulation is still debated, as H2O2 produced may have both adaptive and damaging effects (Chen et al., 2012). Intriguingly, in D10S55L hearts, we found a strong upregulation of Nox2/4 genes, as well as other members of the NOX2 complex (p67phox, p47phox, and p40phox) (Figure 6F), implying that NOX elevation could be the source of ROS. Together, these data suggest that D10S55L hearts activate an extensive NRF2-driven antioxidant response, possibly due to Nox2/4 upregulation induced by cardiac stress.
Iron metabolism is altered in the D10S55L heart
In addition to its known role in oxidative stress response, NRF2 participates in metabolic rewiring, proteotoxic stress response, mitochondrial biogenesis, and inflammation (He et al., 2020). NRF2 upregulates heme oxygenase-1 (Hmox1), which catalyzes the first step of heme degradation (Figure 6G). Hmox1 (Figure 6D) and biliverdin reductase alpha/beta (Blvra/b) were upregulated at all time points in D10S55L hearts (Figure 6H). In parallel, the heme biosynthesis rate-limiting mitochondrial enzyme aminolevulinic acid synthase 1 (Alas1) was decreased at the protein and transcript levels (225 and 325 days). The expression of heme biogenesis enzymes was downregulated transcriptionally only at 325 days, while proteins were unchanged at 125 days (Figure 6H). In accordance with increased heme degradation enzymes, mitochondrial heme levels were reduced at 125 days (Figure 6I), suggesting that D10S55L hearts attempt to limit heme, while increasing the levels of biliverdin and its metabolite bilirubin, which have antioxidant (Inoguchi et al., 2016) and cardioprotective (Bulmer et al., 2018) functions.
Free iron can produce highly reactive ROS through Fenton’s reaction with H2O2. Thus, iron metabolism is tightly regulated to limit free iron accumulation and ROS-mediated damage, two major contributors to heart failure (Gammella et al., 2015; Lakhal-Littleton, 2019; Rhee et al., 2020; Wang and Kang, 2020). Following its uptake through transferrin-dependent and -independent pathways, iron is sequestered in mitochondria (Figure 6J) (Richardson et al., 2010). In D10S55L hearts, genes involved in both transferrin-dependent (Trf, Picalm, Nramp1, Dmt1) and -independent (Steap2, Frrs1, Slc39a14) iron uptake were upregulated, and ferroportin (Slc40a1), responsible for iron export, was downregulated (Figure 6K), indicating that mutant hearts activate a program to maintain intracellular iron homeostasis. In accordance, we found an increased expression of ferritin subunits, Ftl1 and Fth1, which store iron. The majority of labile iron is imported via mitoferrin 1, 2 (MFRN1/2) into mitochondria, where it is used to generate heme and iron-sulfur clusters (ISCs) (Chen and Paw, 2012). In D10S55L hearts, the levels of these iron transporters were unchanged until 325 days, when Mfrn2 expression decreases (Figure 6K), suggesting that compensation occurs in the early disease stages. In support of the hypothesis that iron homeostasis is maintained though adaptive changes, we found no significant differences in total mitochondrial iron levels between mutant and WT hearts at 125 days (Figure 6L).
ISCs are crucial for ETC and Krebs cycle enzymes. In D10S55L hearts, the expression of Nfs1, the rate-limiting enzyme in ISC biogenesis, was decreased starting at 225 days, and the remaining enzymes of ISC biosynthesis were downregulated at 325 days (Figure 6M). Genes involved in mitochondrial ISC complex machinery stabilization (Hspa9) and the cytosolic ISC scaffold complex (Nubp1/2) were upregulated at all of the time points, possibly as a compensatory response. These observations suggest that mitochondrial ISC assembly defects may contribute to the OXPHOS defect observed at 325 days (Anderson et al., 2019). Together, these data indicate that the dysregulation of heme, and possibly ISC at end stage, may contribute to D10S55L cardiomyopathy.
Mitochondrial protein aggregation precedes the onset of ISRmt in D10S55L cardiomyopathy
At 75 days, an age corresponding to early adulthood, D10S55L hearts exhibit CHCHD10 and CHCHD2 aggregation and ISRmt activation. To better understand the early events leading to cardiomyopathy, we investigated hearts at 30 days, when there is low hyperplastic cardiac growth accompanied by cardiac tissue maturation (Talman et al., 2018). We found accumulation of CHCHD10 in D10S55L mitochondria at 30 days (Figure 7A), but significantly less than at 75 days, and a corresponding lower abundance of protein aggregates (Figure 7B). Importantly, the CHCHD10 accumulation was not due to transcription, as Chchd10 expression was unchanged at 30 days (Figure 7C). Therefore, mitochondrial CHCHD10 aggregates accumulate during postnatal development of the heart.
Figure 7. Mitochondrial protein aggregation precedes the onset of ISRmt in D10S55L cardiomyopathy.

(A). Western blot of 30- and 75-day mitochondrial fractions; IB for CHCHD10 and IMM marker Tim23.
(B). Filter trap of mitochondrial samples at 30 and 75 days; IB for CHCHD10 and Tim23.
(C). Expression of genes (represented as log2(FC)) associated with cardiac hypertrophy, ISRmt, 1C metabolism, transsfulfuration, serine metabolism, and oxidative stress at 30 days measured by RNA-seq (*p adj < 0.05).
(D). Schematics of the time course of pathological events in the progression of D10S55L cardiomyopathy.
(E). Schematics of the cascade of events leading to heart failure in D10S55L mice. Proteotoxic ISRmt alters gene expression, including repression of OXPHOS and ISC biosynthesis genes. ISRmt increases Nox2/4 genes, which produce ROS, triggering increased GSH production via transsulfuration. Metabolic rewiring leads to taurine depletion, nucleotide imbalance, and mtDNA depletion. Increased ROS also triggers NRF2 activation, which promotes HMOX1 expression and heme degradation. These altered pathways underlie metabolic imbalances, mitochondrial dysfunction, and heart failure.
See also Figure S11.
RNA-seq of 30d D10S55L hearts did not identify statistically significant transcriptional alterations in cardiac hypertrophy genes, except for Rtn4 upregulation (Figure 7C). Interestingly, we found an increased expression of Gdf15 (Figure 7C), an ISRmt-associated myokine shown to be cardioprotective, antihy-pertrophic, and induced in response to cardiac stress or failure (Xu et al., 2006). This transcriptional profile indicates that 30d D10S55L hearts have not yet reached the threshold of a full stress response. While the expression of ISRmt-associated genes Asns and Trib3 was increased at 30 days, Atf4 and Atf5 (Figure 7C) and proteasome subunit expression (Figure S11A) was unchanged, suggesting that proteotoxic stress and ISRmt were not fully activated. Moreover, we did not observe transcriptional changes in the pathways associated with ISRmt, except for an increase in Mthfd2 and Psat1. At the same time, the expression levels of Nox2/4 were unchanged (Figure 7C). While a subset of NRF2 target genes Nqo1, Srxn1, and Txnrd1 were upregulated, most antioxidant enzymes were unchanged, suggesting that extensive oxidative stress responses do not take place in the absence of NOX upregulation. Lastly, we did not observe transcriptional changes in genes involved in β-oxidation, glycolysis, OXPHOS, or iron regulation at 30 days (Figures S11B–S11H).
Taken together, these data highlight an early pathological stage in D10S55L cardiomyopathy progression, in which mitochondrial protein aggregates have not reached the proteotoxic threshold for induction of the ISRmt. Overall, these observations contribute to the understanding of the sequential pathogenic events leading to mitochondrial cardiomyopathy associated with ISRmt (Figure 7D).
DISCUSSION
This study investigates chronic ISRmt and the resulting metabolic rewiring by longitudinal integrated multi-omics analyses of a D10S55L mouse model of mitochondrial cardiomyopathy. By identifying altered key metabolic pathways, we provide insights into the metabolic imbalances resulting from cardiac mitochondrial proteotoxic stress. The metabolic shift in energy metabolism from β-oxidation to glycolysis, accompanied by increased serine utilization for 1C metabolism and transsulfuration, occurs early, before symptom onset. A recent study of the muscles of patients affected by reversible infantile respiratory chain deficiency (RIRCD) showed that the spontaneous recovery is due to a two-stage mechanism involving the initial activation of ISRmt followed by a secondary mTOR activation promoting mitochondrial biogenesis (Hathazi et al., 2020). Interestingly, biomarkers of ISRmt and glycolysis return to normal levels in RIRCD recovered muscle, suggesting that the ISRmt can play a protective role, if appropriately regulated and terminated. However, in the D10S55L heart, ISRmt activation and related metabolic alterations persist. Therefore, we propose that, while cardiac ISRmt can be a protective response in the short term, when it becomes chronic it causes detrimental metabolic imbalances.
ISRmt can be triggered by intrinsic and extrinsic stimuli, including mitochondrial bioenergetic dysfunction and faulty mitochondrial protein import, resulting in proteotoxic stress (Anderson and Haynes, 2020). We found that large CHCHD10 protein aggregates accumulate in D10S55L heart mitochondria at 30 days. However, at this young age, they do not yet reach the threshold to cause full ISRmt. Interestingly, increased expression of the myokine Gdf15 at 30 days precedes Atf4/5 upregulation, which occurs at 75 days, and recapitulates early ISRmt transcriptional changes seen in myopathy models (Forsstrom et al., 2019). CHCHD10 aggregates build up as the disease progresses, causing ISRmt at 75 days, and persist, despite the increased expression of mitochondrial quality control systems, which fail to control mitochondrial protein aggregation and proteotoxicity. Importantly, both protein aggregation and ISRmt precede OXPHOS dysfunction, indicating that proteotoxic stress, rather than bioenergetic impairment, triggers ISRmt. This interpretation partially agrees with previous findings in the heart of a DARS2 knockout mouse model, in which an imbalance between nuclear- and mtDNA-encoded OXPHOS subunits triggers the ISRmt (Dogan et al., 2014). However, unlike the DARS2 mouse, D10S55L hearts activate the ISRmt despite normal OXPHOS complex levels, indicating that the ISRmt is triggered by aggregated proteins that are not directly involved in OXPHOS. Furthermore, we demonstrate here that CoQ alterations in the D10S55L heart precede OXPHOS dysfunction, unlike in mouse models with mtDNA gene expression impairment, in which CoQ defects develop in response to OXPHOS defects (Kuhl et al., 2017).
Eventually, cardiac OXPHOS deficiency arises at 325 days in D10S55L mice (Anderson et al., 2019), which may contribute to the fatal impairment of heart function. We find a marked increase in the heme degradation pathway and a loss of heme at early disease stages. At later time points, the expression of key enzymes involved in ISC biogenesis becomes downregulated. Although we have not measured ISC levels, we can speculate that the additive effects of heme and ISC deficiency contribute to OXPHOS dysfunction, as both heme and ISCs are necessary for the assembly and function of OXPHOS enzymes. We propose that at early disease stages, the downregulation of OXPHOS genes alone is insufficient to cause overt OXPHOS defects, but upon a decline in heme and ISC biogenesis, mitochondrial respiratory defects arise, causing bioenergetic impairment and contributing to heart failure. At this point, glycolysis is recruited for energy generation and can no longer support serine metabolism, resulting in the inability to maintain adequate compensatory 1C metabolism upregulation.
The combination of increased GSH biosynthesis and antioxidant gene expression and protein glutathionylation suggests that D10S55L hearts mount an antioxidant response. However, contrary to expectations, D10S55L respiring mitochondria emit less H2O2 than controls, suggesting that they are not a major source of oxidative stress. Instead, the increased expression of NADPH oxidases Nox2/4 could promote oxidative stress. When ATF4 is elevated, the heart upregulates Nox4 as an attempt to modulate energy metabolism by increasing fatty acid oxidation (Nabeebaccus et al., 2017). NOX4 induction has been described in models of hypertrophic cardiomyopathy (Chen et al., 2012), but the protective or deleterious roles of NOX4 upregulation are still debated. We surmise that, while in the short term, NOX4 may have cardioprotective functions (Schroder et al., 2012), chronic induction of NOX enzymes may become detrimental by forcing the heart to activate antioxidant mechanisms. Such mechanisms can contribute to metabolic remodeling and iron dysregulation. We deem that metabolic imbalance could stem from low levels of NADPH, which is consumed by NOX2/NOX4, leading to reduced NADPH availability for GSH reduction and taurine biosynthesis. The loss of cardioprotective taurine is an example of how adaptive metabolic rewiring can become detrimental in the heart. This hypothesis could be tested by modulating NOX2/4 genetically or pharmacologically and assessing the effects on metabolic rewiring and cardiomyopathy in D10S55L mice.
In conclusion, this study reveals a sequence of pathogenic events that extend beyond the previously described effects of mitochondrial stress in the heart. Unlike other models of mitochondrial cardiomyopathy, in D10S55L mice, the initial stress is unrelated to OXPHOS impairment. Our model suggests that the aggregation of mutant proteins induces proteotoxic ISRmt and alters the redox state of D10S55L hearts. In turn, redox imbalance triggers metabolic rewiring to support GSH biosynthesis, subtracting intermediates of the methionine cycle, thereby causing nucleotide imbalance and mtDNA depletion. Furthermore, redox imbalance elicits a NRF2-driven antioxidant response that leads to heme degradation. Together with ISRmt-induced repression of OXPHOS and ISC assembly genes, these processes culminate in mitochondrial bioenergetic dysfunction. Once mitochondria become unable to produce sufficient ATP through OXPHOS, the glycolytic system becomes overburdened and incapable of simultaneously meeting energy demands and providing intermediates for serine biosynthesis (Figure 7E). Taken together, our findings suggest that primary mitochondrial cardiomyopathies with ISRmt could be ameliorated by metabolic supplementation—for example, with folic acid to fuel 1C metabolism and cysteine donors for GSH biosynthesis. In addition, enhancing NAD levels with NAD precursors (Zhang et al., 2016) or niacin administration (Pirinen et al., 2020) was shown to be beneficial in mouse models and human cases of mitochondrial myopathy with ISRmt and could be considered in the treatment of mitochondrial cardiomyopathies. Such metabolically targeted treatments, albeit not curative, could prove to be efficacious in the treatment of mitochondrial cardiomyopathy, as they may help to prevent the depletion of key metabolites.
Limitations of the study
Although this study demonstrates the coexistence of CHCHD10 and CHCHD2 heart mitochondrial aggregation and ISRmt, the molecular mechanisms of mutant CHCHD10 mitochondrial proteotoxicity remain to be elucidated. This study uses whole heart tissue for biochemical and multi-omics studies; therefore, it does not address the effects of mutant CHCHD10 in specific cardiac regions and cell types. In addition, this study does not investigate the metabolic effects of mutant CHCHD10 in tissues other than heart tissue, and therefore a contribution of other organs to CHCHD10 cardiomyopathy cannot be excluded. D10S55L cardiomyopathy is investigated starting at 30 days of age, but there could be developmental or early post-natal molecular defects that have not been yet characterized.
STAR★METHODS
RESOURCE AVAILABILITY
Lead contact
More information and requests for resources and reagents should be directed to and will be fulfilled by the lead contact, Giovanni Manfredi (gim2004@med.cornell.edu).
Materials availability
This study did not generate new materials or reagents and there are no restrictions to their availability.
Data and code availability
Transcriptomics data are available through Gene Expression Omnibus gene repository with the dataset identifier GEO: GSE193801. The mass spectrometry proteomics data have been deposited to the ProteomeXchange Consortium via the PRIDE partner repository with the dataset identifier PRIDE: PXD031444. Metabolomics data were deposited to the Metabolomics Workbench with the study ID: ST002068.
This paper does not report original code.
Any additional information required to reanalyze the data reported in this paper is available from the lead contact upon request.
EXPERIMENTAL MODEL AND SUBJECT DETAILS
All animal procedures were conducted in accordance with Weill Cornell Medicine Animal Care and Use Committee and were performed according to the Guidelines for the Care and Use of Laboratory Animals of the National Institutes of Health. CRISPR/Cas9-generated CHCHD10S55L knock-in mice were previously generated (Anderson et al., 2019), available as Stock #028952 from the Jackson Laboratory; www.jax.org) and maintained through breeding heterozygous males with WT C57BL/6NJ females (available as Stock #005304 from the Jackson Laboratory; www.jax.org). Mice were euthanized by cervical dislocation. The number of animals (biological replicates) for transcriptomics was 5/genotype (3 males and 2 females) at 75d, 6 WT (2 males and 4 female mice) and 5 D10S55L (3 males and 2 females) mice at 125d, 7 WT (3 males and 4 females) and 5 D10S55L (3 males and 2 females) at 225, and 2 WT and 4 D10S55L (all females) at 325d. Biological replicates for transcriptomics at 30d was 3/genotype (all males). Biological replicates for proteomics were 4/genotype (all males). Biological replicates for metabolomics were 5/genotype (3 males and 2 females) at 75d, 6 (2 males and 4 females for WT and 4 males and 2 females for D10S55L) at 125d, 5 WT (3 males and 2 females) and 5 D10S55L (3 males and 2 females) at 225d, and 6 WT (2males and 4 females) and 6 D10S55L (3 males and 3 females) at 325d.
METHOD DETAILS
RNA sequencing
RNA was extracted from heart tissue using TRIzol (Life Technology) and the RNeasy Mini Kit (Qiagen). 3′RNAseq libraries were prepared from 500 ng of RNA per sample using the Lexogen QuantSeq 3′ mRNA-Seq Library Prep Kit FWD for Illumina and pooled for reduced run variability. Libraries were sequenced with single-end 86 bps on an Illumina NextSeq500 sequencer (Cornell Genomics Facility). Raw sequence reads were processed using the BBDuk program in the BBMap package. Trimmed reads were aligned to the mouse genome assembly GRCm38.p6 using the STAR aligner (version 2.5.0a). SAM files were converted to BAM to read overlapping reads per gene using HTSeq-count (version 0.6.1) (Anders et al., 2015). The R package DESeq2 (version 1.30.0) (Love et al., 2014) was used to obtain both normalized and variance stabilized counts, as well as for principal components analysis.
Proteomics
Proteins were extracted from heart tissue and quantified using the Bradford assay (Bio-Rad). Samples were tryptic digested, labeled with TMT-16plex, and then combined. The combined TMT-labeled peptides were desalted and fractionated before being subjected to LC/MS analysis (Weill Cornell Medicine Meyer Cancer Center Proteomics & Metabolomics Core Facility). Mass spectrometry-generated raw data were searched against Uniprot mouse database using MaxQuant.
Metabolomics
15 mg of cardiac tissue was homogenized in 80% methanol (Sigma) using Tissue Tearer (BioSpec) on dry ice. Samples were incubated at –80◦C for 4 hours. Homogenates were then centrifuged at 14,000 rfc for 20 min at 4◦C. The supernatant was extracted and stored at –80◦C for mass spectroscopy (Weill Cornell Medicine Meyer Cancer Center Proteomics & Metabolomics Core Facility). Peak intensities for metabolites were screened for missing values and analyzed by using MetaboAnalyst software (version 5.0).
Isolation of mitochondria
Coupled heart mitochondria were freshly isolated as previously described (Gostimskaya and Galkin, 2010) with minor adjustments. Briefly, whole mouse hearts were minced on ice, washed, and incubated in 0.01% Trypsin-EDTA (Invitrogen) in PBS (ThermoScientific Scienfitic) on ice for 30 min. Tissue was then rinsed and homogenized 40 times using a small glass homogenizer with MS-EGTA buffer (225 mM D-mannitol, 75 mM sucrose, 20 mM Hepes, 1mM EGTA, 1 mg/mL fatty-acid-free BSA, pH 7.4). Heart homogenate was subjected to differential centrifugation to obtain fractions containing intact mitochondria, used for all bioenergetic studies. Mitochondrial proteins were quantified using the Bradford protein assay (Bio-Rad).
Measurement of oxygen consumption
Oxygen consumption was measured with 200 µg of freshly isolated heart mitochondria at 37◦C using an Oxytherm Oxygraph (Hansatech) as previously described (Burstein et al., 2018). Oxygen consumption was measured with specific substrates for either complex I (2 mM malate, 5 mM pyruvate) or complex II (5 mM succinate, 2 mM glutamate) in MS-EGTA buffer with 2 mM K3PO4 and 1 mM MgCl2.
Measurement of ATP synthesis
ATP synthesis was measured in freshly isolated heart mitochondria using a rapid kinetic luciferase-luciferin assay and detected with the Optocomp I (MGM Instruments) as previously described (Vives-Bauza et al., 2007). Briefly, ATP synthesis rates were measured at room temperature using 50 µg of energized mitochondria with either complex I (190 mM pyruvate, 190 mM malate) or complex II (190 mM succinate) substrates in ATP synthesis buffer (6 mM diasdenosine pentaphosphate, 150 mM KCl, 25 mM Tris-HCl, 2 mM EDTA, 10 mM K3PO4, 0.1 mM MgCl2, 1 mg/mL fatty-acid-free BSA, pH 7.4). For complex II-driven ATP synthesis measurements, 100 µM rotenone was added to inhibit complex I activity. A calibration curve was calculated based on known ATP concentrations and was used to determine the rate of ATP synthesis in each sample expressed as nmol ATP/min/mg protein.
Measurement of H2O2 emission
H2O2 emission from freshly isolated heart mitochondria was measured using the single cuvette F-7000 Fluorescence Spectrophotometer (Hitachi) as previously described (Starkov, 2010). Briefly, H2O2 emission was measured at 37◦C using 100 µg of energized mitochondria with complex II (5 mM succinate, 2 mM glutamate) substrates in MS-EGTA buffer. Fluorescence was measured in the presence of horseradish peroxidase (Sigma) and Amplex UltraRed (ThermoFisher Scientific) and calibrated with known concentrations of H2O2 (Sigma) to determine the rate of H2O2 production expressed as pmol H2O2/min/mg protein.
Measurement of heme
Total heme was measured by incubating 400 µg heart mitochondria in 500 µL 2M oxalic acid at 95◦C for 30 min. Samples were centrifuged for at 1,000 x g at 4◦C for 10 min to remove debris. 200 µL of the supernatant was transferred to a black 96-well plate clear bottomed microplate (Greiner Bio-One) and fluorescence was assessed at ex 404 nm/em 630 nm using a microplate reader (Molecular Devices, SpectraMAX).
Measurement of total iron
Total iron was measured in heart mitochondrial fractions as previously described (Cloonan et al., 2016), with minor adjustments. 400 µg of heart mitochondria were incubated with 50 µL of 50% nitric acid (in water) with 0.1% digitonin (Sigma). Samples were heated at 70◦C for two hours in a hot block in a fume hood. Samples were then removed from heat and allowed to cool, followed by centrifugation at 6,000 x g for 5 min. Digested lysates are diluted at 1:20–1:100 in water and measured by graphite furnace atomic absorption spectroscopy and iron (Sigma) concentration was calculated from a standard curve and expressed as mg iron/µL.
Measurement of CoQ9
CoQ9 was extracted from heart tissue in 100% 1-propanol (Sigma) and measured as previously described(Kleiner et al., 2018). The lipid component of the extract was separated by high-performance liquid chromatography on a reverse-phase Waters Symmetry C18 3.5pm, 4.6 3 150mm (Waters Corp.), using a mobile phase consisting of methanol, ethanol, 2-propanol, acetic acid (500:470:15:155), and 50 mM sodium acetate (Sigma) at a flow rate of 0.8 mL/min. The electrochemical detector, ESA Coulochem II (ESA Inc.), was used with the following settings: guard cell (upstream of the injector) at 650 mV, conditioning cell at 650 mV (downstream of the column), followed by the analytical cell at +450 mV. CoQ9 (Frontier Specialty Chemicals) concentration was estimated by comparison of the peak area with those of standard solutions of known concentration and expressed in ng/mg tissue.
Western blotting
Total, cytosolic and mitochondrial-enriched fractions were isolated from heart tissue by differential centrifugation. Protein concentration was determined by the Bradford protein assay (Bio-Rad). Total (25 µg), cytosolic (25 µg) and mitochondrial (5 µg) fractions were denatured in 1X Laemmli Buffer (Bio-Rad) containing 2-Mercaptoethanol (Sigma) at 95◦C for 10 min and separated by electrophoresis in a 4–12% SDS–PAGE gel (Bio-Rad) and transferred to a PVDF membrane (Bio-Rad). Blots were incubated in 3% BSA in TBS with 1% Tween 20 (TBST) for one hour at room temperature. Primary antibodies were incubated overnight at 4◦C. Secondary antibodies were incubated for 45 min at room temperature. For protein glutathionylation experiments, samples were denatured, without the addition of 2-Mercaptoethanol (Sigma), and not exposed to heat prior to loading and running electrophoresis. Protein glutathionylation blots were incubated with anti-GSH overnight at 4◦C, followed by secondary antibody incubation at room temperature for one hour. In all blots, proteins were detected using Clarity Western ECL Blotting Substrates (Bio-Rad) and imaged on ChemiDoc Touch (Bio-Rad). The antibodies used are described in key resources table.
KEY RESOURCES TABLE
| REAGENT or RESOURCE | SOURCE | IDENTIFIER |
|---|---|---|
| Antibodies | ||
| Rabbit anti-CHCHD10 (1:500) | ProteinTech | Cat# 25671-AP; RRID: AB_2880187 |
| Rabbit anti-CHCHD2 (1:500) | ProteinTech | Cat# 19424-AP; RRID: AB_10638907 |
| Mouse anti-Tim23 (1:1000) | BD Transduction Lab | Cat# 611222; RRID: AB_398754 |
| Mouse anti-VDAC1 (1:1000) | NeuroMabs | Cat# 73–204; RRID: AB_10673517 |
| Rabbit anti-Cyclophilin D (1:000) | Calbiochem | Cat# 239784; RRID: AB_2169445 |
| Mouse anti-GSH (1:500) | Virogen | Cat# 101A; RRID: N/A |
| Rabbit anti-CLPX (1:1000) | Abcam | Cat# ab168338; RRID: N/A |
| Rabbit anti-LONP1 (1:1000) | Abcam | Cat# ab103809; RRID: AB_10858161 |
| Rabbit anti-PMPCB (1:1000) | ProteinTech | Cat# 16064–1-AP; RRID: AB_2167122 |
| Rabbit anti-LC3B (1:1000) | Sigma | Cat# L7543; RRID: AB_796155 |
| Rabbit anti-STOML2 (1:500) | ProteinTech | Cat# 10348–1-AP; RRID: AB_2286822 |
| Rabbit anti-PHB2 (1:500) | Cell Signaling | Cat# 14085; RRID: AB_2798387 |
| Rabbit anti-PRDX4 (1:1000) | Sigma | Cat# SAB4301759; RRID: N/A |
| Rabbit anti-COX6A1 (1:500) | ProteinTech | Cat# 11460–1-AP; RRID: AB_2085445 |
| Rabbit anti-SLC25A20 (CACT) (1:1000) | ProteinTech | Cat# 19363–1-AP; RRID: AB_10642001 |
| Rabbit anti-MAT2B (1:500) | ProteinTech | Cat# 15952–1-AP; RRID: AB_10637268 |
| Rabbit anti-MTR (1:500) | ProteinTech | Cat# 25896–1-AP; RRID: AB_2880287 |
| Rabbit anti-GMPR1/2 (1:500) | ProteinTech | Cat# 15683–1-AP; RRID: AB_2111072 |
| Rabbit anit-ADK (1:5000) | ProteinTech | Cat# 66929–1-Ig; RRID: AB_2882255 |
| Rabbit anti-GMPS (1:500) | ProteinTech | Cat# 16376–1-AP; RRID: AB_2232412 |
| Rabbit anti-Peroirdoxin 2 (PRDX2) (1:1000) | ProteinTech | Cat# 10545–2-AP; RRID: AB_2168202 |
| Goat anti-HSP60 (1:1000) | Enzo Life Sciences | Cat# ADI-SPA828; RRID: AB_10615201 |
| Sheep anti-NOGO-B (RTN4) (1:500) | R&D Systems | Cat# AF6034; RRID: AB_10573837 |
| HRP Donkey anti-Goat (1:10000) | Jackson ImmunoResearch | Cat# 705–035-003; RRID: AB_2340390 |
| HRP Goat anti-Mouse (1:5000–10000) | Jackson ImmunoResearch | Cat# 115–035-146; RRID: AB_2307392 |
| HRP Goat anti-Rabbit (1:5000–10000) | Jackson ImmunoResearch | Cat# 111–035-144; RRID: AB_2307391 |
| HRP Donkey anti-Sheep (1:5000) | Jackson ImmunoResearch | Cat# 713–035-003; RRID: AB_2340709 |
|
Chemicals, peptides, and recombinant proteins | ||
| TRIzol | Life Technology | Cat# 15596–026 |
| Methanol | VWR | Cat# BDH1135–4LP |
| Trypsin-EDTA | Invitrogen | Cat# 25200–072 |
| PBS (10X), pH 7.4 | ThermoFisher Scientific | Cat# 70011044 |
| Malate | Sigma | Cat# 46940-U |
| Pyruvate | Sigma | Cat# P2256 |
| Succinate | Sigma | Cat# W327700 |
| Glutamate | Sigma | Cat# 49621 |
| D-mannitol, BioUltra | Sigma | Cat# M4125 |
| Sucrose, BioUltra | Sigma | Cat# 84097 |
| Hepes | Sigma | Cat# H3375 |
| EGTA | Sigma | Cat# E4378 |
| EDTA | Sigma | Cat# EDS |
| SF-6847 | Selleckchem | Cat# S2895 |
| Carboxyatractyloside potassium salt | Sigma | Cat# C4992 |
| BSA, essentially fatty acid free | Sigma | Cat# A6003 |
| BSA | Sigma | Cat# A7906 |
| Amplex UltraRed Reagent | ThermoFisher Scientific | Cat# A36006 |
| Horseradish peroxidase | Sigma | Cat# P6782 |
| Tween-20 | Sigma | Cat# P7949 |
| NP-40 | BioChemika | Cat# 74385 |
| Maxima SYBR Green/ROX qPCR Master Mix (2X) | ThermoFisher Scientific | Cat# K0222 |
| ATP | Sigma | Cat# 8937 |
| ADP | Sigma | Cat# A5285 |
| Diadenosine pentaphosphate | Sigma | Cat# D4022 |
| MgCl2 | ThermoFisher Scientific | Cat# AM9530G |
| KCl | Sigma | Cat# 58221 |
| Tris-HCl | Sigma | Cat# 10812846001 |
| Rotenone | Sigma | Cat# R8875 |
| Hydrogen peroxide | Sigma | Cat# H1009 |
| 1-propanol | Sigma | Cat# 09158 |
| 2-propanol | Sigma | Cat# I9516 |
| Ethanol | Sigma | Cat# E7023 |
| Acetic acid | Sigma | Cat# A6283 |
| Sodium acetate Anhydrous | ThermoFisher Scientific | Cat# S210–500 |
| Coenzyme Q9 | Frontier Specialty Chemicals | Cat# JK158165 |
| Oxalic acid | Sigma | Cat# 75688 |
| Nitric acid | VWR | Cat# 87003–261 |
| Digitonin | Sigma | Cat# D141 |
| NaCl | Sigma | Cat# S9888 |
| Imidazole HCl | Sigma | Cat# L143073 |
| Bis-Tris | Sigma | Cat# B9754 |
| 6-aminohexanoic acid | Sigma | Cat# 07260 |
| SimplyBlue SafeStain | ThermoFisher Scientific | Cat# LC6060 |
| Carbonyl iron | Sigma | Cat# C3518 |
| 4X Laemmli Sample Buffer | Bio-Rad | Cat# 1610747 |
| 2-Mercaptoethanol | Sigma | Cat# M6250 |
|
Critical commercial assays | ||
| Protein Carbonyl Assay Kit (Western Blot) | Abcam | Cat# ab178020 |
| Lipid Peroxidation (MDA) Assay Kit | Abcam | Cat# ab118970 |
| RNeasy Micro Kit | Qiagen | Cat# 74104 |
| ImProm-II Reverse Transcriptase System | Promega | Cat# A3800 |
| Quick Start Bradford Protein Assay | Bio-Rad | Cat# 500–0201 |
| Wizard Genomic DNA Purification Kit | Promega | Cat# A1120 |
| Bradford Protein Assay | Bio-Rad | Cat# 5000001 |
|
Deposited data | ||
| Mouse heart RNA-seq data | Gene Expression Omnibus gene repository | GEO: GSE193801 |
| Mouse heart metabolomics data | Metabolomics Workbench | Study ID: ST002068 |
| Mouse heart proteomics data | ProteomeXchange | Identifier: PDX031444 |
|
Experimental models: Organisms/strains | ||
| C57BL/6NJ-Chchd10em8Lutzy/J | The Jackson Laboratory | Stock No. 028952 |
|
Software and algorithms | ||
| Prism v9 | GraphPad Software | N/A |
| Fiji/ImageJ software | NIH | N/A |
| Image Studio | LI-COR Biosciences | N/A |
| Image Lab | Bio-Rad | N/A |
| R | The R Foundation | N/A |
| STAR aligner v2.5.0a | GenSoft | N/A |
| HTSeq-count v0.6.1 | Simon Anders | N/A |
| DESeq2 v1.30.0 | Bioconductor | N/A |
| MetaboAnalyst v5.0 | Jianguo Xia | N/A |
Filter trap assay
Insoluble protein aggregates were detected by filter trap assay as previously described (Palomo et al., 2018). Briefly, 25 µg of total homogenate and cytosolic fractions, and 5 µg of mitochondrial fractions were solubilized with 0.5% NP-40 in PBS for 15 min on ice. Samples were loaded onto a Bio-Dot Microfiltration apparatus (Bio-Rad) containing a cellulose acetate membrane (0.2 µm pore diameter, Whatman). Vacuum was applied to pass samples through the membrane, which was then was washed with 1% Tween-20 in PBS. Trapped proteins were detected with antibodies Rabbit anti-CHCHD10 (ProteinTech, 1:500) or Rabbit anti-CHCHD2 (ProteinTech, 1:500). Blots were then imaged as described above.
Blue native PAGE
Mitochondrial protein complexes were isolated from heart mitochondria as previously described (Wittig et al., 2006). Briefly, 400 µg mitochondria was solubilized in buffer (50 mM sodium chloride, 50 mM imizadole HCl, 50 mM Bis-Tris, 2 mM 6-aminohexanoic acid, 1 mM EDTA) followed by digestion with 20% digitonin (Sigma). Samples were loaded in a NativePAGE 4–16% gel (Invitrogen) with dark blue cathode buffer and clear anode buffer. Samples were run at 150V for 2 hours and then the gel was rinsed in water and stained with SimplyBlue SafeStain (ThermoFisher Scientific) for 1 hour and rinsed again. The gel was then incubated overnight in 700 mM NaCl (Sigma) to remove excess stain and imaged the following day using a light box.
Protein carbonylation assay
The levels of protein carbonyl groups were assessed using the Protein Carbonyl Assay Kit (Abcam) according to manufacturer’s instructions. Briefly, 3 mg/mL solubilized heart protein samples were diluted 1:1 with 12% SDS (final concentration 6% SDS) and then incubated with either DNPH or Derivatization Control Solution for 15 minutes at room temperature, then neutralized. Equal amounts of sample and the DNP-BSA positive control were loaded into a 4–12% SDS–PAGE gel without denaturing or heat application. Samples were blocked in 5% BSA TBST followed by overnight incubation at 4◦C with anti-DNP antibody. The following day blots were washed and incubated with 1X HRP conjugated Secondary Antibody at room temperature for 1 hour. Blots were imaged as described above.
Lipid peroxidation assay
Lipid peroxidation was measured using the Lipid Peroxidation (MDA) Assay kit (Abcam) according to manufacturer’s instructions. Briefly, 60 mg of solubilized heart protein samples were incubated with TBA reagent at 95◦C for 60 min, then brought to room temperature, generating MDA-TBA adduct. Samples were then added to a 96-well microplate and absorbance was measured using a microplate reader (Molecular Devices, SpectraMAX) at 532 nm wavelength. Absorbance was normalized to a standard curve of known MDA concentrations and data were expressed as nmol MDA/mg protein.
qPCR
RNA was extracted from heart tissue using Trizol-chloroform precipitation and the RNeasy Mini Kit (Qiagen). cDNA was generated using the ImProm-II Reverse Transcription System (Promega) according to manufacturer’s instructions. Quantitative real-time PCR (qPCR) amplification of cDNA was performed with the SYBR Green PCR Master Mix (ThermoFisher Scientific) on a QuantStudio 6 Flex Real-Time PCR system (ThermoFisher Scientific). Standard cycling parameters were used, and relative expression was normalized to β-actin. mRNA expression levels were quantified using the following primers: Chchd10 forward: 5′-CACTCAGAGCGACC-TAACCC-3′, reverse: 5′-GGAGCTCAGACCGTGATTGT-3′; Chchd2 forward: 5′-ATTGCTTTGGAATGGCCGTG-3′, reverse: 5′-GGCC AAACACTTCCCCAGTA-3′; β-actin forward: 5′-ATGCTCCCCGGGCTGTAT-3′, reverse: 5′-CATAGGAGTCCTTCTGACCCATTC-3′.
mtDNA levels analysis
DNA was extracted from heart tissue using Wizard Genomic DNA Purification Kit (Promega) according to manufacturer’s instructions. mtDNA was measured by qPCR as previously described (Tyynismaa et al., 2005) with 25 ng of DNA and the SYBR Green PCR Master Mix (ThermoFisher Scientific) on a QuantStudio 6 Flex Real-Time PCR system (ThermoFisher Scientific). mtDNA was quantified by normalizing the amplification of mitochondrial Mtrnr1 to the transcript of nuclear Rbm15. The following formula, 2*2^(Ct[Rbm15]—Ct[Mtrnr1]), was used to calculate mtDNA levels. The following primers were used: Mtrnr1 forward: 5′-AGGAGCCTGTTCTATAATCGATAAA-3′, reverse: 5′-GATGGCGGTATATAGGCTGAA-3′; Rbm15 forward: 5′-GGACACTTTTCTTGGGCAAC-3′, reverse: 5′-AGTTTGGCCCT GTGAGACAT-3’
QUANTIFICATION AND STATISTICAL ANALYSIS
All numerical data are expressed as mean ± standard deviation. Statistical comparisons were made in GraphPad Prism (GraphPad Software Inc.). For differential expression analyses, Two-tail unpaired student’s t-tests were used for sample comparisons. Corrected p values were calculated based on the Benjamini–Hochberg method to adjust for multiple comparisons. Differences were considered statistically significant for p < 0.05. Biological replicates information for each experiment, including mice age and sex, can be found in the experimental model and subject details section. All other biological replicate numbers are indicated in the figure legends.
Supplementary Material
Highlights.
Mutant CHCHD10 induces mitochondrial protein aggregation and ISRmt in mouse heart
Chronic cardiac ISRmt causes imbalanced nucleotide metabolism and mtDNA depletion
ISRmt and metabolic imbalance precede OXPHOS dysfunction in CHCHD10 mutant heart
NOX upregulation and oxidative stress trigger heme depletion and iron dysregulation
ACKNOWLEDGMENTS
We thank the Weill Cornell Medicine Meyer Cancer Center Proteomics & Metabolomics Core Facility and the Cornell Genomics Facility for their contributions. We acknowledge funding support of the Muscular Dystrophy Association grant MDA602894 (to G.M.), NIH NINDS grant 1R01NS112672–01 (to G.M.), NIH Diversity supplement NS112672–02S1 (To N.S.), NIH NRSA Individual Predoctoral Fellowship (Parent F31) grant 1 F31 HL154651–01A1 (to N.M.S.), Science Foundation Ireland Future Research Leaders grant FRL4862 (to S.C.), and DOD CDMRP PR190511 grant 12894332 (to C.Q.). Graphical figures were designed with BioRender.com.
Footnotes
SUPPLEMENTAL INFORMATION
Supplemental information can be found online at https://doi.org/10.1016/j.celrep.2022.110475.
DECLARATION OF INTERESTS
The authors declare no competing interests.
INCLUSION AND DIVERSITY
We worked to ensure sex balance in the selection of non-human subjects. One or more of the authors of this paper self-identifies as an underrepresented ethnic minority in science. One or more of the authors of this paper received support from a program designed to increase minority representation in science.
REFERENCES
- Ajroud-Driss S, Fecto F, Ajroud K, Lalani I, Calvo SE, Mootha VK, Deng HX, Siddique N, Tahmoush AJ, Heiman-Patterson TD, et al. (2015). Mutation in the novel nuclear-encoded mitochondrial protein CHCHD10 in a family with autosomal dominant mitochondrial myopathy. Neurogenetics 16, 1–9. [DOI] [PMC free article] [PubMed] [Google Scholar]
- Anders S, Pyl PT, and Huber W (2015). HTSeq–a Python framework to work with high-throughput sequencing data. Bioinformatics 31, 166–169. [DOI] [PMC free article] [PubMed] [Google Scholar]
- Anderson CJ, Bredvik K, Burstein SR, Davis C, Meadows SM, Dash J, Case L, Milner TA, Kawamata H, Zuberi A, et al. (2019). ALS/FTD mutant CHCHD10 mice reveal a tissue-specific toxic gain-of-function and mitochondrial stress response. Acta Neuropathol 138, 103–121. [DOI] [PMC free article] [PubMed] [Google Scholar]
- Anderson NS, and Haynes CM (2020). Folding the mitochondrial UPR into the integrated stress response. Trends Cell Biol 30, 428–439. [DOI] [PMC free article] [PubMed] [Google Scholar]
- Bajic VP, Van Neste C, Obradovic M, Zafirovic S, Radak D, Bajic VB, Essack M, and Isenovic ER (2019). Glutathione “redox homeostasis” and its relation to cardiovascular disease. Oxid. Med. Cell Longev 2019, 5028181. [DOI] [PMC free article] [PubMed] [Google Scholar]
- Bertero E, and Maack C (2018). Metabolic remodelling in heart failure. Nat. Rev. Cardiol 15, 457–470. [DOI] [PubMed] [Google Scholar]
- Boos F, Labbadia J, and Herrmann JM (2020). How the mitoprotein-induced stress response safeguards the cytosol: a unified view. Trends Cell Biol 30, 241–254. [DOI] [PubMed] [Google Scholar]
- Brunel-Guitton C, Levtova A, and Sasarman F (2015). Mitochondrial diseases and cardiomyopathies. Can J. Cardiol 31, 1360–1376. [DOI] [PubMed] [Google Scholar]
- Bulmer AC, Bakrania B, Du Toit EF, Boon AC, Clark PJ, Powell LW, Wagner KH, and Headrick JP (2018). Bilirubin acts as a multipotent guardian of cardiovascular integrity: more than just a radical idea. Am. J. Physiol. Heart Circ. Physiol 315, H429–H447. [DOI] [PubMed] [Google Scholar]
- Burstein SR, Valsecchi F, Kawamata H, Bourens M, Zeng R, Zuberi A, Milner TA, Cloonan SM, Lutz C, Barrientos A, et al. (2018). In vitro and in vivo studies of the ALS-FTLD protein CHCHD10 reveal novel mitochondrial topology and protein interactions. Hum. Mol. Genet 27, 160–177. [DOI] [PMC free article] [PubMed] [Google Scholar]
- Chen C, and Paw BH (2012). Cellular and mitochondrial iron homeostasis in vertebrates. Biochim. Biophys. Acta 1823, 1459–1467. [DOI] [PMC free article] [PubMed] [Google Scholar]
- Chen EY, Tan CM, Kou Y, Duan Q, Wang Z, Meirelles GV, Clark NR, and Ma’ayan A (2013). Enrichr: interactive and collaborative HTML5 gene list enrichment analysis tool. BMC Bioinformatics 14, 128. [DOI] [PMC free article] [PubMed] [Google Scholar]
- Chen F, Haigh S, Barman S, and Fulton DJ (2012). From form to function: the role of Nox4 in the cardiovascular system. Front. Physiol 3, 412. [DOI] [PMC free article] [PubMed] [Google Scholar]
- Chen Q, Kirk K, Shurubor YI, Zhao D, Arreguin AJ, Shahi I, Valsecchi F, Primiano G, Calder EL, Carelli V, et al. (2018). Rewiring of glutamine metabolism is a bioenergetic adaptation of human cells with mitochondrial DNA mutations. Cell Metab 27, 1007–1025 e1005. [DOI] [PMC free article] [PubMed] [Google Scholar]
- Christie DA, Lemke CD, Elias IM, Chau LA, Kirchhof MG, Li B, Ball EH, Dunn SD, Hatch GM, and Madrenas J (2011). Stomatin-like protein 2 binds cardiolipin and regulates mitochondrial biogenesis and function. Mol. Cell Biol 31, 3845–3856. [DOI] [PMC free article] [PubMed] [Google Scholar]
- Cloonan SM, Glass K, Laucho-Contreras ME, Bhashyam AR, Cervo M, Pabon MA, Konrad C, Polverino F, Siempos II, Perez E, et al. (2016). Mitochondrial iron chelation ameliorates cigarette smoke-induced bronchitis and emphysema in mice. Nat. Med 22, 163–174. [DOI] [PMC free article] [PubMed] [Google Scholar]
- Dogan SA, Pujol C, Maiti P, Kukat A, Wang S, Hermans S, Senft K, Wibom R, Rugarli EI, and Trifunovic A (2014). Tissue-specific loss of DARS2 activates stress responses independently of respiratory chain deficiency in the heart. Cell Metab 19, 458–469. [DOI] [PubMed] [Google Scholar]
- El-Hattab AW, and Scaglia F (2016). Mitochondrial cardiomyopathies. Front. Cardiovasc. Med 3, 25. [DOI] [PMC free article] [PubMed] [Google Scholar]
- Fornuskova D, Stiburek L, Wenchich L, Vinsova K, Hansikova H, and Zeman J (2010). Novel insights into the assembly and function of human nuclear-encoded cytochrome c oxidase subunits 4, 5a, 6a, 7a and 7b. Biochem. J 428, 363–374. [DOI] [PubMed] [Google Scholar]
- Forsstrom S, Jackson CB, Carroll CJ, Kuronen M, Pirinen E, Pradhan S, Marmyleva A, Auranen M, Kleine IM, Khan NA, et al. (2019). Fibroblast growth factor 21 drives dynamics of local and systemic stress responses in mitochondrial myopathy with mtDNA deletions. Cell Metab 30, 1040–1054 e1047. [DOI] [PubMed] [Google Scholar]
- Gammella E, Recalcati S, Rybinska I, Buratti P, and Cairo G (2015). Iron-induced damage in cardiomyopathy: oxidative-dependent and independent mechanisms. Oxid. Med. Cell Longev 2015, 230182. [DOI] [PMC free article] [PubMed] [Google Scholar]
- Genin EC, Madji Hounoum B, Bannwarth S, Fragaki K, Lacas-Gervais S, Mauri-Crouzet A, Lespinasse F, Neveu J, Ropert B, Auge G, et al. (2019). Mitochondrial defect in muscle precedes neuromuscular junction degeneration and motor neuron death in CHCHD10(S59L/+) mouse. Acta Neuropathol 138, 123–145. [DOI] [PubMed] [Google Scholar]
- Gostimskaya I, and Galkin A (2010). Preparation of highly coupled rat heart mitochondria. J. Vis. Exp, 2202. [DOI] [PMC free article] [PubMed]
- Grynberg A, and Demaison L (1996). Fatty acid oxidation in the heart. J. Cardiovasc. Pharmacol 28, S11–S17. [DOI] [PubMed] [Google Scholar]
- Gustafsson AB, and Gottlieb RA (2008). Heart mitochondria: gates of life and death. Cardiovasc. Res 77, 334–343. [DOI] [PubMed] [Google Scholar]
- Hansen KG, and Herrmann JM (2019). Transport of proteins into mitochondria. Protein J 38, 330–342. [DOI] [PubMed] [Google Scholar]
- Hathazi D, Griffin H, Jennings MJ, Giunta M, Powell C, Pearce SF, Munro B, Wei W, Boczonadi V, Poulton J, et al. (2020). Metabolic shift underlies recovery in reversible infantile respiratory chain deficiency. EMBO J 39, e105364. [DOI] [PMC free article] [PubMed] [Google Scholar]
- He F, Ru X, and Wen T (2020). NRF2, a transcription factor for stress response and beyond. Int. J. Mol. Sci 21, 4777. [DOI] [PMC free article] [PubMed] [Google Scholar]
- Higuchi-Sanabria R, Frankino PA, Paul JW 3rd, Tronnes SU, and Dillin A (2018). A futile battle? Protein quality control and the stress of aging. Dev. Cell 44, 139–163. [DOI] [PMC free article] [PubMed] [Google Scholar]
- Inoguchi T, Sonoda N, and Maeda Y (2016). Bilirubin as an important physiological modulator of oxidative stress and chronic inflammation in metabolic syndrome and diabetes: a new aspect on old molecule. Diabetol. Int 7, 338–341. [DOI] [PMC free article] [PubMed] [Google Scholar]
- Jadiya P, and Tomar D (2020). Mitochondrial protein quality control mechanisms. Genes (Basel) 11, 563. [DOI] [PMC free article] [PubMed] [Google Scholar]
- Karwi QG, Uddin GM, Ho KL, and Lopaschuk GD (2018). Loss of metabolic flexibility in the failing heart. Front. Cardiovasc. Med 5, 68. [DOI] [PMC free article] [PubMed] [Google Scholar]
- Kaspar S, Oertlin C, Szczepanowska K, Kukat A, Senft K, Lucas C, Brodesser S, Hatzoglou M, Larsson O, Topisirovic I, et al. (2021). Adaptation to mitochondrial stress requires CHOP-directed tuning of ISR. Sci. Adv 7, eabf0971. [DOI] [PMC free article] [PubMed] [Google Scholar]
- Khan NA, Nikkanen J, Yatsuga S, Jackson C, Wang L, Pradhan S, Kivela R, Pessia A, Velagapudi V, and Suomalainen A (2017). mTORC1 regulates mitochondrial integrated stress response and mitochondrial myopathy progression. Cell Metab 26, 419–428 e415. [DOI] [PubMed] [Google Scholar]
- Kleiner G, Barca E, Ziosi M, Emmanuele V, Xu Y, Hidalgo-Gutierrez A, Qiao C, Tadesse S, Area-Gomez E, Lopez LC, et al. (2018). CoQ10 supplementation rescues nephrotic syndrome through normalization of H2S oxidation pathway. Biochim. Biophys. Acta Mol. Basis Dis 1864, 3708–3722. [DOI] [PMC free article] [PubMed] [Google Scholar]
- Kuhl I, Miranda M, Atanassov I, Kuznetsova I, Hinze Y, Mourier A, Filipovska A, and Larsson NG (2017). Transcriptomic and proteomic landscape of mitochondrial dysfunction reveals secondary coenzyme Q deficiency in mammals. Elife 6, e30952. [DOI] [PMC free article] [PubMed] [Google Scholar]
- Kuleshov MV, Jones MR, Rouillard AD, Fernandez NF, Duan Q, Wang Z, Koplev S, Jenkins SL, Jagodnik KM, Lachmann A, et al. (2016). Enrichr: a comprehensive gene set enrichment analysis web server 2016 update. Nucleic Acids Res 44, W90–W97. [DOI] [PMC free article] [PubMed] [Google Scholar]
- Lakhal-Littleton S (2019). Mechanisms of cardiac iron homeostasis and their importance to heart function. Free Radic. Biol. Med 133, 234–237. [DOI] [PMC free article] [PubMed] [Google Scholar]
- Liu YT, Huang X, Nguyen D, Shammas MK, Wu BP, Dombi E, Springer DA, Poulton J, Sekine S, and Narendra DP (2020). Loss of CHCHD2 and CHCHD10 activates OMA1 peptidase to disrupt mitochondrial cristae phenocopying patient mutations. Hum. Mol. Genet 29, 1547–1567. [DOI] [PMC free article] [PubMed] [Google Scholar]
- Lopaschuk GD, and Jaswal JS (2010). Energy metabolic phenotype of the cardiomyocyte during development, differentiation, and postnatal maturation. J. Cardiovasc. Pharmacol 56, 130–140. [DOI] [PubMed] [Google Scholar]
- Lopaschuk GD, Ussher JR, Folmes CD, Jaswal JS, and Stanley WC (2010). Myocardial fatty acid metabolism in health and disease. Physiol. Rev 90, 207–258. [DOI] [PubMed] [Google Scholar]
- Love MI, Huber W, and Anders S (2014). Moderated estimation of fold change and dispersion for RNA-seq data with DESeq2. Genome Biol 15, 550. [DOI] [PMC free article] [PubMed] [Google Scholar]
- Man J, Barnett P, and Christoffels VM (2018). Structure and function of the Nppa-Nppb cluster locus during heart development and disease. Cell Mol. Life Sci 75, 1435–1444. [DOI] [PMC free article] [PubMed] [Google Scholar]
- Mehrmohamadi M, Liu X, Shestov AA, and Locasale JW (2014). Characterization of the usage of the serine metabolic network in human cancer. Cell Rep 9, 1507–1519. [DOI] [PMC free article] [PubMed] [Google Scholar]
- Nabeebaccus AA, Zoccarato A, Hafstad AD, Santos CX, Aasum E, Brewer AC, Zhang M, Beretta M, Yin X, West JA, et al. (2017). Nox4 reprograms cardiac substrate metabolism via protein O-GlcNAcylation to enhance stress adaptation. JCI Insight 2, e96184. [DOI] [PMC free article] [PubMed] [Google Scholar]
- Nakamura M, and Sadoshima J (2018). Mechanisms of physiological and pathological cardiac hypertrophy. Nat. Rev. Cardiol 15, 387–407. [DOI] [PubMed] [Google Scholar]
- Nakao K, Minobe W, Roden R, Bristow MR, and Leinwand LA (1997). Myosin heavy chain gene expression in human heart failure. J. Clin. Invest 100, 2362–2370. [DOI] [PMC free article] [PubMed] [Google Scholar]
- Nikkanen J, Forsstrom S, Euro L, Paetau I, Kohnz RA, Wang L, Chilov D, Viinamaki J, Roivainen A, Marjamaki P, et al. (2016). Mitochondrial DNA replication defects disturb cellular dNTP pools and remodel one-carbon metabolism. Cell Metab 23, 635–648. [DOI] [PubMed] [Google Scholar]
- Palomo GM, Granatiero V, Kawamata H, Konrad C, Kim M, Arreguin AJ, Zhao D, Milner TA, and Manfredi G (2018). Parkin is a disease modifier in the mutant SOD1 mouse model of ALS. EMBO Mol. Med 10, e8888. [DOI] [PMC free article] [PubMed] [Google Scholar]
- Pickles S, Vigie P, and Youle RJ (2018). Mitophagy and quality control mechanisms in mitochondrial maintenance. Curr. Biol 28, R170–R185. [DOI] [PMC free article] [PubMed] [Google Scholar]
- Piquereau J, Caffin F, Novotova M, Lemaire C, Veksler V, Garnier A, Ventura-Clapier R, and Joubert F (2013). Mitochondrial dynamics in the adult cardiomyocytes: which roles for a highly specialized cell? Front. Physiol 4, 102. [DOI] [PMC free article] [PubMed] [Google Scholar]
- Pirinen E, Auranen M, Khan NA, Brilhante V, Urho N, Pessia A, Hakkarainen A, Kuula J, Heinonen U, Schmidt MS, et al. (2020). Niacin cures systemic NAD(+) deficiency and improves muscle performance in adult-onset mitochondrial myopathy. Cell Metab 31, 1078–1090 e1075. [DOI] [PubMed] [Google Scholar]
- Rhee JW, Yi H, Thomas D, Lam CK, Belbachir N, Tian L, Qin X, Malisa J, Lau E, Paik DT, et al. (2020). Modeling secondary iron overload cardiomyopathy with human induced pluripotent stem cell-derived cardiomyocytes. Cell Rep 32, 107886. [DOI] [PMC free article] [PubMed] [Google Scholar]
- Richardson DR, Lane DJ, Becker EM, Huang ML, Whitnall M, Suryo Rahmanto Y, Sheftel AD, and Ponka P (2010). Mitochondrial iron trafficking and the integration of iron metabolism between the mitochondrion and cytosol. Proc. Natl. Acad. Sci. U S A 107, 10775–10782. [DOI] [PMC free article] [PubMed] [Google Scholar]
- Sasagawa S, Nishimura Y, Okabe S, Murakami S, Ashikawa Y, Yuge M, Kawaguchi K, Kawase R, Okamoto R, Ito M, et al. (2016). Downregulation of GSTK1 is a common mechanism underlying hypertrophic cardiomyopathy. Front. Pharmacol 7, 162. [DOI] [PMC free article] [PubMed] [Google Scholar]
- Schaffer SW, Jong CJ, Ramila KC, and Azuma J (2010). Physiological roles of taurine in heart and muscle. J. Biomed. Sci 17, S2. [DOI] [PMC free article] [PubMed] [Google Scholar]
- Schroder K, Zhang M, Benkhoff S, Mieth A, Pliquett R, Kosowski J, Kruse C, Luedike P, Michaelis UR, Weissmann N, et al. (2012). Nox4 is a protective reactive oxygen species generating vascular NADPH oxidase. Circ. Res 110, 1217–1225. [DOI] [PubMed] [Google Scholar]
- Stanley WC, Recchia FA, and Lopaschuk GD (2005). Myocardial substrate metabolism in the normal and failing heart. Physiol. Rev 85, 1093–1129. [DOI] [PubMed] [Google Scholar]
- Starkov AA (2010). Measurement of mitochondrial ROS production. Methods Mol. Biol 648, 245–255. [DOI] [PMC free article] [PubMed] [Google Scholar]
- Sun H, Olson KC, Gao C, Prosdocimo DA, Zhou M, Wang Z, Jeyaraj D, Youn JY, Ren S, Liu Y, et al. (2016). Catabolic defect of branched-chain amino acids promotes heart failure. Circulation 133, 2038–2049. [DOI] [PMC free article] [PubMed] [Google Scholar]
- Taegtmeyer H, Sen S, and Vela D (2010). Return to the fetal gene program: a suggested metabolic link to gene expression in the heart. Ann. N. Y Acad. Sci 1188, 191–198. [DOI] [PMC free article] [PubMed] [Google Scholar]
- Talman V, Teppo J, Poho P, Movahedi P, Vaikkinen A, Karhu ST, Trost K, Suvitaival T, Heikkonen J, Pahikkala T, et al. (2018). Molecular Atlas of postnatal mouse heart development. J. Am. Heart Assoc 7, e010378. [DOI] [PMC free article] [PubMed] [Google Scholar]
- Taylor EB, and Rutter J (2011). Mitochondrial quality control by the ubiquitin-proteasome system. Biochem. Soc. Trans 39, 1509–1513. [DOI] [PubMed] [Google Scholar]
- Thrasher JR, Cooper MD, and Dunaway GA (1981). Developmental changes in heart and muscle phosphofructokinase isozymes. J. Biol. Chem 256, 7844–7848. [PubMed] [Google Scholar]
- Tran DH, and Wang ZV (2019). Glucose metabolism in cardiac hypertrophy and heart failure. J. Am. Heart Assoc 8, e012673. [DOI] [PMC free article] [PubMed] [Google Scholar]
- Tyynismaa H, Mjosund KP, Wanrooij S, Lappalainen I, Ylikallio E, Jalanko A, Spelbrink JN, Paetau A, and Suomalainen A (2005). Mutant mitochondrial helicase Twinkle causes multiple mtDNA deletions and a lateonset mitochondrial disease in mice. Proc. Natl. Acad. Sci. U S A 102, 17687–17692. [DOI] [PMC free article] [PubMed] [Google Scholar]
- Viscomi C, and Zeviani M (2017). MtDNA-maintenance defects: syndromes and genes. J. Inherit. Metab. Dis 40, 587–599. [DOI] [PMC free article] [PubMed] [Google Scholar]
- Vives-Bauza C, Yang L, and Manfredi G (2007). Assay of mitochondrial ATP synthesis in animal cells and tissues. Methods Cell Biol 80, 155–171. [DOI] [PubMed] [Google Scholar]
- Wai T, Saita S, Nolte H, Muller S, Konig T, Richter-Dennerlein R, Sprenger HG, Madrenas J, Muhlmeister M, Brandt U, et al. (2016). The membrane scaffold SLP2 anchors a proteolytic hub in mitochondria containing PARL and the i-AAA protease YME1L. EMBO Rep 17, 1844–1856. [DOI] [PMC free article] [PubMed] [Google Scholar]
- Wang W, and Kang PM (2020). Oxidative stress and antioxidant treatments in cardiovascular diseases. Antioxidants (Basel) 9, 1292. [DOI] [PMC free article] [PubMed] [Google Scholar]
- Wei Y, Chiang WC, Sumpter R Jr., Mishra P, and Levine B (2017). Prohibitin 2 is an inner mitochondrial membrane mitophagy receptor. Cell 168, 224–238 e210. [DOI] [PMC free article] [PubMed] [Google Scholar]
- Wittig I, Braun HP, and Schagger H (2006). Blue native PAGE. Nat. Protoc 1, 418–428. [DOI] [PubMed] [Google Scholar]
- Xu J, Kimball TR, Lorenz JN, Brown DA, Bauskin AR, Klevitsky R, Hewett TE, Breit SN, and Molkentin JD (2006). GDF15/MIC-1 functions as a protective and antihypertrophic factor released from the myocardium in association with SMAD protein activation. Circ. Res 98, 342–350. [DOI] [PubMed] [Google Scholar]
- Zhang H, Ryu D, Wu Y, Gariani K, Wang X, Luan P, D’Amico D, Ropelle ER, Lutolf MP, Aebersold R, et al. (2016). NAD(+) repletion improves mitochondrial and stem cell function and enhances life span in mice. Science 352, 1436–1443. [DOI] [PubMed] [Google Scholar]
- Zhao QD, Viswanadhapalli S, Williams P, Shi Q, Tan C, Yi X, Bhandari B, and Abboud HE (2015). NADPH oxidase 4 induces cardiac fibrosis and hypertrophy through activating Akt/mTOR and NFkappaB signaling pathways. Circulation 131, 643–655. [DOI] [PMC free article] [PubMed] [Google Scholar]
- Zhou B, and Tian R (2018). Mitochondrial dysfunction in pathophysiology of heart failure. J. Clin. Invest 128, 3716–3726. [DOI] [PMC free article] [PubMed] [Google Scholar]
Associated Data
This section collects any data citations, data availability statements, or supplementary materials included in this article.
Supplementary Materials
Data Availability Statement
Transcriptomics data are available through Gene Expression Omnibus gene repository with the dataset identifier GEO: GSE193801. The mass spectrometry proteomics data have been deposited to the ProteomeXchange Consortium via the PRIDE partner repository with the dataset identifier PRIDE: PXD031444. Metabolomics data were deposited to the Metabolomics Workbench with the study ID: ST002068.
This paper does not report original code.
Any additional information required to reanalyze the data reported in this paper is available from the lead contact upon request.