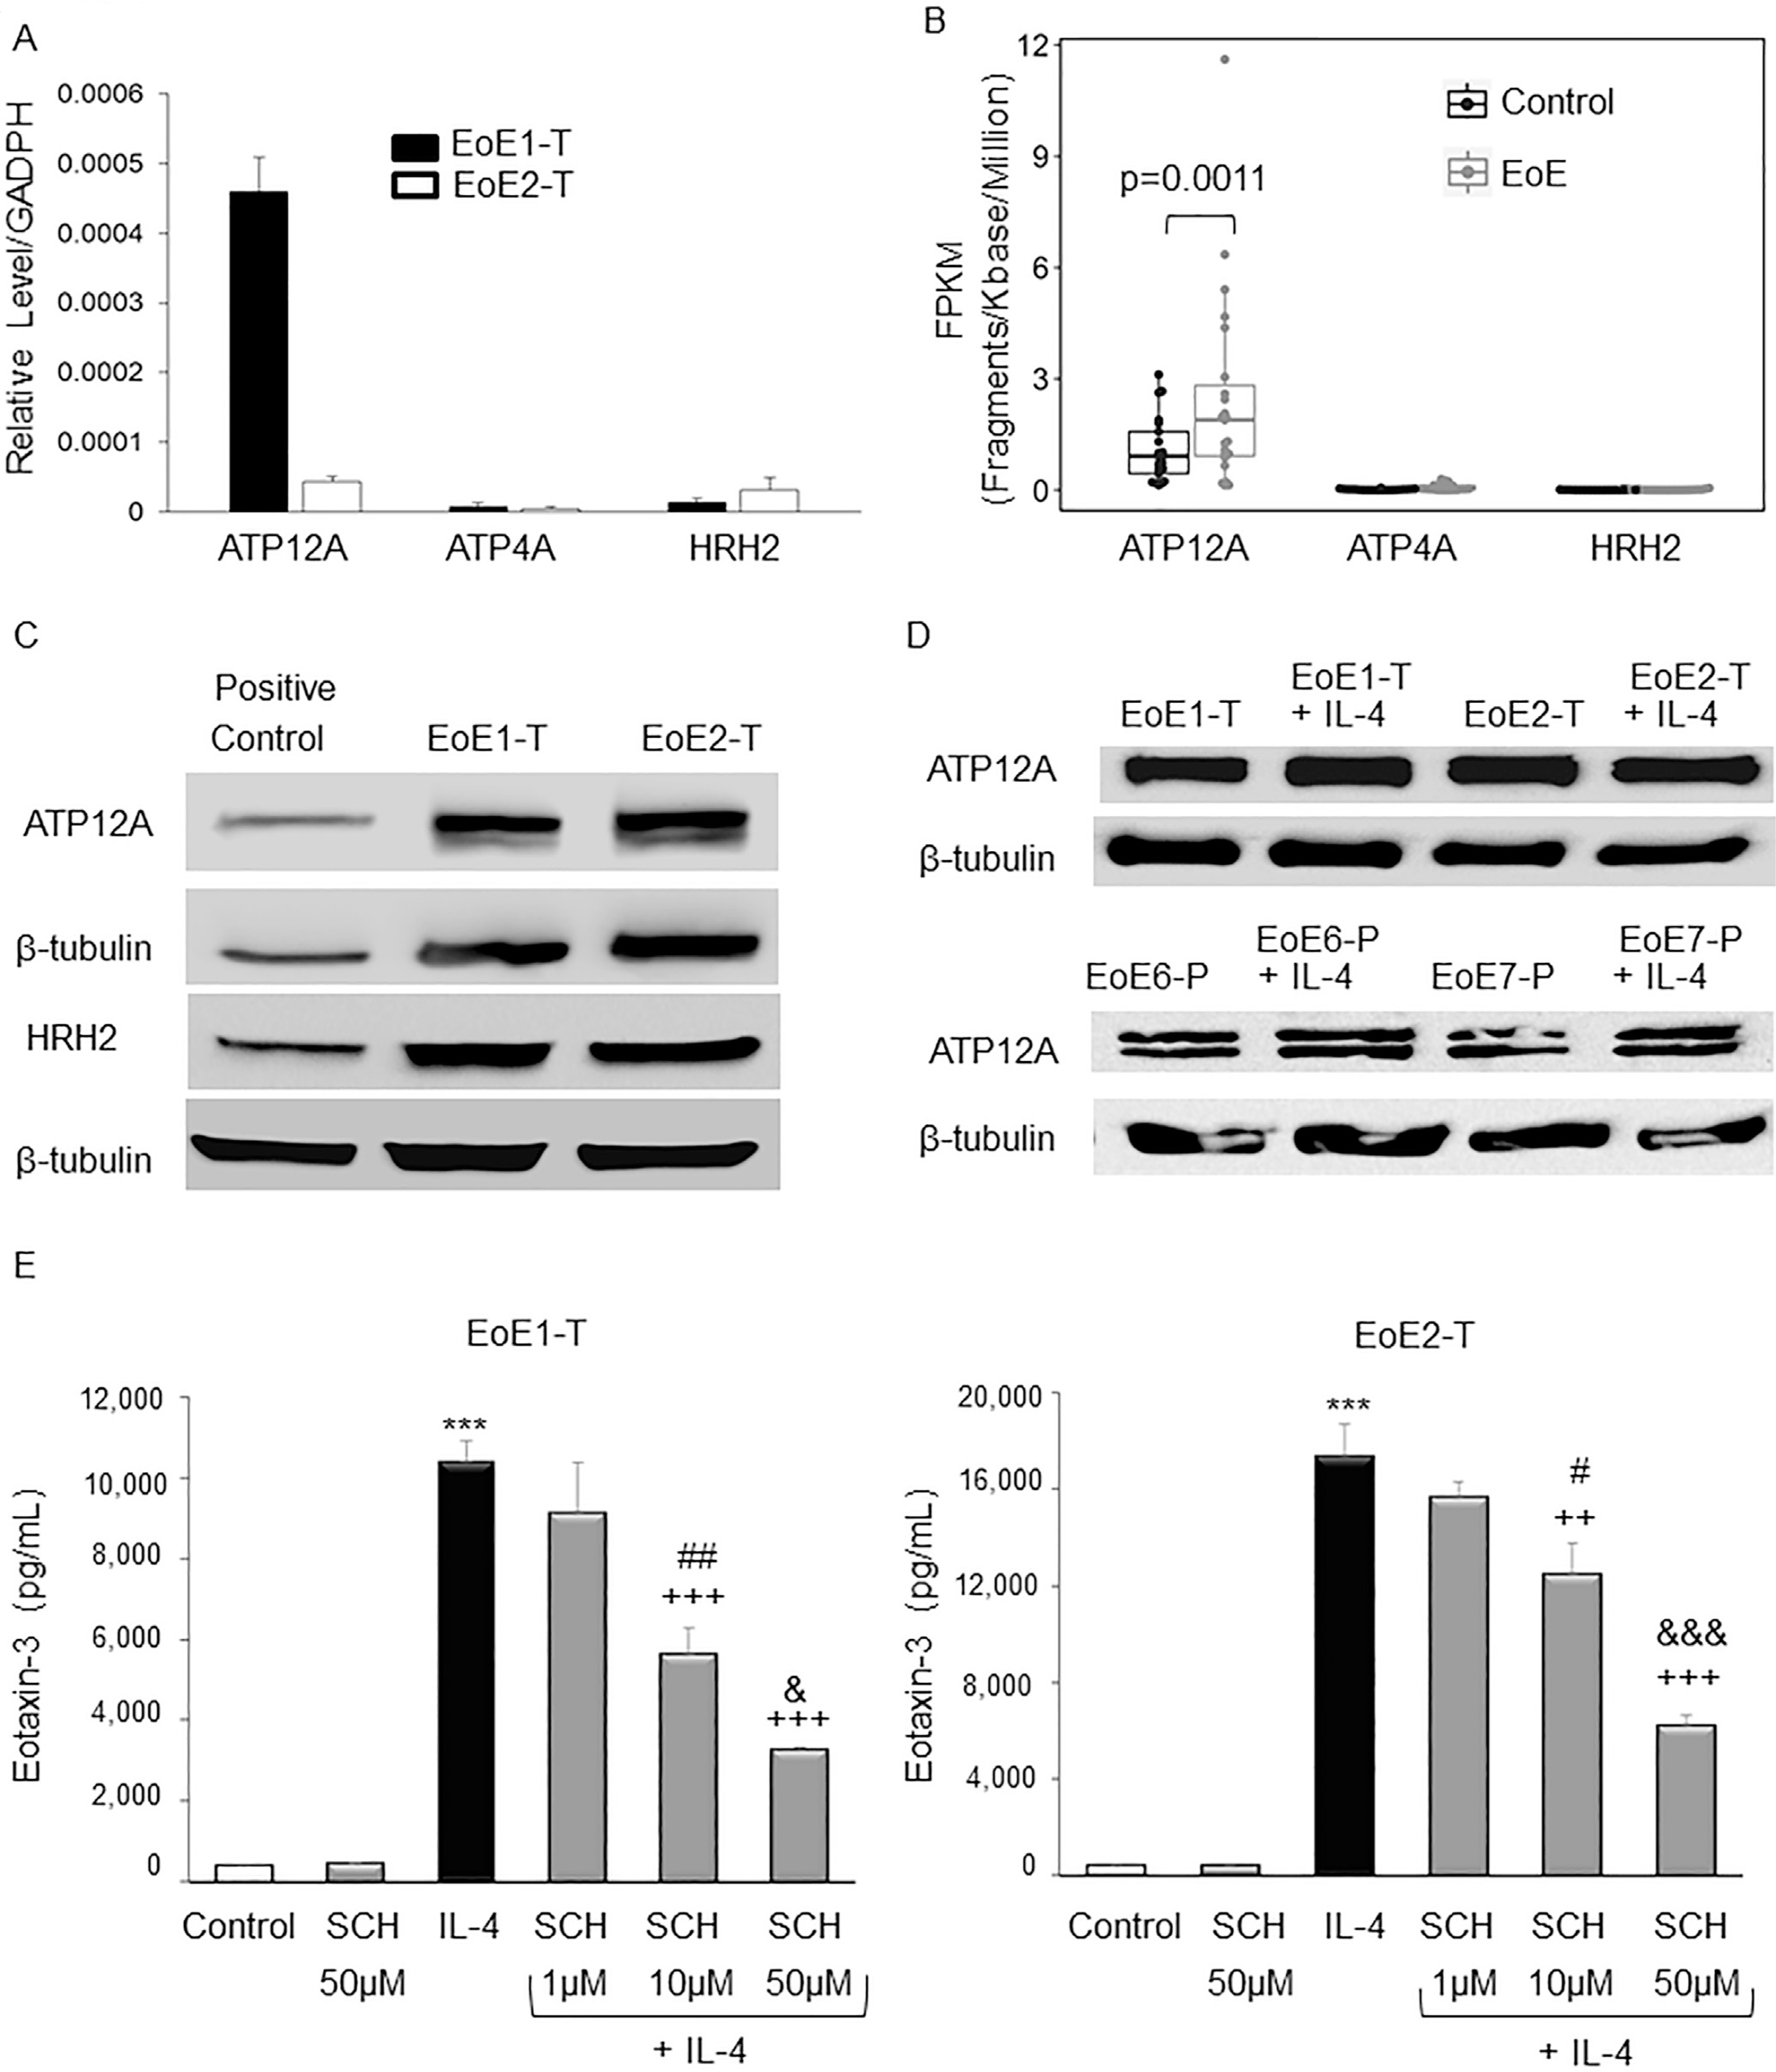
Figure 1.

EoE cells express ATP12A (nongastric proton pump) and HRH2. (A) Representative quantitative real-time polymerase chain reactions demonstrating relative levels of ATP12A, ATP4A (gastric proton pump), and HRH2 mRNAs. Bar graphs depict the mean ± SEM from 1 experiment performed in triplicate. (B) RNA-sequencing gene expression represented by FPKM values of ATP12A, ATP4A, and HRH2 mRNAs in 23 patients with EoE and 21 controls from GSE58640, GSE41687, and GSE113341 datasets. Compared with controls, ATP12A expression was significantly increased in patients with EoE; P values from multiple datasets were calculated using DESeq2 and combined using weighted Stouffer’s method. (C) Representative Western blots demonstrating levels of ATP12A and HRH2 proteins EoE cells; 293T cells served as a positive control. (D) Representative Western blots demonstrating levels of ATP12A proteins in EoE cell lines and in primary EoE cells (EoE6-P and EoE7-P) with and without IL-4 stimulation. (E) SCH 28080 decreases IL-4–stimulated eotaxin-3 secretion by EoE cells in a dose-dependent manner. Representative eotaxin-3 enzyme-linked immunosorbent assays 48 hours after IL-4 treatment in cells with and without SCH 28080 (SCH). Bar graphs depict the mean ± SEM from 3 separate samples. ***P ≤ .001 compared with control; ++P ≤ .01, +++P ≤ .001 compared with IL-4; #P ≤ .05, ##P ≤ .01 compared with IL-4 + SCH 1 μM; &P ≤ .05, &&&P ≤ .001 compared with IL-4 + SCH 10 μM; 1-way analysis of variance.
