

Abstract
Introduction:
The estimate of people with clinical AD and MCI provides an understanding of the disease burden.
Methods:
We estimated people with cognitive impairment using a quasibinomial regression model in 10,342 participants with cognitive test scores.
Results:
The 2020 US census adjusted prevalence of clinical AD was 11.3% (95% CI= 10.7, 11.9): 10.0% among non-Hispanic Whites, 14.0% among Hispanics, and 18.6% among non-Hispanic African Americans. We estimate that in 2020, 6.07 (95% CI= 5.75, 6.38) million people live with clinical AD that increases to 13.85 (95% CI= 12.98, 14.74) million in 2060, a 423% higher among Hispanics and 192% higher among African Americans, and 63% higher among Whites. However, more significant increases in later years among over 85 and women compared to men.
Discussion:
The number of people with clinical AD will increase as the “baby boom” generation reaches older ages exerting a strong upward influence on disease burden.
INTRODUCTION
Disease forecasting has been an area of intense interest to the scientific community for over seven decades.1 The forecasting developments include failures of success2 and the pandemic of chronic disease.3 The United States demographic characteristics have been changing with the “baby boom” generation reaching older ages,4,5 resulting in a larger number of older adults6,7 and growth in diverse populations,8,9 which significantly impacts individuals, families, and society.10–11 A lack of effective therapeutic agents has exacerbated the expected increase in healthcare and caregiving costs,12–14 as the number of people with Alzheimer’s disease (AD) increases. Therefore, the demographic-specific number of people with clinical AD and MCI from 2020 through 2060 provides the opportunity to understand the national-level resources and policies needed to fight AD in minority and vulnerable populations.
Previous estimates of the prevalence of clinical AD and MCI were based on detailed clinical evaluation using a comprehensive battery of cognitive tests.15–18 Several research studies and meta-analyses have used the clinical diagnosis to estimate the prevalence and forecast disease.19–20 However, performing clinical evaluations can be time-consuming and expensive in population studies, and medical records could increase classification errors. In our earlier work, we developed likelihood scores to estimate the 2010 US census-adjusted prevalence of clinical AD and MCI. We characterized the secular trend in the prevalence of clinical AD from 1993 to 2012,21 and those scores can also forecast disease.
This manuscript aims to extend the likelihood score approach to estimate the number of people with clinical AD and MCI in the US from 2020 through 2060. Using the Chicago Health and Aging Project (CHAP), we will estimate the 2020 US census adjusted prevalence of clinical AD and MCI by age and race/ethnicity (African American, White, and Hispanics).
METHODS
The CHAP study enrolled participants based on a door-to-door census in four Chicago neighborhoods where residents were non-Hispanic White, Hispanic, and non-Hispanic African American.22 The inclusion criteria required the study participants to live on the southside of Chicago and were 65 years and older. The first cycle of data collection started in 1993 and ended in 1996 when we enrolled 78.7% of residents over 65, with a follow-up between 1997 and 1999. Between 2000 and 2012, four successive cohorts of participants reaching the age of 65 enrolled, joining the original cohort. Of the 10,801 total participants, 10,342 (95.8%) participants performed at least one neuropsychological test and provided demographic covariates. During the study, 5,583(54.0%) participants died, and lost 1,349 (13.0%) to follow-up (Appendix Figure 1).
The Institutional Review Board of the Rush University Medical Center approved the study protocols, and all participants provided written informed consent for in-home cognitive assessments for clinical AD.
Clinical AD and MCI Likelihood Scores
The likelihood scores used scores from the four short cognitive tests administered during in-home population interviews. The cognitive tests consisted of two tests of episodic memory based on immediate and delayed story recall of the East Boston (scores ranging from 0 to 12),23 one test for executive function based on the Symbol Digit Modalities Test (SDMT; scores ranging from 0 to 75),24 and the Mini-Mental State Examination (MMSE; scores ranging from 0 to 30).25 In general, higher cognitive test scores indicated better cognitive performance and a lower risk of clinical AD and MCI according to the NINDS-ADRDA criteria.26
We estimated the person-specific likelihood of clinical AD and MCI using a sample weight-adjusted generalized logistic regression model of clinically diagnosed clinical AD and MCI, as predicted by the short-battery cognitive test scores.21 This regression model is also included as independent variables age at clinical evaluation, female sex, formal education (in years), and African American (AA) race/ethnicity. The likelihood scores provide the probability of clinical disease based on neuropsychological test scores, ranging from 0 to 1, rather than cutoffs that introduce misclassification errors. The likelihood scores used the short-battery test scores and demographic characteristics in 10,342 participants with 36,408 cognitive assessments between 1993 and 2012. Hence, a participant can contribute to the age-specific prevalence of clinical AD and MCI throughout the study.
US Census Demographics from 2020 through 2060
We used the projected demographic-specific characteristics of the US population, available through the CDC Wonder application for US census projections from 2020 through 2060.27 The census data consisted of estimates of US population and consisted of age: 65–69, 70–74, 75–79, 80–84, 85 and over; ethnicity: Hispanic vs. non-Hispanic; racial groups: White, African American, Asian, Native American, and others. The population sizes also consisted of men and women. We combined 5-year age groups to create three 10-year age intervals: 65–74, 75–84, and over 85 years old for the three racial, ethnic groups – non-Hispanic White, African American, and Hispanics for men and women. The prevalence and number of people were estimated for the 5-year age groups and combined at the final step. A single group for Hispanic ethnicity, and the remaining White and African Americans classified on their non-Hispanic ethnicity. The study participants identified their ethnicity as White, African American, Asian, pacific islanders, or others, and their ethnicity of Hispanic or non-Hispanic origin. The study sample consisted of a small number of participants who reported multiple races and were classified as minorities when they reported Hispanic or non-Hispanic Whites.
Statistical Analysis
Baseline descriptive statistics for 10,342 participants, stratified by the three race/ethnicity groups for demographic characteristics, such as age, the number of formal years of education completed, the gender of the participant, and the crude prevalence based on the likelihood scores. Descriptive statistics included means and standard deviations for continuous characteristics and percentages for categorical characteristics for baseline population interviews.
To estimate the number of older adults in our study population with clinical AD and MCI, we used a generalized additive quasibinomial regression model with the likelihood scores as the outcome variable and four participant characteristics: age (65–74, 75–84, and 85 and older), race/ethnicity (White, African American, Hispanic), gender, and education (standardized for the CHAP study sample).28 The sandwich variance estimator accounted for repeated observations and overdispersed likelihood scores (Appendix Methods for more details). The model also included years since the first cognitive assessment and an additional person-specific random effect for baseline probability of clinical AD. We estimated the 2020 US census adjusted prevalence of clinical AD by standardizing the yearly age-sex-race estimates with each group-specific prevalence weighted to the US census using the corresponding group sizes. We estimated the number of people with clinical AD by weighing the group-specific prevalence with the number of people in each age, race/ethnicity, and gender group. We estimated their confidence interval using the model sandwich estimator for demographic groups. This process was repeated for each year to forecast people with the disease. We used a similar modeling approach for forecasting all-cause MCI in the United States. We used marginal totals of gender and race/ethnicity within each age group. We followed a similar process for estimates specific to race/ethnicity and gender groups. The likelihood scores also used a conservative last observation carried forward imputation when they had died or non-participation. Therefore, the extrapolation for count estimates also adjusted for truncation due to mortality and missing data. Statistical analysis used several packages and graphical representations provided using the R program.29
Data Availability
De-identified data is available on request for qualified investigators from www.riha.rush.edu/dataportal.html.
RESULTS
Of the 10,342 participants in our study, 36.2% identified as non-Hispanic White, 1.3% as Hispanic, and 62.5% as non-Hispanic African American (Table 1). The mean baseline age was 71.0 years. Among participants aged 65–74 years old, more were African American than were White (77% vs. 55%); among participants 85 years and older, fewer were African American (5% vs. 13%). Participants attained a mean of 12 years of formal education. More than 60% of participants were women. The crude baseline prevalence of clinical AD using the likelihood score was 15.0% in the study population overall, 18.1% among AA participants, 14.1% among Hispanic participants, and 9.7% among Hispanic participants. The MCI prevalence was 27.3% (overall), with African Americans also having a higher prevalence of MCI compared to Whites (32.6% vs. 20.3%), while the Hispanic prevalence of MCI (26.8%) was between that of AAs and Whites.
Table 1.
Sample Characteristics of 10,342 Participants by Race/Ethnicity
| Non-Hispanic White | Hispanic | African American | |
|---|---|---|---|
| N=3,742 | N=132 | N=6, 458 | |
| Age, y, N (%) | |||
| 65–74 | 2053, 55% | 88, 66% | 5006, 77% |
| 75–84 | 1190, 32% | 34, 26% | 1144, 18% |
| 85 and older | 499, 13% | 10, 8% | 308, 5% |
| Gender, N (%) | |||
| Males | 1452, 39% | 44, 33% | 3955, 39% |
| Females | 2503, 61% | 88, 67% | 2503, 61% |
| Education, y, mean (SD) | 13.8, 3.2 | 12.1, 4.4 | 11.4, 3.4 |
| Prevalence, % | |||
| Clinical AD | 9.7% | 14.2% | 18.1% |
| MCI | 20.3% | 26.8% | 32.6% |
Abbreviation: y = years, SD = standard deviation, MCI = mild cognitive impairment, AD = Alzheimer’s disease
2020 US Census Adjusted Prevalence of Clinical AD and MCI
The overall 2020 US census adjusted prevalence of clinical AD was 11.3% (95% CI= 10.7, 11.9), with AAs having nearly twice the prevalence as Whites (18.6% vs. 10.0%), and the prevalence was 14.0% among Hispanics (Table 2). The age-specific prevalence of clinical AD was 5.3% (95% CI= 4.9, 5.7) among adults 65–74 years old, 13.8% among adults 75–84 years old (95% CI= 13.1, 14.5), which increased to 34.6% among adults 85 years and older (95% CI= 33.3, 35.8).
Table 2.
2020 US Census Adjusted Prevalence, cases per 100 persons, (95% CI) of Clinical AD and Mild Cognitive Impairment, by Age and Race/Ethnicity using 10,342 Participants from the Chicago Health and Aging Population Sample
| Clinical AD Prevalence, cases per 100 (95% CI) |
Mild Cognitive Impairment Prevalence, cases per 100 (95% CI) |
|
|---|---|---|
| All Participants | ||
| Non-Hispanic White | 10.0 (9.6, 10.4) | 21.1 (20.8, 21.5) |
| Hispanic | 14.0 (12.0, 16.1) | 25.9 (24.5, 27.3) |
| African American | 18.6 (18.0, 19.1) | 32.0 (31.7, 32.4) |
| Overall Prevalence | 11.3 (10.7, 11.9) | 22.7 (22.3, 23.2) |
| 65–74 Years | ||
| Non-Hispanic White | 4.3 (4.1, 4.6) | 20.2 (19.9, 20.6) |
| Hispanic | 7.0 (5.8, 8.3) | 24.9 (23.5, 26.3) |
| African American | 10.1 (9.6, 10.6) | 30.9 (30.6, 31.3) |
| Age-Specific Prevalence | 5.3 (4.9, 5.7) | 21.9 (21.5, 22.4) |
| 75–84 Years | ||
| Non-Hispanic White | 11.9 (11.3, 12.4) | 23.1 (22.7, 23.4) |
| Hispanic | 18.7 (15.8, 21.5) | 28.2 (26.7, 29.7) |
| African American | 25.2 (24.5, 25.9) | 34.7 (34.3, 35.1) |
| Age-Specific Prevalence | 13.8 (13.1, 14.5) | 24.6 (24.2, 25.1) |
| Over 85 Years | ||
| Non-Hispanic White | 31.6 (30.7, 32.5) | 20.7 (20.3, 21.0) |
| Hispanic | 44.0 (39.3, 48.7) | 25.5 (24.1, 26.9) |
| African American | 54.0 (53.0, 55.0) | 31.6 (31.2, 32.1) |
| Age-Specific Prevalence | 34.6 (33.3, 35.8) | 22.1 (21.6, 22.5) |
NOTE: Prevalence estimates derived from a quasibinomial regression model for likelihood of probable clinical AD and mild cognitive impairment adjusting for age, race/ethnicity, gender, and education.
The overall patterns in age- and race/ethnicity-specific prevalence of clinical AD carried over to groups jointly defined by age and race/ethnicity. In each race/ethnicity, the prevalence of AD was higher with the progressively older age category. In each of the three age categories, the prevalence of AD was highest among AAs, lowest among Whites, and intermediate among Hispanics.
The 2020 US census adjusted prevalence of all-cause MCI was 22.7% (95% CI= 22.3, 23.2) that was over twice the prevalence of clinical AD (Table 2). The overall prevalence of MCI was higher among AAs than Whites (32.0% vs. 21.1%), and 25.9% among Hispanics was between AAs and Whites. The prevalence of MCI also showed variability by age and race/ethnicity, with higher rates among AAs than Whites in each age group (Table 2).
Number of People with Clinical AD and MCI from 2020 Through 2060
We estimated that 6.07 (95% CI= 5.75, 6.38) million older adults in the US have clinical AD in 2020 (Table 3). This number will increase by 18% to 7.16 million in 2025 and 128% to 13.85 million in 2060. In 2020, of all people with clinical AD, 70.8% will be White, 17.5% will be AA, and 11.7% will be Hispanic. By 2060, the proportions of persons with AD who were AA and Hispanic will increase to 24.5% and 26.8%, respectively, while it will decrease to 50.8% of White.
Table 3.
Projected Number of People in the United States (in millions) with Clinical AD (in Millions) 2020 to 2060, by Race/ethnicity and Year
| Year | Non-Hispanic White | Hispanic | African American | Total |
|---|---|---|---|---|
| Estimate (95% CI) | Estimate (95% CI) | Estimate (95% CI) | Estimate (95% CI) | |
| Number of People with Clinical AD (millions) | ||||
| 2020 | 4.30 (4.12, 4.48) | 0.71 (0.61, 0.81) | 1.06 (1.03, 1.09) | 6.07 (5.75, 6.38) |
| 2021 | 4.40 (4.21, 4.58) | 0.76 (0.64, 0.85) | 1.10 (1.07, 1.14) | 6.25 (5.92, 6.58) |
| 2022 | 4.53 (4.30, 4.68) | 0.79 (0.67, 0.90) | 1.15 (1.11, 1.19) | 6.46 (6.12, 6.80) |
| 2023 | 4.67 (4.47, 4.86) | 0.83 (0.71, 0.95) | 1.20 (1.17, 1.24) | 6.70 (6.34, 7.05) |
| 2024 | 4.80 (4.59, 5.00) | 0.87 (0.74, 1.00) | 1.26 (1.22, 1.30) | 6.93 (6.56, 7.29) |
| 2025 | 4.93 (4.72, 5.13) | 0.92 (0.79, 1.06) | 1.31 (1.27, 1.36) | 7.16 (6.78, 7.55) |
| 2030 | 5.72 (5.48, 5.95) | 1.19 (1.02, 1.37) | 1.61 (1.57, 1.67) | 8.53 (8.07, 8.99) |
| 2040 | 7.03 (6.76, 7.30) | 1.90 (1.63, 2.18) | 2.23 (2.17, 2.29) | 11.16 (10.55, 11.77) |
| 2050 | 7.29 (7.02, 7.56) | 2.77 (2.38, 3.16) | 2.66 (2.58, 2.73) | 12.73 (11.99, 13.46) |
| 2060 | 7.03 (6.77, 7.30) | 3.72 (3.20, 4.23) | 3.10 (3.01, 3.19) | 13.85 (12.98, 14.71) |
| Number of People with Mild Cognitive Impairment (millions) | ||||
| 2020 | 9.10 (8.95, 9.24) | 1.30 (1.22, 1.37) | 1.84 (1.81, 1.86) | 12.23 (11.99, 12.47) |
| 2021 | 9.34 (9.19, 9.49) | 1.37 (1.30, 1.45) | 1.92 (1.90, 1.94) | 12.64 (12.39, 12.89) |
| 2022 | 9.61 (9.46, 9.77) | 1.45 (1.37, 1.53) | 2.01 (1.99, 2.03) | 13.08 (12.82, 13.33) |
| 2023 | 9.88 (9.72, 10.03) | 1.53 (1.45, 1.62) | 2.10 (2.07, 2.12) | 13.51 (13.24, 13.77) |
| 2024 | 10.12 (9.96, 10.28) | 1.62 (1.53, 1.71) | 2.19 (2.16, 2.21) | 13.93 (13.65, 14.20) |
| 2025 | 10.38 (10.20, 10.54) | 1.71 (1.62, 1.81) | 2.28 (2.25, 2.31) | 14.37 (14.08, 14.65) |
| 2030 | 11.36 (11.18, 11.54) | 2.19 (2.08, 2.32) | 2.70 (2.67, 2.73) | 16.26 (15.92, 16.59) |
| 2040 | 11.67 (11.49, 11.86) | 3.26 (3.08, 3.44) | 3.23 (3.19, 3.26) | 18.16 (17.76, 18.57) |
| 2050 | 11.24 (11.06, 11.42) | 4.40 (4.16, 4.64) | 3.64 (3.60, 3.68) | 19.29 (18.82, 19.75) |
| 2060 | 11.46 (11.27, 11.64) | 5.64 (5.33, 5.60) | 4.45 (4.40, 4.50) | 21.55 (21.00, 22.10) |
The number of people in U.S. with MCI increased from 12.23 (95% CI= 11.99, 12.47) million in 2020 to 21.55 (95% CI= 21.00, 22.10) million in 2060 (Table 3), an increase of 9.32 million (76.2%) from 2020 to 2060. The number of Whites with MCI increased from 9.10 million in 2020 to 11.46 million in 2060, increasing by 2.36 million (25.9%) over the years. In comparison, Hispanics increased from 1.30 million to 5.64 million, an increase of 4.34 million (333.8%) from 2020 to 2060. The number of AAs with MCI increased from 1.84 million in 2020 to 4.45 million in 2060, increasing by 2.61 million (141.8%).
Age-Specific Number of People with Clinical AD from 2020 through 2060
The number of 65–74 years old with clinical AD increases from 1.65 (95% CI= 1.36, 1.94) million in 2020 to 2.51 million in 2060 (Figure 1), an increase of 0.86 million (52.1%) from 2020 to 2060. The number of 75–84 years old with clinical AD increased from 2.18 (95% CI= 1.90, 2.46) million in 2020 to 4.66 million in 2060, increasing 2.48 million (113.8%) in four decades. Finally, the number of people aged over 85 with clinical AD increased from 2.24 million in 2020 to 6.67 million in 2060, increasing 4.43 million (197.8%) over the five years.
Figure 1.
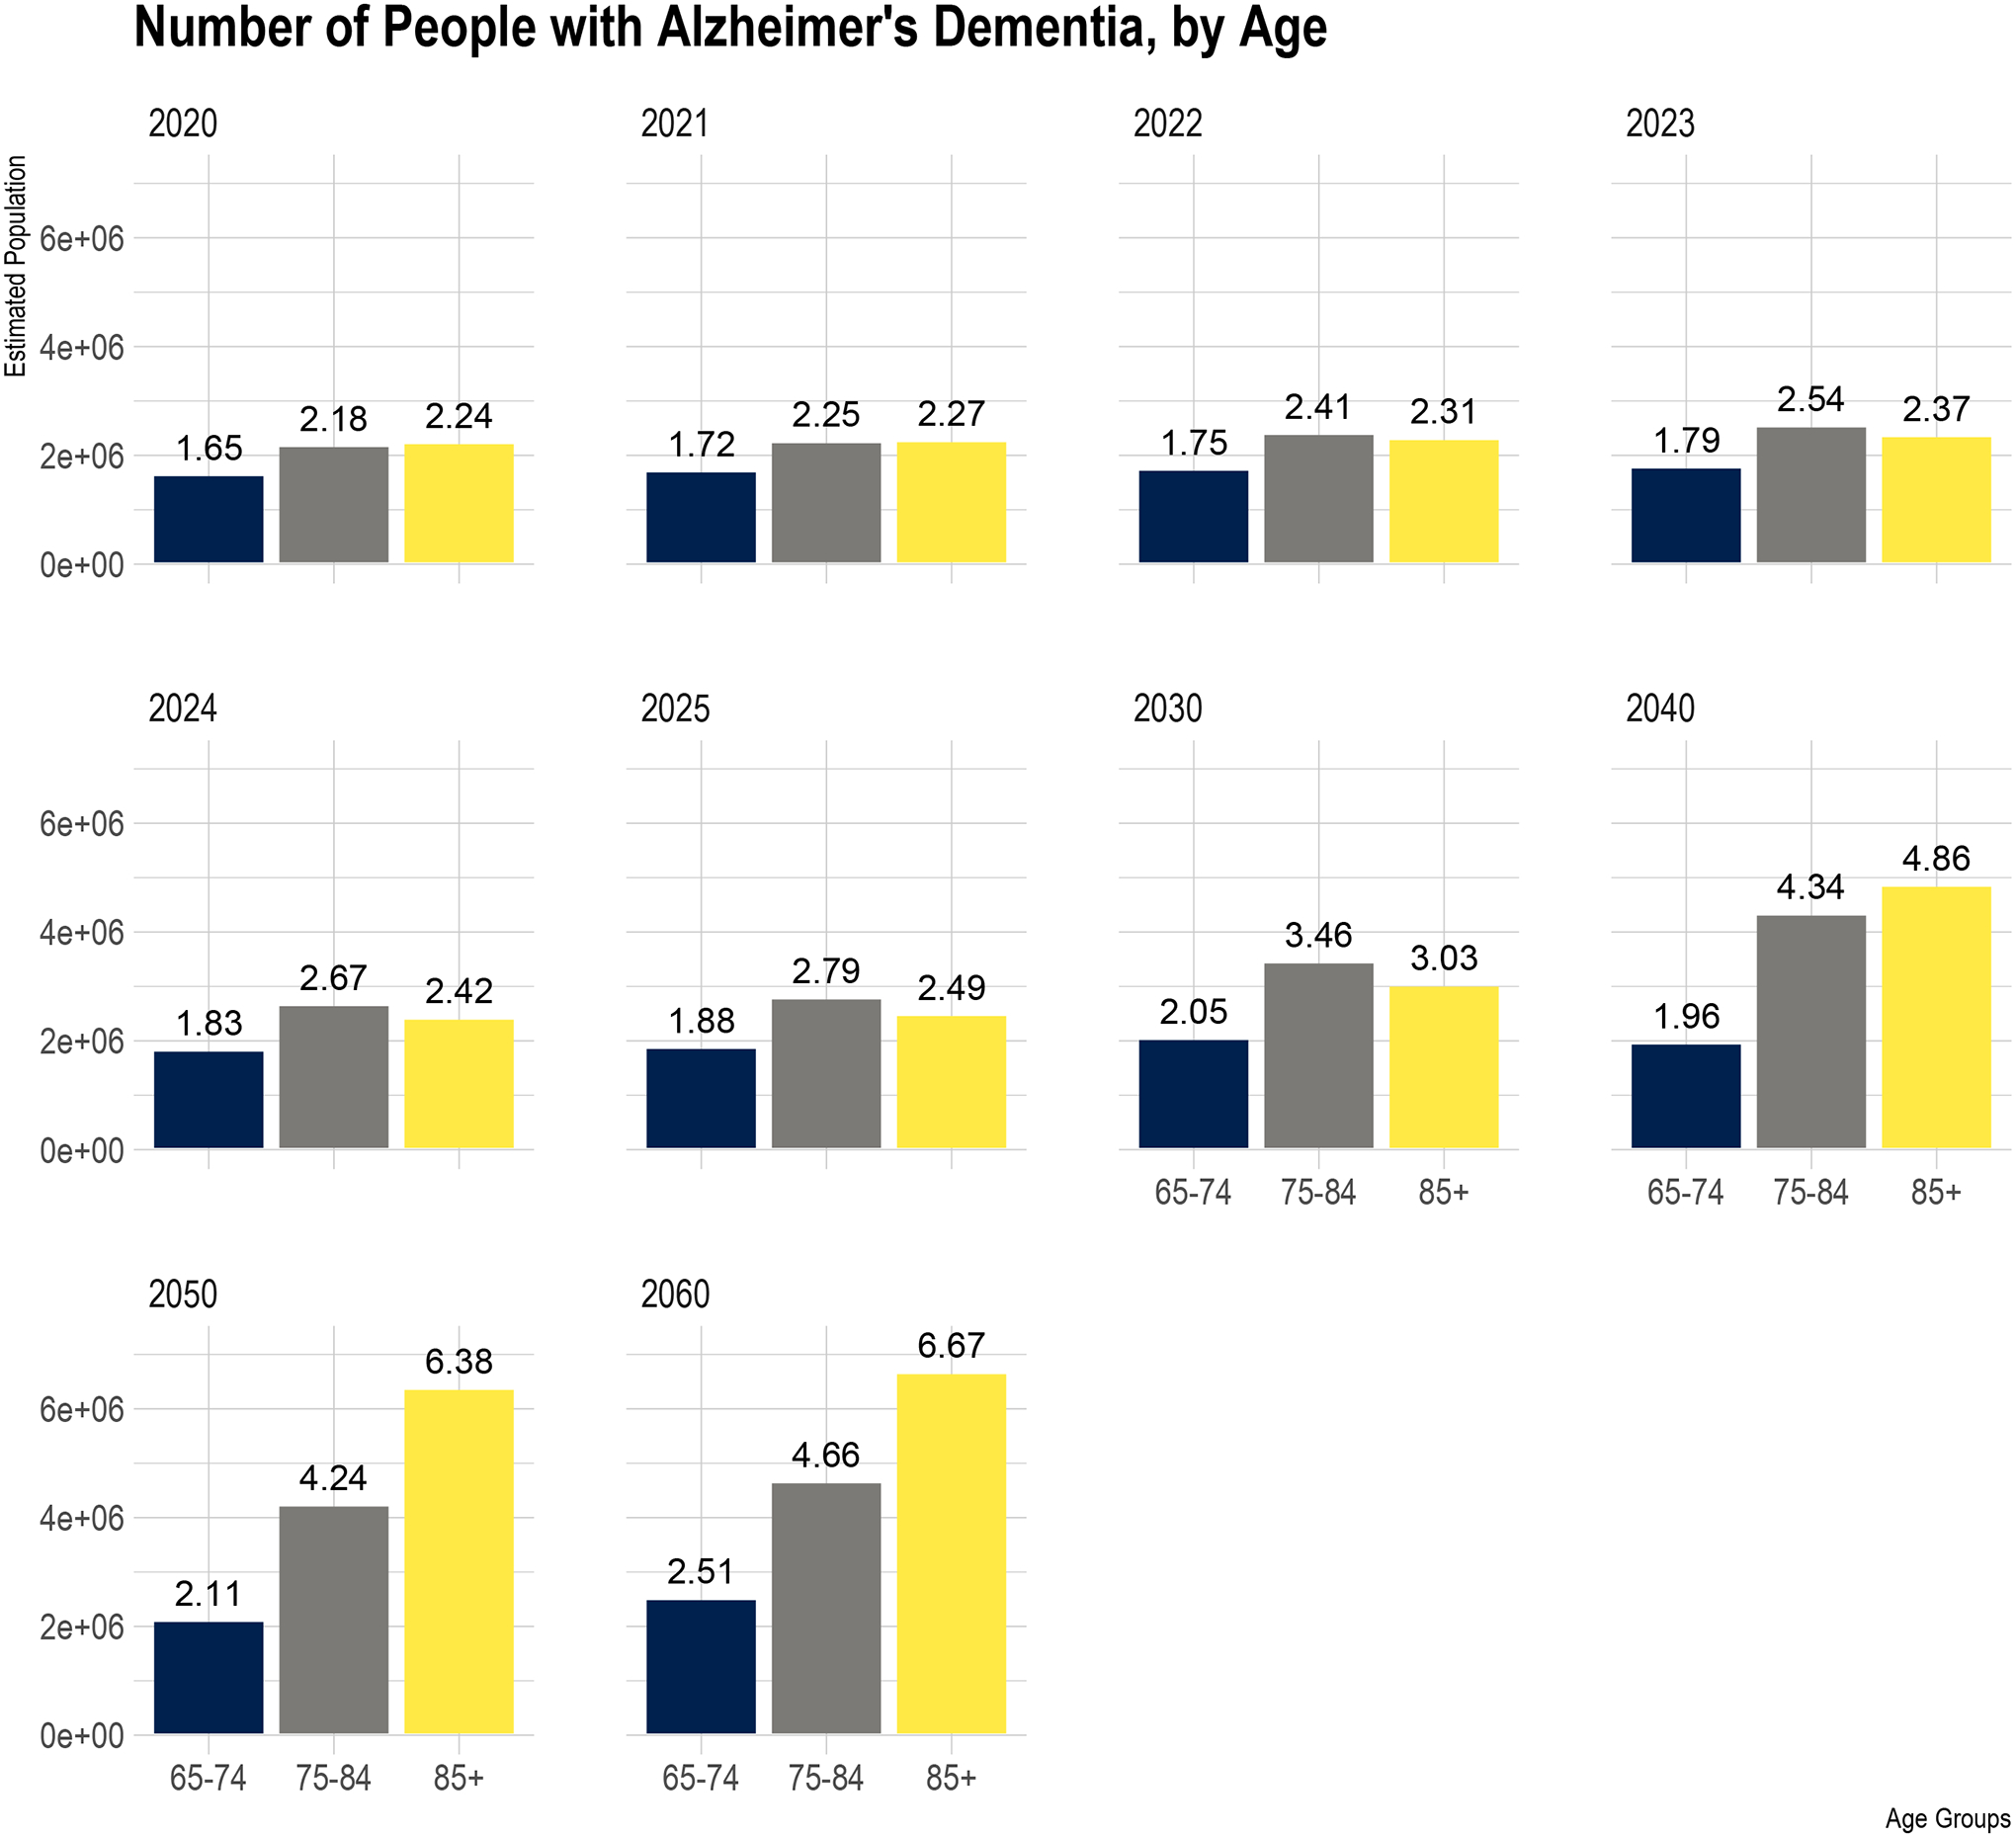
Age Distribution of Projected Number of People in the United States (in millions) with Clinical AD from 2020 to 2060
The blue bar shows the estimated US population between 65–74 years old with clinical AD, the grey bar for ages 75–84, and yellow for over 85 years. The six panels show the estimated US population for the projected population from 2020 to 2060. The estimated number of people above bars are in millions.
The number of people over 85 years old with clinical AD was higher than 65–74 and 75–84 years old in 2020. However, the number of people with clinical AD between 75–84 years old and over 85 years old was identical in 2021 (2.25 vs. 2.27 million). Between 2022 and 2030, the number of 75–84 years old with clinical AD becomes higher than the number of people with clinical AD over 85 years old. The number of over 85 years old continued to increase between 2040 and 2060 than among 75 and 84 years old. These findings suggest the strong influence of significant changes in age demographics on the number of people with clinical AD.
Gender-Specific Number of People with Clinical AD from 2020 through 2060
The number of women with clinical AD increased from 3.74 (95% CI= 3.51, 3.97) million in 2020 to 8.22 (95% CI= 7.99, 8.43) million in 2060 (Figure 2), increasing by 4.48 million (119.7%) women with clinical AD over the next four decades. On the other hand, the number of men with clinical AD increased from 2.34 (95% CI= 2.08, 2.60) million in 2020 to 5.64 (95% CI= 5.36, 5.92) million in 2060, an increase of 3.30 million (141.0%) men with clinical AD between 2020–2060. In 2020, 1.40 million more women have clinical AD than men, with this difference increasing to 2.58 million in 2060. Hence, the gender gap in the number of people with clinical AD continues to widen in the US over the next four decades.
Figure 2.
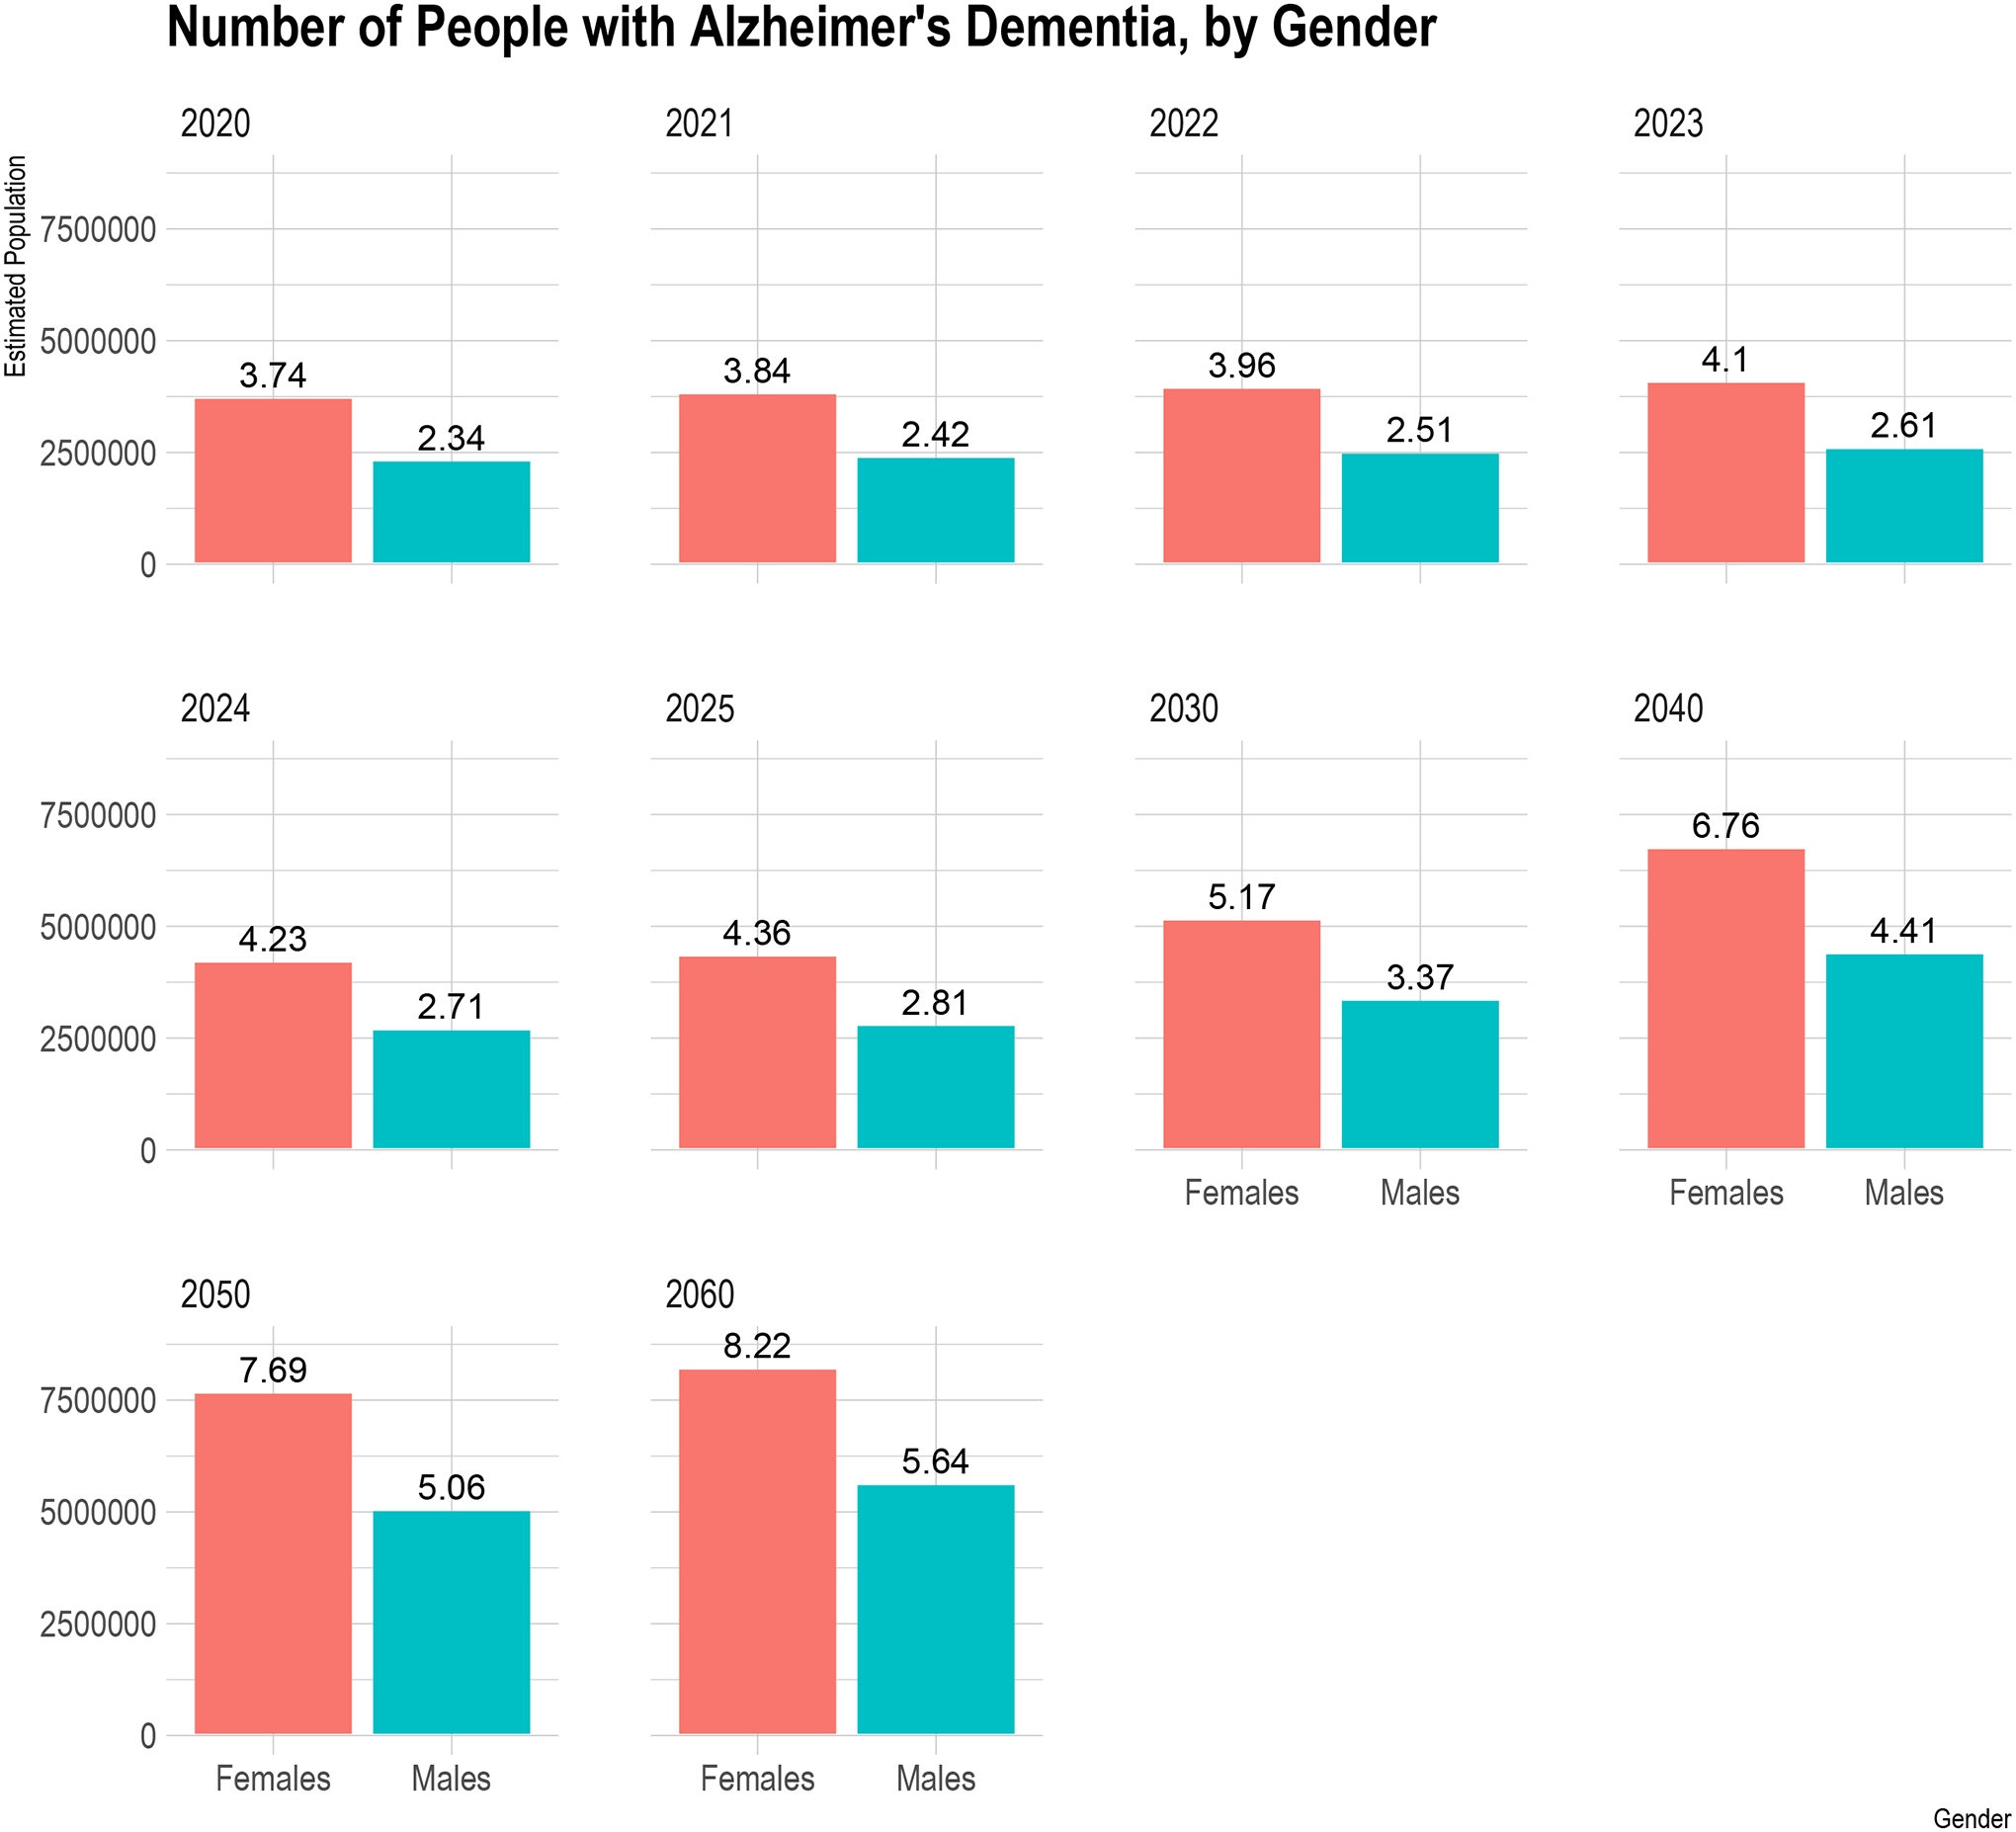
Gender Distribution of Projected Number of People in the United States (in millions) with Clinical AD from 2020 to 2060
The red bar shows the estimated number of females with clinical AD, and the green bar shows the estimated number of men in the US. The six panels show the estimated females and males in the US with clinical AD from 2020 to 2060. The estimated number of people above bars are in millions.
DISCUSSION
In the United States, an estimated 6.07 million adults ages 65 and older have clinical AD in 2020, which will increase to 13.85 million in 2060. The age-specific number of people with clinical AD will also increase, as the post-World War II “baby boom” generation will become increasingly older. In 2020, the number of people living with clinical AD is higher among those over 85 years old than among younger age groups. However, based on our projections for prevalence, starting in 2022, the number of 75–84 years old with clinical AD will exceed 85 years and older with clinical AD. The change in age demography shows a shift in the population burden of clinical AD, with more younger individuals having the disease than in the oldest age groups.
As the US population shifts with increases in the number of minorities, we can expect the number of minorities with clinical AD to increase in the coming years, highlighting the vital need to include underrepresented populations in research studies. Also, of public health significance is that more women have clinical AD in 2020 than men. This gap will continue to widen over the next five years and will have a higher burden on women.30 The significant increases in the overall and demographic-specific number of people with clinical AD will require more significant resources over the coming years.
The 2020 adjusted prevalence of clinical AD was lower than the 2010 adjusted prevalence of clinical AD from the same study population.17,21 The difference in prevalence over the ten years is primarily due to change in population demographics, specifically the significant increase in the number of 65–74 years old and 75–84 years old. The expansion in these age groups is much more significant than the change in 85 years old. The change in population demographics makes the prevalence estimates adjusted for the 2020 US census smaller than the 2010 US census prevalence estimates. However, the 2010 US census adjusted prevalence of clinical AD using our approach was similar to the 2010 US census adjusted prevalence estimates in other epidemiological studies and meta-analyses.19
Several studies have reported a decrease in AD and dementia incidence over the last few decades,31–33 and some were suggesting no recent changes in prevalence and incidence.21,34–35 The projections use prevalence in our study sample, and these might change depending on the future changes in disease occurrence. Similar forecasts can be made with the global burden of disease Institute of Health Metrics data visualization software tools for the US in future years based on ICD conditions.36 Future work comparing the different approaches might provide better estimates of AD and dementia in the population.
The age-specific prevalence of clinical AD was 2–3-fold higher over each of the 10-year age intervals. The 2020 age-specific prevalence of clinical AD was similar to previous estimates.37 The race-specific prevalence of clinical AD is also noteworthy, which was highest among African Americans, followed by Hispanics and non-Hispanic Whites. This finding is consistent with previous findings that African Americans have a much larger prevalence than other racial/ethnic groups.17,18
The number of people with clinical AD in the US is estimated to be 6.07 million, slightly higher than the previously reported 5.8 million.38 However, considering the statistical uncertainty in the two estimates, the two approaches generated estimates that are consistent with each other. The estimate presented here uses the dementia likelihood score based on a short-battery cognitive test in 10,342 participants. In contrast, the previous estimate used the clinical diagnosis of clinical AD in 1,954 people, nearly 1/8 of the CHAP study population with clinically diagnosed clinical AD. Second, the likelihood scores use the population sample, but the previous estimates use a more complex stratified random sampling scheme. However, our population sample used all participants and included no sampling weights in the estimation model.
We also provided the number of people with MCI in the US from 2020 through 2060. The number of people with MCI in the US is twice the number of people living with clinical AD. We estimate that 12.23 million people will have MCI due to all causes in 2020, which will increase to 21.55 million in 2060. This increase in the number of people living with MCI will have implications for AD as people with MCI progress to dementia with high transition probabilities leading to increased clinical AD.39 The increase in the number of MCIs translates to health care costs and caregiving needs of families depending on the level of cognitive impairment.40
This study has important strengths. First, we used likelihood scores rather than clinical diagnoses to estimate the number of people with clinical AD and MCI from 2020 through 2060, decreasing the estimates’ variability and increasing precision with large sample size. We provide the number of people living with clinical AD and MCI from 2020 through 2060, covering a broad spectrum of cognitive impairment. Importantly, we establish the impact of population demographics on the number of people with clinical AD regarding age, race/ethnicity, and sex – the population demographic changes between 2020 and 2060. The likelihood scores also accounted for mortality and missing data. Hence, the influence of attrition on our findings on the estimated number of people with these conditions is minimal.
The study has several limitations. The study was active until 2012, which increases the variability in the projections on the number of people living with cognitive impairment. The 2020 US census adjusted the prevalence of clinical AD and MCI and the number of people with these conditions carried forward to 2020 through 2060 using linear extrapolation. We derived the likelihood scores from a short-battery test. Although the classification accuracy for clinical AD was 0.92, and MCI was 0.89, these scores might not fully capture AD’s clinical diagnosis. Although the estimates for the number of people with clinical AD adjusted for demographic characteristics and weighted the estimates for the projected 2020 US census, there may be some residual confounding in the regression models and the effect of extrapolation on our estimates. Also, the clinical AD scores in these analyses are based on the 1984 NINCDS-ADRDA criteria for AD,41 it is possible that estimates based on the 2011 NIA-AA criteria for AD dementia42 may differ slightly.
The estimates for the number of people with clinical AD and MCI did not include 5% of the US population, not part of the three major racial/ethnic groups. Hence, the number of people living with these conditions is a conservative estimate. Suppose we used clinical AD prevalence in this racial/ethnic group to be the same as combined estimates. In that case, we expect the number of people with clinical AD to be 6.38 million in 2020, reaching 14.68 million in 2060. Our sample size for the Hispanic population was relatively small compared to the non-Hispanic white and African American sample sizes. The CHAP study is a population-based study of people residing in urban Chicago communities. Although the study population has population risk factors comparable to national estimates, the generalizability to the US population requires careful justification. The primary advantages of our study have been very rigorously conducted as compared to most studies of Alzheimer’s disease, including being strictly population-based, of large sample size, of long duration with care to maintain constant methodology, biracial (the largest US racial/ethnic groups, Non-Hispanic white, and African American). For these reasons and the lack of evidence of systematic regional variation within the US, in contrast to strong evidence of racial/ethnic variation, it has enjoyed wide use by others to form US estimates. However, the Hispanic racial/ethnic group is exceedingly small, but we plan to address this limitation in future studies. The education adjustment in regression models used an average of 12 years of education. If the population education levels were lower than 12 years, our estimate is likely conservative since higher education reduces cognitive impairment. However, factorial invariance of education on cognitive test scores can be a potential issue to be addressed in future research.
In summary, the 2020 US census adjusted prevalence and estimate of the number of people living with clinical AD, and MCI provides the population-level impact of mild and severe cognitive impairment on individuals-at-risk and their families. Although the US census adjusted the prevalence of clinical AD might be lower in 2020 than 2010, the number of people living with clinical AD increases dramatically. We expect further changes in these counts as the US population continues to age, with an increasing number of minorities at-risk over the next four decades. More people fall in the over 65 age group, placing higher social, individual, and economic stress on families and society.
Supplementary Material
ACKNOWLEDGEMENTS
This work was supported by grants from the National Institute of Health (NIH) – R01AG057532, R01AG051635, and R01AG058679.
Footnotes
CONFLICTS OF INTEREST
Nothing to Report.
REFERENCES
- 1.Cohn AE, Lingg C. The Burden of Diseases in the United States. Pp. viii, 129, and extra portfolio of charts. New York: Oxford University Press, 1950. [Google Scholar]
- 2.Gruenberg EM. The failures of success. 1977. Milbank Q. 2005;83(4):779–800. [DOI] [PMC free article] [PubMed] [Google Scholar]
- 3.Kramer M The rising pandemic of mental disorders and associated chronic diseases and disabilities. Acta Psychiatr Scand. 1980;62(S285):382–397.7468297 [Google Scholar]
- 4.Rogerson PA, Kim D. Population distribution and redistribution of the baby-boom cohort in the United States: Recent trends and implications. Proc Natl Acad Sci. 2005; 102(43);15319–15324. [DOI] [PMC free article] [PubMed] [Google Scholar]
- 5.Mather M, Jacobsen LA, Pollard KM. Aging in the United States. Population Bulletin. 2015;70. [Google Scholar]
- 6.Knickman JR, Snell EK. The 2030 problem: Caring for aging baby boomers. Health Serv Res. 2002;37(4):849–884. [DOI] [PMC free article] [PubMed] [Google Scholar]
- 7.Peterson PG. Will America group up before it grows old? Atlantic Monthly. 1996; 277(5):55–86. [Google Scholar]
- 8.Colby SL, Ortman JO. US Census Bureau: Projections of the size and composition of the U.S. Population: 2014 to 2060. US Census Bureau. 2015;P25–1143. [Google Scholar]
- 9.Frey W Diversity explosion: How new racial demographics are remaking America. The Brookings Institution, Washington DC, 2018. [Google Scholar]
- 10.Etters L, Godall D, Harrison BE. Caregiver burden among dementia patient caregivers: A review of the literature. J Am Acad Nurse Pract. 2008;20(8):423–428. [DOI] [PubMed] [Google Scholar]
- 11.Livingston AG, Sommerlad A. Ortega V, et al. Dementia prevention, intervention, and care. Lancet. 2017;390(10113):2673–2734. [DOI] [PubMed] [Google Scholar]
- 12.Wimo A, Guerchet M, Ali G-C, et al. The worldwide costs of dementia 2015 and comparisons with 2010. Alzheimers Dement. 2017;13(1):1–7. [DOI] [PMC free article] [PubMed] [Google Scholar]
- 13.Ernst RL, Hay JW. The US economic and social costs of Alzheimer’s disease revisited. Am J Public Health. 1994; 84(8):1261–1264. [DOI] [PMC free article] [PubMed] [Google Scholar]
- 14.Ernst RL, Hay JW, Fenn C, Tinklenberg J, Yesavage JA. Cognitive function and the costs of Alzheimer disease. An exploratory study. Arch Neurol. 1997; 54(6):687–693. [DOI] [PubMed] [Google Scholar]
- 15.Prince M, Ali GC, Guerchet M, Prina AM, Albanese E, Wu YT. Recent global trends in the prevalence and incidence of dementia, and survival with dementia. Alzheimers Res Ther 2016;8(1):23. [DOI] [PMC free article] [PubMed] [Google Scholar]
- 16.Brookmeyer, Evans DA, Hebert L, Langa KM, et al. National estimates of the prevalence of Alzheimer’s disease in the United States. Alzheimers Dement. 2011;7:61–73. [DOI] [PMC free article] [PubMed] [Google Scholar]
- 17.Rajan KB, Weuve J, Barnes LL, Wilson RS, Evans DA. Prevalence and incidence of clinically diagnosed Alzheimer’s disease dementia from 1994 to 2012 in a Biracial Population Sample. Alzheimers Dement. 2019;15(1):1–7. [DOI] [PMC free article] [PubMed] [Google Scholar]
- 18.Steenland K, Goldstein FC, Levey A, Wharton W. A meta-analysis of Alzheimer’s disease incidence and prevalence comparing African Americans and Caucasians. J Alzheimers Dis 2016;50(1):71–6. [DOI] [PMC free article] [PubMed] [Google Scholar]
- 19.Brookmeyer, Evans DA, Hebert L, Langa KM, et al. National estimates of the prevalence of Alzheimer’s disease in the United States. Alzheimers Dement. 2011;7(1):61–73. [DOI] [PMC free article] [PubMed] [Google Scholar]
- 20.Wu Y-T Beiser AS Breteler MMB et al. The changing prevalence and incidence of dementia over time—current evidence. Nat Rev Neurol. 2017;13(6):327–339. [DOI] [PubMed] [Google Scholar]
- 21.Rajan KB, Weuve J, Wilson RS, Barnes LL, Evans DA. Temporal changes in the likelihood of dementia and MCI over 18 years in a population sample. Neurology. 2020;94(3):e292–e298. [DOI] [PMC free article] [PubMed] [Google Scholar]
- 22.Evans DA, Bennett DA, Wilson RS, et al. Incidence of Alzheimer disease in a biracial urban community. Arch Neurol 2003;60(2):185–189. [DOI] [PubMed] [Google Scholar]
- 23.Albert M, Smith LA, Scherr PA, Taylor JO, Evans DA, Funkenstein HH. Use of brief cognitive tests to identify individuals in the community with clinically diagnosed Alzheimer’s disease. Int J of Neurosci 1991;57(3–4):167–178. [DOI] [PubMed] [Google Scholar]
- 24.Smith A Symbol Digits Modalities Test. Western Psychological Services, Los Angeles, 1982. [Google Scholar]
- 25.Folstein MF, Folstein SE, McHugh TR. “Mini-Mental State”. A practical method for grading the cognitive state of patients for the clinician. J Psychiatr Res 1975;12(3):189–198. [DOI] [PubMed] [Google Scholar]
- 26.Wilson RS, Bennett DA, Bienias JL, et al. Cognitive activity and incident AD in a population-based sample of older person. Neurology 2002;59(12):1910–1914. [DOI] [PubMed] [Google Scholar]
- 27.National Population Projections: United States by Age, Gender, Ethnicity and Race for years 2014–2060, released by the U.S. Census Bureau on December 10, 2014, on CDC WONDER Online Database, 2015. Accessed at http://wonder.cdc.gov/population-projections-2014-2060.html on Dec 20, 2020 11:16:43 PM. [Google Scholar]
- 28.Agresti A Categorical data analysis. Wiley Series in Probability and Statistics. 2nd Edition. John Wiley & Sons, Inc., Hoboken, New Jersey, 2002. [Google Scholar]
- 29.Core Team R: A language and environment for statistical computing. R Foundation for Statistical Computing, Vienna, Austria, 2017. [Google Scholar]
- 30.Yang Z, Levey A. Gender differences: A lifetime analysis of the economic burden of Alzheimer’s Disease. Women’s Health Issues. 2015;25(5):436–440. [DOI] [PubMed] [Google Scholar]
- 31.Langa KM, Larson EB, Crimmins EM, et al. A Comparison of the Prevalence of Dementia in the United States in 2000 and 2012. JAMA Intern Med. 2017;177(1):51–58. [DOI] [PMC free article] [PubMed] [Google Scholar]
- 32.Matthews FE, Arthur A, Barnes LE, et al. A two-decade comparison of prevalence of dementia in individuals aged 65 years and older from three geographical areas of England: results of the Cognitive Function and Ageing Study I and II. Lancet 2013;382(9902):1405–1412. [DOI] [PMC free article] [PubMed] [Google Scholar]
- 33.Lobo A, Saz P, Marcos G, et al. Prevalence of dementia in a southern European population in two different time periods: the ZARADEMP Project. Acta Psychiatr Scand 2007;116(4):299–307. [DOI] [PubMed] [Google Scholar]
- 34.Satizabal CL, Beiser AS, Chouraki V, Chêne G, Dufouil C, Seshadri S. Incidence of Dementia over Three Decades in the Framingham Heart Study. N Engl J Med. 2016;374(6):523–532. [DOI] [PMC free article] [PubMed] [Google Scholar]
- 35.Rocca WA, Petersen RC, Knopman DS, et al. Trends in the incidence and prevalence of Alzheimer’s disease, dementia, and cognitive impairment in the United States. Alzheimers Dement. 2011;7(1):80–93. [DOI] [PMC free article] [PubMed] [Google Scholar]
- 36.GBD 2017 Population and Fertility Collaborators. Population and fertility by age and sex for 195 countries and territories, 1950–2017: a systematic analysis for the Global Burden of Disease Study 2017. Lancet. 2018;392(10159):1995–2051. [DOI] [PMC free article] [PubMed] [Google Scholar]
- 37.Hebert LE, Scherr PA, Beckett LA, et al. Age-specific incidence of Alzheimer’s disease in a community population. JAMA. 1995;273(17):1354–1359. [PubMed] [Google Scholar]
- 38.Hebert LE, Weuve J, Scherr PA, Evans DA. Hebert LE, Weuve J, Scherr PA, Evans DA. Alzheimer disease in the United States (2010–2050) estimated using the 2010 census. Neurology. 2013;80(19):1778–1783. [DOI] [PMC free article] [PubMed] [Google Scholar]
- 39.Brookmeyer R, Abdalla N, Kawas CH, Corrada MM. Forecasting the prevalence of preclinical and clinical Alzheimer’s disease in the United States. Alzheimers Dement. 2018;14(2):121–129. [DOI] [PMC free article] [PubMed] [Google Scholar]
- 40.Leibson CL, Long KH, Ransom JE, et al. Direct medical costs and source of cost differences across the spectrum of cognitive decline: a population-based study. Alzheimers Dement. 2015;11(8):917–932. [DOI] [PMC free article] [PubMed] [Google Scholar]
- 41.McKhann G, Drachman D, Folstein M, Katzman R, Price D, Stadlan EM. Clinical diagnosis of Alzheimer’s disease: report of the NINCDS-ADRDA Work Group under the auspices of Department of Health and Human Services Task Force on Alzheimer’s Disease. Neurology. 1984;34(7):939–944. [DOI] [PubMed] [Google Scholar]
- 42.McKhann GM, Knopman DS, Chertkow H, et al. The diagnosis of dementia due to Alzheimer’s disease: recommendations from the National Institute on Aging-Alzheimer’s Association workgroups on diagnostic guidelines for Alzheimer’s disease. Alzheimers Dement. 2011;7(3):263–269. [DOI] [PMC free article] [PubMed] [Google Scholar]
Associated Data
This section collects any data citations, data availability statements, or supplementary materials included in this article.
Supplementary Materials
Data Availability Statement
De-identified data is available on request for qualified investigators from www.riha.rush.edu/dataportal.html.