

Abstract
Early pressure injury (PI) can result in either spontaneous healing (SH) or deterioration into ulcer (DU). However, determining whether PI will progress into SH or DU on the basis of non‐blanchable erythema only is difficult. In this study, we constructed two animal PI models to mimic SH and DU injuries and observed haemorrhage by using ultraviolet (UV) photography to develop potential clinical indicators for predicting the progression of early PI. Macroscopy, UV photography, and skin temperature observations were obtained. In the SH group, macroscopic observation showed the erythema was obvious at 0.5 hours after decompression and faded gradually had almost disappeared at 72 hours. In the DU group, the erythema persisted, and an erosion appeared at 24 hours after decompression and expanded at 36 hours. The erythema developed into an obvious ulcer at 48 hours and enlarged at 72 hours. The obvious ulcer found at 48 hours through macroscopic observation was clearly visible at 36 hours with UV photography, and a significant difference in grey values between the two groups was found at as early as 18 hours (P < .05). This study provided evidence showing that UV photography can predict the different progression stages of early PI. Additionally, when combined with the transparent disc method, UV photography also can be used to identify the circulatory disorders of early PI, such as haemorrhage or hyperaemia and even congestion.
Keywords: circulatory disorders, early pressure injury, erythema, predicting progression, ultraviolet
1. INTRODUCTION
Stage 1 pressure injury (early PI) is defined as intact skin with a localised area of non‐blanchable erythema. 1 Once early PI deteriorates, the patient suffers from physical, psychological, and financial burdens that seriously affect their quality of life. Therefore, preventing the progression of early PI is important. In clinical settings, external force reduction and dressing application are conventionally performed for the treatment of early PI. Recently, aggressive treatments, such as vibration therapy, have been conducted in clinical settings to improve local tissue microcirculation to accelerate the healing of early PI. 2 Marangi et al 3 also attempted autologous adipose tissue transplantation, which proved to be an effective treatment for early PI. These positive interventions provide new methods for treating early PIs. However, some early PIs heal without skin breakdown. 4 , 5 Therapies for treating these early PIs should be different from those used to treat PIs that may advance to higher stages to prevent increasing the suffering of patients and wasting medical resources. However, identifying whether early PI will progress to severe ulcers or heal is difficult. Sato et al 5 found that double erythema and erythema located away from the tips of bony prominences are useful parameters for predicting deterioration. However, the use of these parameters is difficult to popularise because it requires sufficient clinical experience. Moreover, visual skin inspection is a subjective assessment measure that is unreliable and difficult to quantify. 6
The non‐blanchable erythema of early PI is a comprehensive manifestation of complex lesions in the skin, and the aggravation of dermal haemorrhage is a characteristic alteration of its deterioration. 7 Therefore, finding a method to identify the degree of haemorrhage may be beneficial for predicting whether early PI will deteriorate or heal. Previous forensic research has proven that ultraviolet (UV) light sources can enhance the visibility of bruises (intradermal haemorrhage) that are invisible or barely visible under white light. 8 The principle underlying this effect is the absorption of UV light by haemoglobin (Hb). This approach is widely applied in forensic cases for the identification of intradermal hematomas. 9 However, research on the evaluation of early PI by using UV photography does not exist.
In this study, animal models of the different progression stages of early PI were constructed by applying different levels of pressure on hairless rats to simulate the spontaneous healing (SH) or deterioration into ulcer (DU) of early PI. UV photography was utilised as an objective tool to assess the degree of dermal haemorrhage, and verified whether this method can be a potential detection method for predicting the progress of early PI.
2. MATERIALS AND MEDTHODS
2.1. Animals
Five healthy male hairless rats (HWY/Slc, SLC, Inc. Shizuoka, Japan) with an age of 8 weeks old were used in this study. All animals were fed a standard chow diet with free access to water. This study was carried out in strict accordance with the Guide for the Care and Use of Laboratory Animals of the National Institutes of Health. The protocol was approved by the Committee on the Ethics of Animal Experiments of the Nagano College of Nursing (No. 2020‐2).
2.2. PI wound models
Two PI models were constructed in reference to Stadler's study. 10 Briefly, the rats were anaesthetised through the intraperitoneal injection of a mixture of medetomidine hydrochloricde (0.15 mg/kg Domitor, Zenoaq, Fukushima, Japan), midazolam hydrochloride (2.0 mg/kg; Dormicaum; Astellas Pharma, Tokyo, Japan), and butorphanol (2.5 mg/kg; Vetorphale; Meiji Seika Pharma Co., Ltd. Tokyo, Japan) before PI modelling. The PI models were established by controlling pressure with magnets of different attractions after anaesthesia, the symmetrical part of the left or right back skin was lifted gently, and the PI models were established by pressing the dorsal skin for 3.45 hours between two circular neodymium magnets (Niroku Seisakusho Co., Ltd, Japan) with a diameter of 10 mm to exert pressure. The PI models on the left and right sides were categorised as the SH group (using a magnet with a thickness of 2 mm and an attraction of 110 mmHg) and DU group (using a magnet with a thickness of 4 mm and an attraction of 440 mmHg), respectively (Figure 1).
FIGURE 1.

Two pressure injury (PI) models. The PI models were established by pressing the dorsal skin for 3.45 hours between two circular neodymium magnets (10 mm in diameter). The left side (SH group) was pressed by two magnets with a thickness of 2 mm while the right side (DU group) was pressed by two magnets with a thickness of 4 mm. SH, spontaneous healing; DU, deteriorate to ulcer
2.3. Macroscopic observation of PI wounds
Photos of PI wounds were taken by using a digital camera (Optio WG‐3 PENTAX) at 0.5, 6, 12, 18, 24, 48, and 72 hours after decompression. The distance between the skin wounds and camera was fixed at 20 cm. The optical magnification was ×4. The normal skin before the construction of the rat model was designated as the control.
2.4. Evaluation of PI wounds by using a UV dermal camera
2.4.1. UV dermal camera photography
A Dermo‐camera (DZ‐D100, CASIO Co. Japan) was utilised to take photos of PI wounds. Moderate light intensity was selected and set in DERMO CONT mode. The intensity of UV light at 405 nm wavelength was 2.0 mW/cm2 as measured by using an optical power meter (3664, HIOKI Co., Japan). The lens of the dermal camera close adherence to on the PI wounds for continuous photography with white and UV LED light.
2.4.2. Grey value measurement of PI areas
Image Analysis Software (Image J, NIH) was used to analyse the UV photographs taken by using the dermal camera. The grey value of the overall wound (10 mm in diameter) in the SH and DU groups was calculated. The grey value is a numerical measurement that varies from 0 (black) to 255 (white).
The ulcer area (UA), which appeared each time after decompression in the DU group, was measured separately. The other PI area that grey disappeared was recorded as the improvement area (IA) in two groups (Figure 2). The same site was analysed at 0.5, 12, 18, 24, 36, and 48 hours. The average grey value of the IA was calculated by using the following formula:
GV, grey value; IA, improvement area.
FIGURE 2.

Ultraviolet photographs of the pressure injury (PI) wound and grey value of each area in the deteriorate to ulcer group. The left shows the PI wound at 18 hours after decompression, and the right shows the same area at 72 hours when the ulcer had developed and become macroscopic. The UA was marked at different times at the same site in accordance with location and shape at 72 hours. UA, ulcer area; IA, improvement area
2.4.3. Threshold setting and positive rate calculation
Receiver‐operating characteristic (ROC) curves were used to analyse the capability of UV photography to discriminate between SH and DU wounds. A cut‐off value was considered positive if sensitivity and specificity were high. Values below the threshold were considered positive, indicating the high risk of DU. By contrast, values above the value were considered negative, suggesting the high possibility of SH. The ratio of the positive number of the overall wound (SH and DU groups), UA, and IA to the total wound was defined as the positive rate.
2.4.4. Transparent disc method
The transparent disc method was performed to enable simultaneous skin observation. A transparent disc was pressed on the PI wounds after PI model construction. At the same time, dermal camera photography was used to capture the effect of transparent disc pressure on the erythema. The pressure was set at 150 mmHg in accordance with Sprigle's 11 clinical report. The PI area and surrounding skin of the rats were placed on a round platform (2 cm in diameter) then applied with 6.2 N of pressure. The dermal camera was fixed on a digital force gauge (DST series, Imada Co., Japan). Pressure was regulated with an electric stand (MX500N, Imada Co, Japan). The rats were anaesthetised, as mentioned above, to maintain sedation to ensure the accuracy of the pressure. The transparent disc method was performed only at 0.5 hours after decompression to prevent animals from dying from excessive anaesthesia and reduce additional injury to PI wounds.
2.5. Measurement of PI wound temperature
Thermography can acquire the spectrum of the infrared energy emitted by skin and displays temperature distribution on a real‐time basis by visualising infrared energy as a plane. 12 In this study, FLIR i3 Thermal Imager (Azbil Trading Co. Japan), an FLIR i3 infrared ray thermography non‐contact thermometer, was used to detect skin temperature before PI construction and at 0.5, 6, 12, 18, 24, 48, and 72 hours after decompression. This thermometer offered impression infrared image quality with 2% thermal accuracy, <0.15°C thermal sensitivity, and adjustable emissivity. Its measured temperature ranged from −4 °F to 482 °F (−20°C to 250°C). The distance between PI sites and the camera was fixed at 48 cm. The thermometer measured the infrared temperature of 3600 points in the field of view and then integrated this information into a meaningful, real‐time image on a colour LCD screen. After the photos were taken, the images were downloaded to a personal computer for further analysis by using the installed FLIR Tools software (Azbil Trading Co. Japan). Temperature measurements were carried out in a thermostatically controlled environment (average room temperature of 22°C). For the analysis of skin temperature, the thermometer was applied over the PI wounds, and the measurement was conducted three times. The mean value was taken.
2.6. Statistical analysis
The collected data were entered into a database with Excel 2016 software (Microsoft Office 2016). Data were analysed and results were displayed by using GraphPad Prism version 8 (GraphPad Software, La Jolla, California). Frequency and percentages were used to describe categorical variables. Mean and standard deviation were used to present continuous variables. Analysis of variance was conducted to assess differences between groups. ROC curves were utilised to represent the relationship between sensitivity and specificity graphically. Two‐tailed P values less than .05 were considered statistically significant.
3. RESULTS
3.1. Macroscopy and UV dermal camera observation of PI wounds
The progress of PI in the two groups is shown in Figure 3a–i, A–I. The erythema in the SH group was obvious at 0.5 hours after decompression, decreased gradually starting at 24 hours, and partially remained at 48 hours. The erythema had almost disappeared after 72 hours of decompression. In the DU group, the erythema was severe at 0.5 hour and then partially and slightly faded at 12 hours. Then, erosion emerged starting at 24 hours and extended to 36 hours. After 48 hours, the erosion developed into an obvious patchy ulcer and progressed to ulceration at 72 hours. However, the oedema surrounding the ulcer attenuated, and the erythema even partially disappeared at 72 hours. Furthermore, erythema in both groups persisted for more than 24 hours.
FIGURE 3.

Photos taken by the digital camera (visual image) and dermal camera (ultraviolet [UV] image). The a‐i and A‐I are visual images taken by digital camera, a′‐i′ and A′‐I′ are UV images taken by dermal camera for two groups, respectively. “⇓” shows the progression from bushy spots at 0.5 hours after decompression to fusion to ulcers at 72 hours
Figure 3a′–i′, A′–I′ shows the UV images of the PI in the two groups. In the UV images for the SH group, the shadow of the PI peaked at 0.5 hours after decompression (as described in Figure 4). Subsequently, the shadow became uniform and gradually weakened. The shadow had greatly reduced after 48 hours and completely disappeared at 72 hours. The PI area appeared to be whiter than the surrounding skin. In the UV images for the DU group, the bushy spots (White and black arrows) were observed in the PI area at 0.5 hour after decompression, and part of it fused to ulcers in 72 hours. The small erosions were visible at 24 hours and expanded starting at 36 hours. Thereafter, at 48 hours, it fused into thick shadow of the ulcer. By contrast, the shadow around the UA weakened gradually and even disappeared at 72 hours.
FIGURE 4.

Grey value of each area within pressure injury wounds under ultraviolet photography. The dotted line presents the grey value of control skin before pressure was applied on the rats. SH, spontaneous healing; DU, deteriorate to ulcer; UA, ulcer area; IA, improvement area. *P < .05, **P < .01 vs whole area of SH group
Both groups exhibited severe oedema after decompression. The oedema in the SH group ameliorated gradually within 24 hours and disappeared at 48 hours, whereas that in the DU group continued to persist at 72 hours.
3.2. Grey value of PI areas
Figure 4 provides the grey values of the UV images as measured with Image J software. The grey values were 175.7 ± 17.7, 177.9 ± 15.2, 176.1 ± 15.9, and 175.4 ± 20.1 for the whole area of the SH wound, the whole area of the DU wound, the UV of the DU wound, and the IA of the DU wound, respectively. Consistent with the macroscopy results, the grey value of the overall wound in both groups decreased slightly at 0.5 hours. The UA in the DU group showed a significant decrease in grey value compared with that in the SH group (P < .05). After that, no significant changes were observed in the SH group. Overall, all the grey values, except for the grey value of the UA in the DU group, showed an upward trend from 0.5 to 72 hours. The grey value of the UA closed or reached to the control skin at 6 and 12 hours and then continued to decline gradually until 72 hours. In contrast to the grey value of the SH group, the grey value of the UA in the DU group decreased significantly at 0.5 hours and after 18 hours (all P < .05).
3.3. Threshold and positive rate
Figure 5 shows the ROC curve of UV photography vs true skin classification. A ROC curve that rises quickly, that is, when sensitivity and specificity are high, is a good cut‐off level for a diagnostic test. The area under curve (AUC) was 0.901 (95%CI: 0.851–0.952.), and the cut‐off point was 162 (sensitivity = 0.817, specificity = 0.837, P < .001). Values less than the threshold were considered positive and indicated the high risk of DU.
FIGURE 5.

ROC curve of ultraviolet photography vs true skin classification. A ROC curve that rises quickly, that is, when sensitivity and specificity are high, is a good cut‐off level for a diagnostic test. AUC = 0.901, 95%CI: 0.851–0.952. ROC, receiver operator characteristic; AUC, area under curve; CI, confidence interval
Table 1 shows the positive rate of ulcers in each group in accordance with the cut‐off point (162). At 18 hours after decompression, the positive rate of the overall wound in the SH group declined to 10%, whereas that in the DU group increased to 70%. At 0.5 hours after decompression, the positive rate of ulcers in UA was 60%, which was in line with the grey value. By contrast, a low positive rate of 0% to 20% was observed for the whole area and IA of the DU group.
TABLE 1.
Positive rate below the cut‐off value in each area of two groups
| Time | |||||||||
|---|---|---|---|---|---|---|---|---|---|
| Positive rat (%) | After decompression (hr) | ||||||||
| Groups | 0.5 | 6 | 12 | 18 | 24 | 36 | 48 | 72 | |
| SH (N = 10) | Whole Area | 30 | 30 | 20 | 10 | 10 | 10 | 10 | 10 |
| DU (N = 10) | Whole Area | 20 | 10 | 0 | 0 | 0 | 10 | 20 | 10 |
| UA | 60 | 30 | 10 | 70 | 80 | 90 | 90 | 90 | |
| IA | 20 | 10 | 0 | 0 | 0 | 10 | 0 | 0 | |
Abbreviations: DU, deteriorate to ulcer; IA, improvement area; SH, spontaneous healing; UA, ulcer area.
3.4. Observation on the regression of erythema with the transparent disc method
The photos of the PI taken by the dermal camera showed non‐blanchable erythema in both groups after 0.5 hour of decompression (Figure 6). In the SH group, the surrounding area (*) of the PI showed blanchable erythema after 0.5 hours of decompression, whereas the central area presented non‐blanchable erythema that disappeared at 72 hours. In the DU group, a mixture of blanchable erythema (*) and non‐blanchable erythema (#) was observed at the same time. However, some regions in the centre of the PI deteriorated to ulceration, and the non‐blanchable erythema (#) around the ulceration disappeared. UV photography provided significant visual enhancement over white LED, and changes could be identified with increased clarity.
FIGURE 6.
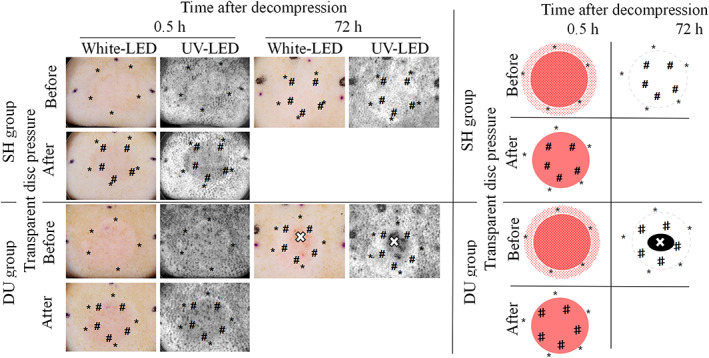
Photographs of erythema before and after the transparent disc method by ultraviolet dermal camera (Left) and those image diagrams (Right) at 0.5 and 72 hours after decompression. Blanchable erythema (*), non‐blanchable erythema (#) that disappeared later were observed within the range of pressure injury wounds in two groups. The ulcer formation (×) within non‐blanchable erythema was observed at 72 hours after decompression in the DU group. SH, spontaneous healing; DU, deteriorate to ulcer
3.5. Temperature of the PI area
As shown in Figure 7, in the SH group, the control skin temperature was 36.6 °C ± 0.4 °C. The temperature then decreased to 35.8 °C ± 0.7 °C at 0.5 hours after decompression and increased to 36.7 °C ± 0.8 °C at 72 hours.
FIGURE 7.

Pressure injury (PI) skin temperature of the SH and DU group at different time points. The skin temperature of the PI wounds in both groups fluctuated during 0.5 and 72 hours. * P < .01. SH, spontaneous healing; DU, deteriorate to ulcer
In the DU group, the control skin temperature was 36.8°C ± 0.3°C. It decreased to 36.3°C ± 1.5°C at 0.5 hour after decompression and increased to 36.9°C ± 0.8°C at 72 hour.
In both groups, the skin temperature of the PI sites fluctuated to a value lower than that of the control at 0.5 hour and increased slightly at 72 hour.
4. DISCUSSION
In this study, first, rat models of early PI that progressed to SH or DU were constructed successfully through the application of light or heavy pressure with magnets of different thicknesses. The healing and deterioration of early PI were observed clearly with the rat models, depending on the degree of injury by pressure. Second, the gradual increase in shadows observed through UV photography was found to be an indicator of increased intradermal haemorrhage. Hb absorption of UV was applied as a distinguishing tool for the identification of the two progressions and had earlier and stronger visual effect than macroscopy observation. Therefore, UV was considered to be a potential indicator for predicting the progression of early PI. Third, the fading of non‐blanchable erythema in early PI may cause by congestion, whereas haemorrhage leads to exacerbation to ulcers. Finally, dynamic alterations in haemorrhage, hyperaemia, and congestion might be accurately recognised by UV photography when combined with the transparent disc method. This approach of UV photography also may be developed as a convenient tool for the objective evaluation of circulatory disorders in early PI.
The need for the early intervention and treatment of early PI in clinical practice to prevent its deterioration has increased with the progress of medical technology. Nevertheless, numerous problems remain. First of all, the progression of early PI is difficult to predict: although non‐blanchable erythema is a diagnostic indicator, early PI can deteriorate to ulcers or heal naturally is also a well‐known fact. 4 , 5 Distinguishing accurately whether PIs will process into ulcers or heal by using the current clinical diagnostic methods is difficult. Halfens et al 4 investigated the prevalence of PI in the Netherlands and found that out of all early PI cases, 22.1% resolved, 22.1% deteriorated, 35.3% remained unchanged, and 20.6% disappeared. They also pointed out that identifying damage that will or will not reverse is difficult. Sato et al 5 followed up 30 patients with 31 cases of early PIs in a long‐term care facility in Japan and found that 11 cases progressed to stage II or worse, whereas 20 cases healed spontaneously. They also found that double erythema and erythema located away from bone protrusions are useful parameters for predicting deterioration. However, popularising the use of these parameters in the clinic is difficult because it must be performed by an assessor with sufficient clinical experience. Other studies have also reported that visual skin examination is a subjective indicator that is unreliable and difficult to quantify. 6 Therefore, we constructed early PI models with different progressions in hairless rats by applying different amounts of pressure to explore accurate objective indicators for the early prediction of PI progression. In the DU group, the erythemic regions did not develop into ulceration entirely. Specifically, some parts of the erythemic regions deteriorated to ulcers, whereas the others disappeared. This condition was basically consistent with Sato's finding of double erythema, indicating that early PI should be located and checked at multiple points during observation and follow‐up to avoid missing potentially worsening PI.
Early PI is a complex pathological lesion involving intradermal ischaemia and reperfusion, vascular engorgement and haemorrhage, tissue degeneration and necrosis, and inflammation, although only non‐blanchable erythema is observed on the skin surface. Witkowski et al 7 conducted the clinical biopsy of 18 and 14 cases of blanchable and non‐blanchable erythema, respectively, and found that the most striking and consistent feature is red blood cell engorgement in the capillaries and venules. Non‐blanchable erythema can be distinguished from blanchable erythema by intradermal diffuse haemorrhage, which seems to be a characteristic pathological lesion associated with deterioration. Therefore, we focused on whether the degree of haemorrhage differed between deteriorated and self‐healing PI.
Hb absorption of UV was used to identify intradermal haemorrhage. The absorption spectra of Hb showed the characteristic with maximum absorptivities at 415 nm. 13 This penetration of UV light at the wavelength into the skin is mainly limited to the dermis, 9 which is exactly where early PI haemorrhages occur. 7 Consequently, in the haemorrhagic area of the skin, the Hb absorbs incident light from light sources and reduces its reflection, resulting in a strong shadow on the skin surface. UV light has been used for the forensic identification of intradermal haemorrhages, that is, UV light enhances the visibility of bruises, which are invisible or barely visible under white light. 8 The emission of the UV light source that we used in this study peaked at 405 nm, which was also within the high absorption range of Hb. In this study, we clearly identified increased intradermal bleeding visually at 36 hours through UV photography (Figure 3). Furthermore, this change was captured by the grey value of UV photography at as early as 18 hours after decompression (Figure 4) and was visible to the naked eye until 48 hours after decompression. All these results showed that the reduction in UV reflection was consistent with the severity of intradermal haemorrhage such that it could objectively predict the deterioration of early PI.
Through the combination of UV photography and the transparent disc method, we observed the manifestations of other circulatory disorders, including hyperaemia and congestion, in addition to haemorrhage in early PI. Many studies have reported that erythema is caused by vascular dilation. The same alterations include hyperaemia and congestion. Among them, hyperaemia results from inflammatory reaction and ischaemic reperfusion, which manifests as blanchable erythema. However, the effect of congestion on early PI has rarely been mentioned, although venous thrombosis, the cause of congestion, has been reported in many clinical and animal studies.
Witkowski et al 7 did not illustrate clearly whether vascular engorgement is caused by hyperaemia or congestion, but their finding of “engorgement of venules” indicates the obstruction of vascular outflow. Hyperaemia and congestion are completely different pathological lesions despite their same manifestation of vascular dilation and red cell engorgement. Hyperaemia is an active process in early PI. Ischaemia/reperfusion after decompression and subsequent inflammatory stimulation leads to increased arterial blood flow in the tissue, improves local circulation, and promotes inflammation, all of which are helpful for tissue repair.
In skin, hyperaemia is manifested as bright redness and appears as blanchable erythema with increased temperature and oedema. Congestion is a passive process resulting from impaired venous return from a tissue. Diminished outflow caused by venous thrombosis leads to congestion. It also manifests as vascular engorgement. Most cases of congestion are chronic, and the skin shows cyanosis, but acute congestion caused by the rapid reperfusion of blood after decompression and the obstruction of outflow resulting from venous thrombosis can also present erythema like hyperaemia. This situation leads to difficulty in distinguishing these lesions on the basis of colour. However, changes in local skin temperature, such as decreased local skin temperature, is a symptom of congestion. Additionally, the effect of the transparent disc method on congestion has not been reported before.
Although the reduction in local skin temperature is a manifestation of congestion, the temperature becomes unstable when hyperaemia (such as inflammation) exists at the same time. The transparent disc compression method showed blanchable erythema in hyperaemia but not the effect of congestion. A part of reversible injury manifested as non‐blanchable erythema in the SH and DU groups (Figure 6, marked with #). We inferred that congestion might be the main component from the following characteristics:
non‐blanchable erythema
erythema lasting for more than 24 hours
strong erythema with low temperature
reversible damage that disappeared spontaneously
Inui et al 14 observed early PI in the clinic by using a dermoscope and found petechial dots and telangiectatic streaks in non‐blanchable erythema under mild compression. However, part of these characteristics would disappear under more intense compression. Therefore, the possibility of hyperaemia or haemorrhage was ruled out but was not further discussed. We speculated that the petechial dots and telangiectatic streaks that appeared in non‐blanchable erythema under mild compression and then disappeared under increased compression may be unstable venous thrombus and congestion, whereas the remaining spot‐like dots may be other thrombosis of artery or vein. This may be consistent with the persistent bushy spots found in this study, but in contrast to the results of a previous study, the congestion and bushy spots did not disappear under 150 mmHg of pressure likely because of the greater pressure applied in the previous study.
Table 2 demonstrates the comparison of the two groups and its summary of results.
TABLE 2.
Observation index and comparison of early PIs with different progression of two groups
| Methods | Macroscopy | UV photography (or combined with transparent disc method) | Thermography | ||||||
|---|---|---|---|---|---|---|---|---|---|
| Index | Erythema | Oedema | Ulceration | Transparent disc method | Thrombosis | Hyperaemia | Congestion | Haemorrhage | Skin temperature |
| Groups | |||||||||
| SH | strong → mild | strong → mild | no | non‐blanchable erythema | mild | mild→ moderate | whole area, uniform | no~mild | unstable |
| DU | erosion → ulcer | severe | IA | mild→ severe (UA) | |||||
Abbreviations: DU, deteriorate to ulcer; IA, improvement area; PI, pressure injury; SH, spontaneous healing; UA, ulcer area; UV, ultraviolet.
We also found that reversible early PI was less harmful and mainly caused by congestion. Severe PI that deteriorated into ulceration was mainly caused by congestion at the early stage after decompression, whereas aggravated bleeding dominated later. The accurate identification of these pathologies is undoubtedly helpful for guiding the early treatment of PI. Congestion is a functional circulation disorder that may be eliminated through thrombolysis or collateral circulation compensation. However, continuous congestion aggravates tissue injury due to the accumulation of metabolites, such as lactic acid. It may also increase capillary pressure and decrease arterial blood inflow, thus aggravating ischaemia. If the progression of early PI could be successfully predicted in clinical settings, targeted early intervention can be performed. For example, stem cell injection might be adopted to treat potential deterioration injury in order to enhance the ability of tissue regeneration and repair, which has been proved to be effective for treatment. 3 On the other hand, for spontaneously healing PI, physical therapy like vibration therapy seems to be more effective in improving local microcirculation and relieving blood stasis to accelerate self‐healing of early PI. 2 In addition, some medications can also be used to inhibit ulceration. A few studies reported that administration of a single dose of ACTH before pressure damage could reduce thrombosis so as to decrease the incidence of pressure ulcer. 15 Local skin application of anticoagulant or thrombolytic agent may also reduce arterial and venous thrombosis, thus alleviating ischaemia or congestion. These are all important topics to be addressed in future research.
Overall, through the observation of early PI with UV photography, we can accurately identify the characteristics of the complex pathogenesis of circulatory disorders. Our approach can achieve visual effects, as well as quantifiable objective indicators. Moreover, it can provide records for comparison during follow‐up. It provides a method for assessing early PI with increased accuracy and reliability. Clinical validation is in process, and the results may be reported in the future.
Finally, the damage to the skin caused by phototoxicity from the use of the UV device should be considered. The previous study 16 demonstrated that the 405 nm light showed no statistically significant loss of viability in human keratinocytes after exposure to 216 J/cm2. The UV light wavelength we used was the same (405 nm) in this study, and the irradiance was 2.0 mW/cm2 as described in the method. With the exposure time of 10 seconds for the observation and photography, the radiant exposure was 0.02 J/cm2, which is much less than 216 J/cm2. Therefore, it can be said that UV photography was safe for human skin. However, the irradiance might be slightly higher when applied to humans owing to the epidermis of hairless rats is thinner than that of humans. 17 Even considering that, it will still be much less than 216 J/cm2. Another side effect is that it may affect human vision when used without protection; therefore, it is necessary to avoid looking directly at the light source.
5. CONCLUSION
This study showed that observing the change with the amount of reflected UV light can accurately detect the degree of haemorrhage and provide more visual enhancement effect than macroscopic observation. Therefore, it can be a useful indicator for predicting the progression of early PI. Moreover, the combination of UV and transparent disk method was used to distinguish the circulatory disorders as haemorrhage, hyperaemia, and congestion, which was able to evaluate the degree of early PI and effects of treatment. This was the first time that we clearly demonstrated that congestion is also an important alteration involved in early PI.
6. LIMITATION
In addition to Hb, melanin is the other main factor that affects UV light absorption in the skin. Consequently, this method is unsuitable or should at least be calibrated for the PI observation of dark skin. Further studies are needed to identify arterial and venous thrombosis, inflammation, and other lesions histopathologically. Furthermore, given that UV photography could not identify the stage before bleeding of PI at 6 and 12 hours after decompression, some important information may have been lost, and the best chance to treat the lesion may have been missed. In addition, this approach is unsuitable for detecting deep tissue injury because the irradiation depth of UV light is limited to the dermis. Finally, the CASIO camera used in this study is a device used by dermatologists for clinical observations. It costs 210 000 JPY (about 1920 USD), which is not an affordable price for widespread clinical applications in places where PI is common, such as hospitals, nursing care facilities for the elderly, and home care. Therefore, it is important to develop a more convenient and cheaper device.
CONFLICT OF INTEREST
The authors declare no conflicts of interest.
ACKNOWLEDGEMENTS
The authors gratefully acknowledge Keiko Kondo (MSN, RN, WOCN) and Yukie Morikami (RN, WOCN) for providing clinical experience about early pressure injury. This study was supported in part by 2020 Nagano Prefecture Special Research Expenses (ET, AK) and Japan Society for the Promotion of Science (JSPS) 18K10510 (ET, AK), http://www.jsps.go.jp/j-grantsinaid/.
Xu H, Wang Y, Takashi E, et al. Predicting the different progressions of early pressure injury by ultraviolet photography in rat models. Int Wound J. 2022;19(4):834‐844. doi: 10.1111/iwj.13681
Huiwen Xu and Yanwei Wang contributed equally to this work.
Funding information 2020 Nagano Prefecture Special Research Expenses, Grant/Award Number: 2020‐1; Japan Society for the Promotion of Science (JSPS), Grant/Award Number: 18K10510
DATA AVAILABILITY STATEMENT
The data that support the findings of this study are available on request from the corresponding author. The data are not publicly available due to privacy or ethical restrictions.
REFERENCES
- 1. European Pressure Ulcer Advisory Panel, National Pressure Injury Advisory Panel, and Pan Pacific Pressure Injury Alliance. Prevention and Treatment of Pressure Ulcers/Injuries: Clinical Practice Guideline. The International Guideline. 3rd ed. Haesler E, ed. 2019. http://internationalguideline.com. Accessed December 27, 2019.
- 2. Arashi M, Sugama J, Sanada H, et al. Vibration therapy accelerates healing of stage I pressure ulcers in older adult patients. Adv Skin Wound Care. 2010;23(7):321‐327. 10.1097/01.ASW.0000383752.39220.fb [DOI] [PubMed] [Google Scholar]
- 3. Marangi GF, Pallara T, Cagli B, et al. Treatment of early‐stage pressure ulcers by using autologous adipose tissue grafts. Plast Surg Int. 2014;2014:1‐6. 10.1155/2014/817283 [DOI] [PMC free article] [PubMed] [Google Scholar]
- 4. Halfens RJ, Bours GJ, Van Ast W. Relevance of the diagnosis 'stage 1 pressure ulcer': an empirical study of the clinical course of stage 1 ulcers in acute care and long‐term care hospital populations. J Clin Nurs. 2001;10(6):748‐757. 10.1046/j.1365-2702.2001.00544.x [DOI] [PubMed] [Google Scholar]
- 5. Sato M, Sanada H, Konya C, Sugama J, Nakagami G. Prognosis of stage I pressure ulcers and related factors. Int Wound J. 2006;3(4):355‐362. 10.1111/j.1742-481X.2006.00267.x [DOI] [PMC free article] [PubMed] [Google Scholar]
- 6. Scafide KN, Narayan MC, Arundel L. Bedside technologies to enhance the early detection of pressure injuries: a systematic review. J Wound Ostomy Continence Nurs. 2020;47(2):128‐136. 10.1097/WON.0000000000000626 [DOI] [PubMed] [Google Scholar]
- 7. Witkowski JA, Parish LC. Histopathology of the decubitus ulcer. J Am Acad Dermatol. 1982;6(6):1014‐1021. 10.1016/s0190-9622(82)70085-4 [DOI] [PubMed] [Google Scholar]
- 8. Olds K, Byard RW, Winskog C, Langlois NEI. Validation of ultraviolet, infrared, and narrow band light alternate light sources for detection of bruises in a pigskin model. Forensic Sci Med Pathol. 2016;12(4):435‐443. 10.1007/s12024-016-9813-x [DOI] [PubMed] [Google Scholar]
- 9. Wright FD, Golden GS. The use of full spectrum digital photography for evidence collection and preservation in cases involving forensic odontology. Forensic Sci Int. 2010;201:59‐67. 10.1016/j.forsciint.2010.03.013 [DOI] [PubMed] [Google Scholar]
- 10. Stadler I, Zhang RY, Oskoui P, et al. Development of a simple, noninvasive, clinically relevant model of pressure ulcers in the mouse. J Investig Surg. 2004;17(4):221‐227. 10.1080/08941930490472046 [DOI] [PubMed] [Google Scholar]
- 11. Sprigle S, Linden M, Riordan B. Analysis of localized erythema using clinical indicators and spectroscopy. Ostomy Wound Manage. 2003;49(3):42‐52. [PubMed] [Google Scholar]
- 12. Verhonick PJ, Lewis DW, Goller HO. Thermography in the study of decubitus ulcers: preliminary report. Nurs Res. 1972;21(3):233‐237. 10.1097/00006199-197205000-00006 [DOI] [PubMed] [Google Scholar]
- 13. Akuwudike AR, Chikezie PC, Chilaka FC. Absorption spectra of normal adults and patients with sickle cell anaemia treated with hydrogen peroxide at two pH values. IJBC. 2013;5:129‐135. [Google Scholar]
- 14. Inui S, Ikegawa H, Itami S. Dermoscopic evaluation of erythema associated with pressure ulcers. Int J Dermatol. 2011;50(8):945‐947. 10.1111/j.1365-4632.2010.04784.x [DOI] [PubMed] [Google Scholar]
- 15. Barton AA. The pathogenesis of skin wounds due to pressure. J Tissue Viability. 2006;16(3):12‐15. 10.1016/s0965-206x(06)63003-9 [DOI] [PubMed] [Google Scholar]
- 16. Ferrer‐Espada R, Liu X, Goh XS, Dai T. Antimicrobial blue light inactivation of Polymicrobial biofilms. Front Microbiol. 2019;10:721. 10.3389/fmicb.2019.00721 [DOI] [PMC free article] [PubMed] [Google Scholar]
- 17. Jung EC, Maibach HI. Animal models for percutaneous absorption. J Appl Toxicol. 2015;35(1):1‐10. 10.1002/jat.3004 [DOI] [PubMed] [Google Scholar]
Associated Data
This section collects any data citations, data availability statements, or supplementary materials included in this article.
Data Availability Statement
The data that support the findings of this study are available on request from the corresponding author. The data are not publicly available due to privacy or ethical restrictions.