

Abstract
Diabetic foot ulcer (DFU) is one of the most serious and alarming diabetic complications, which often leads to high amputation rates in diabetic patients. Machine learning is a part of the field of artificial intelligence, which can automatically learn models from data and better inform clinical decision‐making. We aimed to develop an accurate and explainable prediction model to estimate the risk of in‐hospital amputation in patients with DFU. A total of 618 hospitalised patients with DFU were included in this study. The patients were divided into non‐amputation, minor amputation or major amputation group. Light Gradient Boosting Machine (LightGBM) and 5‐fold cross‐validation tools were used to construct a multi‐class classification model to predict the three outcomes of interest. In addition, we used the SHapley Additive exPlanations (SHAP) algorithm to interpret the predictions of the model. Our area under the receiver‐operating‐characteristic curve (AUC) demonstrated a 0.90, 0.85 and 0.86 predictive ability for non‐amputation, minor amputation and major amputation outcomes, respectively. Taken together, our data demonstrated that the developed explainable machine learning model provided accurate estimates of the amputation rate in patients with DFU during hospitalisation. Besides, the model could inform individualised analyses of the patients' risk factors.
Keywords: amputation, diabetic foot, forecasting, machine learning, precision medicine
1. INTRODUCTION
Increased prevalence of diabetes mellitus in the recent years has raised related complications, thus reducing the quality of life. 1 , 2 Diabetic foot ulcer (DFU) is one of the most serious and alarming diabetic complications, which often leads to high amputation rates in diabetic patients. 3 , 4 DFU accounts for approximately 85% of the more than one million diabetic patients who undergo non‐traumatic lower extremity amputation per year. 5 Besides, 5‐year mortality among patients with a previous limb amputation is more than 50%. 6 , 7 , 8 Therefore, prevention of amputation is essential for the improvement of the quality of life and survival rates in patients with DFU. Predicting the risk of amputation as well as personalised analysis of the risk factors of amputation in the patients with DFU could inform early treatment strategies, enhance the healing rate, reduce amputation rate as well as the cost of treatment. 9
DFU classification systems such as the diabetic ulcer severity score, Meggitt‐Wagner classification, University of Texas diabetic wound classification or site, ischaemia, neuropathy, bacterial infection and depth classification are the commonly used tools in selecting treatment options and predicting the risk of amputation in patients with DFU. 10 , 11 , 12 Although the DFU classification systems have the ability to predict amputation, none of them has been accepted as the gold standard. Most of these systems are mainly based on clinical experience rather than objective statistical methods. Besides, the application of the classification systems requires manual classification by physicians, which reduces clinical output. Moreover, these systems do not comprehensively assess the impact of demographics data, clinical or laboratory data, medical history, foot conditions and other risk factors on the amputation rate, rendering these methods insensitive and non‐specific. 13 , 14 On the other hand, logistic regression model, Cox proportional hazard model, and other generalised linear models have been used to predict the risk of amputation among the patients with DFU. 15 , 16 Whereas these models could be constructed from a variety of potential risk factors, they do not capture the complex non‐linear relationships between the risk factors, leading to a compromised predictive capacity. 17 , 18
Previous studies showed that machine learning, as a branch of artificial intelligence, is widely used for disease diagnostic and prognostic purposes, and confers superior performance compared with the traditional linear models. 19 , 20 , 21 For instance, one study used decision tree algorithm, a simple machine learning method, to predict the risk of amputation in patients with DFU. Despite achievement of certain effects, the decision tree algorithm is easy to overfit and ignores the correlation between the included features, thus the need for more advanced and complex models. 22 However, advanced models often have an extremely complex and computationally intensive process, which could lead to limited interpretability of the output. These models are usually considered “black boxes,” thus receive limited acceptability among physicians. 23
Here, we aimed to develop an advanced machine learning model to predict the risk of in‐hospital amputation among patients with DFU. Besides, we used model‐agnostic methods to optimise the “black boxes” models, to improve the physicians' confidence in the use of the models, and provide new approaches for individualised analyses of the risk factors of amputation in hospitalised patients with DFU.
2. MATERIALS AND METHODS
2.1. Study design and participants
We performed a retrospective cohort study at the Department of Endocrinology of the University‐affiliated hospital between 2009 and 2020. The study included patients with DFU. We excluded patients aged <18 years, patients who died before hospital discharge or underwent amputation before being referred to our institutions as well as those who were referred to other medical institutions during the treatment period. The participants' data were retrieved from electronic health records (EHR). We collected demographic features, medical and medication history, clinical and laboratory data, Wagner Ulcer Classification, Wound, Ischemia, foot Infection (WIfI) Classification, and clinical outcomes (amputation and death) from the EHR during hospitalisation.
The study participants were divided into three groups based on their clinical outcomes: (a) non‐amputation; (b) minor amputation or (c) major amputation group. Minor amputation was defined as any amputation below the ankle, whereas major amputation was defined as amputation above the ankle.
This study was approved by the Ethics Committee of Chongqing University Central Hospital.
2.2. Statistical analyses
Descriptive statistical analyses of the data were separately performed for each of the three groups. On the other hand, continuous variables were presented as a mean ± standard deviation. For normally distributed variables, which were analysed via the Shapiro–Wilk test, we used the t test and ANOVA followed by linear polynomial contrasts for pairwise comparisons and increasing versus decreasing trends analyses between groups, respectively. The variables with skewed distribution were tested using Kruskal‐Wallis and Jonckheere‐Terpstra tests to evaluate the significance of the differences and trends between groups, respectively. In addition, categorical variables were expressed as counts (n) with percentages (%), and the differences and trends between groups were tested by the Chi‐squared test and linear‐by‐linear association Chi‐squared test, respectively. A P value < .05 was considered statistically significant.
2.3. Model development
Light Gradient Boosting Machine (LightGBM) is a method of machine learning, which can provide an efficient and accurate tool for multi‐class classification problems, and was used to construct the model to predict the risk of in‐hospital non‐amputation, minor amputation and major amputation in patients with DFU in our study. 24
The dataset was randomly divided into training (60%), calibration (20%) or testing datasets (20%). The training set was used for model training and determination of the hyperparameters of the model, which was performed using 5‐fold cross‐validation. The training dataset was randomly split into five equal‐sized subsets, and each subset was selected as the testing set in turn while other subsets were used to train the model. Bayesian hyperparameter optimisation based on tree‐Parzen estimator, an efficient hyperparameter tuning method that considers previous tuning information, was used to determine the optimal hyperparameter under the cross‐validation procedure. 25 In addition, the calibration set was used to calibrate the model predictions based on isotonic regression, while Brier score was used to evaluate the coherence between the predicted and observed probabilities. 26 We then used the testing set to evaluate the performance of the developed model.
2.4. Model evaluation
The performance of the model was evaluated in each category using five evaluation metrics: area under the receiver‐operating‐characteristic curve (AUC), sensitivity, specificity, positive predictive value (PPV) and negative predictive value (NPV). The overall model performance was demonstrated by the weighted average of the performance of each category. The weight represented the proportion of each category in the total number of samples.
2.5. Model explanation
SHapley Additive exPlanations (SHAP) algorithm is one of the most popular algorithms used to interpret model output, which enhances the understanding of the predictions to solve the “black box” prediction problem. 27 SHAP values were used to provide a direct measure of the influence of patient variable on the actual predictions under the interaction with other variables. The actual predicted value of the patient was equal to the average predicted value of the model in the training set plus the sum of the SHAP values for all the patient variables. Model development, evaluation and explanation were performed using standard Python packages (Python 3.6.1).
3. RESULTS
3.1. Statistical test results
Baseline characteristics of the 618 patients with DFU enrolled in this study are presented in Table 1. Exactly 61.8% of the patients were men, and the mean age and duration of diabetes were 66.3 years and 9.6 years, respectively. During hospitalisation, 11.5% (71) of the patients underwent minor amputation, while 7.6% (47) underwent major amputation. Our data demonstrated that the patients who had undergone minor amputation or major amputation had elevated inflammatory markers (white blood cells and percentage of neutrophils), more severe foot problems (Wagner score and WIfI score), reduced level of haemoglobin, serum sodium and serum albumin. Besides, these patients were more likely to develop gangrene. Moreover, compared with patients who underwent minor amputation, patients who had major amputation experienced higher white blood cell, serum creatinine, wound score; lower diabetes duration, serum albumin, total cholesterol as well as high‐density lipoprotein (HDL‐C). On the contrary, the patients who had major amputation were less likely to have hypertension, arterial occlusion and history of antihyperglycemic drugs use.
TABLE 1.
Baseline characteristics of patients by clinical outcomes
| Variables | Non‐amputation (n = 500) | Minor amputation (n = 71) | Major amputation (n = 47) | P value for trend |
|---|---|---|---|---|
| Demographic data | ||||
| Age, years | 66.0 ± 12.3 | 68.1 ± 10.4 | 66.4 ± 12.7 | .843 |
| Sex | .327 | |||
| Male, % | 62.6 | 60.6 | 55.3 | |
| Female, % | 37.4 | 39.4 | 44.7 | |
| Body mass index, kg/m2 | 24.2 ± 7.8 | 22.5 ± 3.4* | 22.8 ± 3.4 | .007 |
| Diabetes duration, years | 9.71 ± 7.51 | 10.8 ± 10.2 | 6.98 ± 6.24#▲ | .185 |
| Smoking history, pack‐years | 15.2 ± 28.7 | 12.9 ± 23.7 | 13.3 ± 31.7 | .591 |
| Pre‐hospital delay, days | 47.1 ± 81.2 | 53.9 ± 103.9 | 73.8 ± 95.9# | .010 |
| Medical history | ||||
| Hypertension, % | 56.0 | 66.2 | 42.6▲ | .438 |
| Coronary heart disease, % | 24.8 | 32.4 | 17.0 | .708 |
| Heart failure, % | 18.0 | 23.9 | 14.9 | .921 |
| Cerebral infarction, % | 15.6 | 18.3 | 10.6 | .621 |
| Diabetic neuropathy, % | 75.4 | 64.8 | 66.0 | .041 |
| Diabetic retinopathy, % | 32.2 | 26.8 | 23.4 | .140 |
| Diabetic nephropathy, % | 45.2 | 47.9 | 31.9 | .196 |
| Peripheral vascular disease, % | 36.4 | 42.3 | 36.2 | .687 |
| Arterial occlusion, % | 16.2 | 25.4 | 6.4▲ | .553 |
| Gangrene, % | 16.0 | 73.2* | 72.3# | <.001 |
| Prior DFU, % | 24.8 | 29.6 | 25.5 | .629 |
| Prior amputation, % | 4.8 | 9.9 | 10.6 | .032 |
| Clinical and laboratory data | ||||
| HbA1c, % | 8.65 ± 3.92 | 9.28 ± 4.94 | 9.61 ± 4.29 | .086 |
| HbA1c, mmol/mol | 71.0 ± 32.2 | 78.0 ± 41.5 | 82.0 ± 36.6 | .086 |
| Random blood glucose, mmol/L | 14.6 ± 8.5 | 16.3 ± 7.3 | 16.2 ± 7.8 | .082 |
| White blood cell, g/L | 8.08 ± 4.27 | 10.3 ± 5.1* | 12.4 ± 5.4#▲ | <.001 |
| Percentage of neutrophils, % | 68.9 ± 13.0 | 75.0 ± 10.8* | 78.3 ± 9.4# | <.001 |
| Haemoglobin, g/L | 116.0 ± 21.3 | 106.1 ± 22.0* | 98.7 ± 20.8# | <.001 |
| Serum potassium, mmol/L | 4.06 ± 0.81 | 3.85 ± 0.50* | 3.92 ± 0.88 | .005 |
| Serum sodium, mmol/L | 138.7 ± 8.9 | 137.1 ± 4.7* | 136.5 ± 4.8# | <.001 |
| Serum creatinine, μmol/L | 110.3 ± 114.2 | 107.1 ± 119.2 | 115.7 ± 180.8#▲ | .283 |
| Serum albumin, g/L | 35.4 ± 6.8 | 33.1 ± 5.8* | 29.6 ± 6.1#▲ | <.001 |
| Total cholesterol, mmol/L | 4.27 ± 1.18 | 4.25 ± 1.22 | 3.69 ± 1.18#▲ | .126 |
| Triglyceride, mmol/L | 1.67 ± 1.25 | 1.59 ± 0.74 | 1.40 ± 0.58 | .879 |
| LDL‐C, mmol/L | 2.47 ± 0.84 | 2.46 ± 0.93 | 2.14 ± 0.82# | .137 |
| HDL‐C, mmol/L | 1.07 ± 0.45 | 1.00 ± 0.31 | 0.84 ± 0.30#▲ | <.001 |
| Medication history | ||||
| Antihyperglycemic drugs use | 45.2 | 49.3 | 21.3#▲ | .026 |
| Insulin use | 45.8 | 35.2 | 34.0 | .056 |
| Classification systems | ||||
| Wagner classification system | <.001 | |||
| 0‐3, % | 90.6 | 35.2* | 23.4# | |
| 4‐5, % | 9.4 | 64.8* | 76.6# | |
| WIfI classification system | ||||
| Wound | <.001 | |||
| 0‐2, % | 94.8 | 78.9* | 61.7#▲ | |
| 3, % | 5.2 | 21.1* | 38.3#▲ | |
| Ischaemia, % | 59.8 | 78.9* | 83.0# | <.001 |
| Foot infection | <.001 | |||
| 0‐2, % | 96.6 | 88.7* | 83.0# | |
| 3, % | 3.4 | 11.3* | 17.0# | |
Note: P values in the table were the results of the trend test between the three groups. P value < .05 was considered statistically significant. Bold values indicated significant trend toward increasing or decreasing between no amputation group, minor amputation group, and major amputation group.
Abbreviations: DFU, diabetic foot ulcer; HbA1c, haemoglobin A1c; HDL‐C, high‐density lipoprotein cholesterol; LDL‐C, low‐density lipoprotein cholesterol.
Indicated significant difference between no amputation group and minor amputation group; # indicated significant difference between no amputation group and major amputation group; ▲ means significant difference between minor amputation group and major amputation group, respectively.
3.2. Model performance
The developed model demonstrated the following predictive power based on the AUC (0.5 = a purely random prediction and 1 = perfect discrimination) in the test set, respectively: non‐amputation (0.90), minor amputation (0.86), major amputation (0.85) (Figure 1A ). Other evaluation metrics for the model, including sensitivity, specificity, NPV and PPV, are presented in Table 2. The above‐mentioned findings demonstrated that the multi‐class classification model has a strong predictive power, with weighted‐average AUC (0.90), sensitivity (87.1%), specificity (74.4%), NPV (79.7%) and PPV (86.3%). Besides, the calibration curve for each category is close to the 45° line while the weighted average of Brier score was 0.086, which suggested that the predicted probability of the model was close to the observed probability (Figure 1B ).
FIGURE 1.
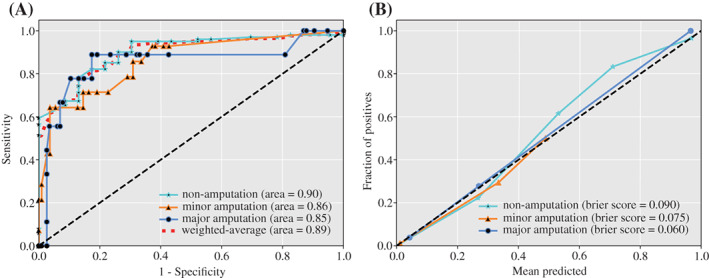
Discrimination and calibration performance of the multi‐class classification model. (A) Receiver‐operating‐characteristic curves (ROC) for each class and their weighted average ROC curve. (B) Calibration curves for each class of the model
TABLE 2.
The values of the evaluation metrics of the multi‐class classification model in the test set
| Evaluation metrics | Non‐amputation | Minor amputation | Major amputation | Overall |
|---|---|---|---|---|
| Sensitivity | 95.0% | 64.3% | 33.3% | 87.1% |
| Specificity | 69.6% | 94.5% | 97.3% | 74.4% |
| NPV | 76.2% | 95.4% | 94.9% | 79.7% |
| PPV | 93.2% | 60.0% | 50.0% | 86.3% |
Abbreviations: NPV, negative predictive value; PPV, positive predictive value.
3.3. Interpretable prediction model
The SHAP algorithm potentially explained how to obtain the predicted probability based on the baseline risk and patient characteristics. For instance, using the model, a patient who underwent minor amputation during hospitalisation showed predicted probability of non‐amputation, minor amputation and major amputation of 0.28, 0.51 and 0.21, respectively (Figure 2). The baseline risks for the patient for non‐amputation, minor amputation or major amputation were 0.76, 0.11 or 0.13, respectively, which were obtained by calculating the average value of the prediction of the model in the training set samples. The calculated predicted probability for non‐amputation showed that a high Wagner score 5 and foot infection score, 3 long diabetes duration (19 years), and presence of gangrene reduced the probability of non‐amputation by −0.34, −0.05, −0.04, and −0.09, respectively, while the rest of the 33 features contributed +0.04. A similar explanation can be applied to the probability of minor amputation and major amputation.
FIGURE 2.
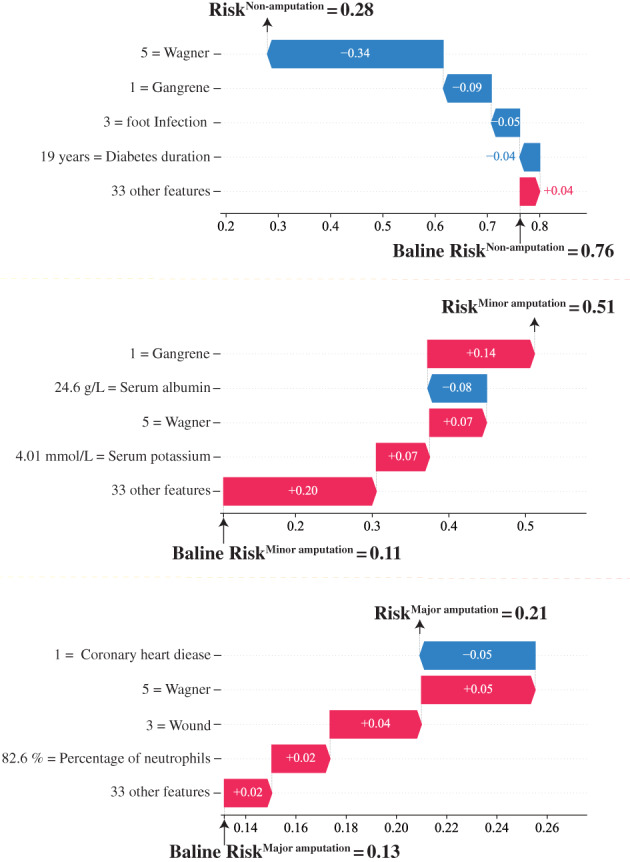
Illustrative example of SHAP algorithm for interpreting the developed model. Illustrative example of how baseline risk and patient characteristics constitute the risk of non‐amputation, minor amputation and major amputation predicted by the model. The baseline risk was obtained by calculating the average value of the prediction of the model in the training set samples
4. DISCUSSION
Here, we used LightGBM to develop a multi‐class classification model, which incorporated 37 baseline characteristics to predict the probability of in‐hospital non‐amputation, minor amputation or major amputation in patients with DFU. The weighted average of AUC and Brier score for the prediction model were 0.90 and 0.086, respectively. These demonstrated strong discriminatory power of the prediction model and indicated reliable coherence between the probability predicted by the model with the observation probability. On the other hand, we used the SHAP algorithm to provide a visual interpretation of the contribution of the patient characteristics to the model predictions. Current DFU classification systems are classical and can provide guidance for clinical practice to some extent. However, because of the limitations of previous methodology and data, these systems often only pay attention to the local condition of patients, and the establishment of the systems was mainly based on clinical experience. 13 , 28 Hence, although a number of these DFU classification systems have been used in the prediction of amputation in patients with DFU, the predictive ability is not satisfactory. 10 , 11 , 12 However, these classification systems provide information about the severity of foot ulcers, such as wound depth, size and foot infection, which cannot be provided by other variables included in our model. Therefore, we incorporated Wagner classification system and WIfI classification system into the model to obtain information related to foot ulcers, so as to predict the risk of amputation more accurately. To some extent, the incorporation of these classification systems into our model can be seen as an improvement of these classification systems with machine learning. Moreover, simple linear models (i.e., logistic regression model, Cox proportional hazard model), which were developed to evaluate the risk of amputation in patients with DFU, were limited by the fact that they only predict a single outcome (the possibility of amputation) and cannot distinguish between minor and major amputation. 16 , 29 , 30 Whereas these models can incorporate more risk factors, they are limited in capturing the non‐linear relationship among the risk factors, and are prone to underfitting, leading to low accuracy and stability. 18 , 31 The emergence and development of machine learning algorithms provide new opportunities to overcome the challenges presented by the simple linear models. We used LightGBM to develop a multi‐class classification model, which is one of the most efficient gradient boosting frameworks. The reason for this choice was that tree‐based models generally outperform neural network models on tabular‐style datasets, while deep learning models are more accurate and appropriate in the fields of computer vision and natural language processing. 32 , 33
In addition to the predictive power, interpretability is also a central character of the model. On the other hand, whereas the model developed in this study showed excellent performance in non‐liner and high‐order relationship between the patient characteristics and amputation, there is controversy on the interpretations of the predictions and are thus considered as “black boxes.” The model used for the training process of the model involved high‐dimensional and complex calculations, which was counterproductive to interpretability, reducing physicians' confidence in the model. Here, SHAP algorithm was used to directly acquire interpretable data about the risk of amputation as predicted by machine learning model, which mitigated the challenges posed by “black‐box” predictions. Ultimately, the SHAP algorithm could promote the understanding and acceptance of the prediction results of the model by the physicians. Thus, the model predictions coupled with the SHAP algorithm yielded robust, interpretable and transparent data, which are critical in precision medicine and selection of the optimal treatment strategy to prevent the occurrence and development of DFU. 34 , 35 , 36
In the example we provided, we observed that more severe foot problems such as higher Wagner score, WIfI score or gangrene increased the risk of minor and major amputation, while decreasing the risk for non‐amputation, which was consistent with clinical experience and previous data. 37 , 38 , 39 Moreover, consistent with previous studies, higher nutritional markers (serum albumin) and inflammatory biomarkers (percentage of neutrophils) also increased the risk of amputation. 40 , 41 Thus, the developed explainable machine learning model yielded a valid outcome.
Our study developed a model using one of the most advanced tree‐based machine learning algorithms with fast training speed, high precision, low memory usage and demonstrated superior performance. Besides, the constructed multi‐classification model allowed simultaneous prediction of the probabilities of non‐amputation, minor amputation and major amputation in patients with DFU during hospitalisation. Ability to distinguish the three different clinical outcomes was of great significance in defining treatment and prognosis of patients. This is because different clinical outcomes have different and profound implications for both the quality of life and survival rate of the patients. In addition, the SHAP algorithm enhanced the transparency of the model while maintaining high accuracy, thus gaining widespread acceptability by physicians, which is critical for the future application of the model. We, for the first time, use multi‐classification machine learning model to predict non‐amputation, minor amputation and major amputation in patients with DFU, as well as the use of model‐agnostic methods to interpret the predictions of the model.
Nevertheless, our study was conducted retrospectively. Although we used internal cross‐validation in building the model, it still lacked external validation cohorts and clinical evidence. In addition, although the SHAP algorithm could determine the influence of the characteristics of patients on the predictions, this was only a mapping relationship between predictive variables and prediction results rather than causations. Besides, whereas the model can automatically handle missing values, important variables such as body mass index and foot ischaemia had some missing values. Moreover, we hope the developed model independent of the current DFU classification systems; however, Wagner classification system and WIfI classification system were included in the model for they can provide additional crucial information about the severity of foot ulcers. Despite these limitations, our study was the first to develop an explainable machine learning model with sufficient accuracy to predict in‐hospital amputation rate of patients with DFU.
Taken together, we successfully established a multi‐classification model to predict the risk of in‐hospital non‐amputation, minor amputation and major amputation in patients with DFU and characterise the predictions of the model using the SHAP algorithm. Our analysis showed that this explainable machine learning model did not only have high predictive ability, but also opened a new platform for individualised analyses of the patients' risk factors.
CONFLICT OF INTEREST
The authors declare no potential conflicts of interest relevant to this article were reported.
CONSENT FOR PUBLICATION
This manuscript has been read and its submission approved by all the co‐authors.
ETHICS APPROVAL AND CONSENT TO PARTICIPATE
The study was approved by the Committee for Research Ethics of Chongqing University Central Hospital.
Xie P, Li Y, Deng B, et al. An explainable machine learning model for predicting in‐hospital amputation rate of patients with diabetic foot ulcer. Int Wound J. 2022;19(4):910‐918. doi: 10.1111/iwj.13691
Puguang Xie and Yuyao Li contributed equally to this work.
Funding information National Institutes of Health, National Institute of Diabetes and Digestive and Kidney Diseases, awarded to Prof. DG Armstrong, Grant/Award Number: 1R01124789‐01A1; the Fundamental Research Funds for the Central Universities, Grant/Award Number: 2021CDJYGRH‐012; the Joint Medical Research Programs of Chongqing Science and Technology Bureau and Health Commission Foundation, Grant/Award Number: 2020GDRC023; the Natural Science Foundation of Chongqing Municipal Science and Technology Bureau, Grant/Award Number: cstc2020jcyj‐msxmX0298
Contributor Information
Yu Ma, Email: 81846846@qq.com.
Wuquan Deng, Email: wuquandeng@cqu.edu.cn.
DATA AVAILABILITY STATEMENT
All the data generated and analysed during this study are included in this published article.
REFERENCES
- 1. Harding JL, Pavkov ME, Magliano DJ, Shaw JE, Gregg EW. Global trends in diabetes complications: a review of current evidence. Diabetologia. 2019;62(1):3‐16. [DOI] [PubMed] [Google Scholar]
- 2. Roglic G. WHO global report on diabetes: a summary. Int J Noncommun Diseases. 2016;1(1):3. [Google Scholar]
- 3. Everett E, Mathioudakis N. Update on management of diabetic foot ulcers. Ann N Y Acad Sci. 2018;1411(1):153‐165. [DOI] [PMC free article] [PubMed] [Google Scholar]
- 4. Mishra SC, Chhatbar KC, Kashikar A, Mehndiratta A. Diabetic foot. BMJ. 2017;359:j5064. [DOI] [PMC free article] [PubMed] [Google Scholar]
- 5. Caravaggi C, Ferraresi R, Bassetti M, et al. Management of ischemic diabetic foot. J Cardiovasc Surg. 2013;54(6):737‐754. [PubMed] [Google Scholar]
- 6. Shahbazian H, Yazdanpanah L, Latifi SM. Risk assessment of patients with diabetes for foot ulcers according to risk classification consensus of international working group on diabetic foot (IWGDF). Pak J Med Sci. 2013;29(3):730‐734. [DOI] [PMC free article] [PubMed] [Google Scholar]
- 7. Young MJ, McCardle JE, Randall LE, Barclay JI. Improved survival of diabetic foot ulcer patients 1995–2008: possible impact of aggressive cardiovascular risk management. Diabetes Care. 2008;31(11):2143‐2147. [DOI] [PMC free article] [PubMed] [Google Scholar]
- 8. Armstrong DG, Wrobel J, Robbins JM. Guest editorial: are diabetes‐related wounds and amputations worse than cancer. Int Wound J. 2007;4(4):286‐287. [DOI] [PubMed] [Google Scholar]
- 9. Monteiro‐Soares M, Russell D, Boyko EJ, et al. Guidelines on the classification of diabetic foot ulcers (IWGDF 2019). Diabetes Metab Res Rev. 2020;36:e3273. [DOI] [PubMed] [Google Scholar]
- 10. Jeon BJ, Choi HJ, Kang JS, Tak MS, Park ES. Comparison of five systems of classification of diabetic foot ulcers and predictive factors for amputation. Int Wound J. 2017;14(3):537‐545. [DOI] [PMC free article] [PubMed] [Google Scholar]
- 11. Santema TB, Lenselink EA, Balm R, Ubbink DT. Comparing the Meggitt‐Wagner and the University of Texas wound classification systems for diabetic foot ulcers: inter‐observer analyses. Int Wound J. 2016;13(6):1137‐1141. [DOI] [PMC free article] [PubMed] [Google Scholar]
- 12. Beckert S, Witte M, Wicke C, Königsrainer A, Coerper S. A new wound‐based severity score for diabetic foot ulcers: a prospective analysis of 1,000 patients. Diabetes Care. 2006;29(5):988‐992. [DOI] [PubMed] [Google Scholar]
- 13. Mehraj M, Shah I. A review of Wagner classification and current concepts in management of diabetic foot. Int J Orthop Sci. 2018;4(1):933‐935. [Google Scholar]
- 14. Kumar VH, Moghadam AGB. A study to test the validity of diabetic ulcer severity score (DUSS) at tertiary care hospital. Int Surg J. 2017;4(12):4010‐4014. [Google Scholar]
- 15. Ferreira L, Carvalho A, Carvalho R. Short‐term predictors of amputation in patients with diabetic foot ulcers. Diabetes Metab Syndr Clin Res Rev. 2018;12(6):875‐879. [DOI] [PubMed] [Google Scholar]
- 16. Boyko EJ, Ahroni JH, Cohen V, Nelson KM, Heagerty PJ. Prediction of diabetic foot ulcer occurrence using commonly available clinical information: the Seattle diabetic foot study. Diabetes Care. 2006;29(6):1202‐1207. [DOI] [PubMed] [Google Scholar]
- 17. Basu A, Manning WG, Mullahy J. Comparing alternative models: log vs cox proportional hazard? Health Econ. 2004;13(8):749‐765. [DOI] [PubMed] [Google Scholar]
- 18. Wright RE. Logistic regression. Reading and Understanding Multivariate Statistics. Washington DC: American Psychological Association; 1995:217‐244. [Google Scholar]
- 19. Ruan Y, Bellot A, Moysova Z, et al. Predicting the risk of inpatient hypoglycemia with machine learning using electronic health records. Diabetes Care. 2020;43(7):1504‐1511. [DOI] [PubMed] [Google Scholar]
- 20. Aminian A, Zajichek A, Arterburn DE, et al. Predicting 10‐year risk of end‐organ complications of type 2 diabetes with and without metabolic surgery: a machine learning approach. Diabetes Care. 2020;43(4):852‐859. [DOI] [PMC free article] [PubMed] [Google Scholar]
- 21. Armstrong DG, Rowe VL, D'Huyvetter K, Sherman RA. Telehealth‐guided home‐based maggot debridement therapy for chronic complex wounds: peri‐and post‐pandemic potential. Int Wound J. 2020;17(5):1490‐1495. [DOI] [PMC free article] [PubMed] [Google Scholar]
- 22. Kasbekar PU, Goel P, Jadhav SP. A decision tree analysis of diabetic foot amputation risk in Indian patients. Front Endocrinol. 2017;8:25. [DOI] [PMC free article] [PubMed] [Google Scholar]
- 23. Gastounioti A, Kontos D. Is it time to get rid of black boxes and cultivate trust in AI? Radiol Artif Intell. 2020;2(3):e200088. [DOI] [PMC free article] [PubMed] [Google Scholar]
- 24. Ke G, Meng Q, Finley T, et al. Lightgbm: a highly efficient gradient boosting decision tree. Paper presented at: Proceedings of the Advances in Neural Information Processing Systems; 2017.
- 25. Bergstra J, Bardenet R, Bengio Y, Kégl B. Algorithms for hyper‐parameter optimization. Paper presented at: Proceedings of the 25th Annual Conference on Neural Information Processing Systems (NIPS 2011).
- 26. Zadrozny B, Elkan C. Transforming classifier scores into accurate multiclass probability estimates. Paper presented at: Proceedings of the Proceedings of the Eighth ACM SIGKDD International Conference on Knowledge Discovery and Data Mining
- 27. Lundberg SM, Erion G, Chen H, et al. From local explanations to global understanding with explainable AI for trees. Nat Mach Intell. 2020;2(1):56‐67. [DOI] [PMC free article] [PubMed] [Google Scholar]
- 28. Oyibo SO, Jude EB, Tarawneh I, Nguyen HC, Harkless LB, Boulton AJ. A comparison of two diabetic foot ulcer classification systems: the Wagner and the University of Texas wound classification systems. Diabetes Care. 2001;24(1):84‐88. [DOI] [PubMed] [Google Scholar]
- 29. Pemayun TGD, Naibaho RM, Novitasari D, Amin N, Minuljo TT. Risk factors for lower extremity amputation in patients with diabetic foot ulcers: a hospital‐based case–control study. Diabet Foot Ankle. 2015;6(1):29629. [DOI] [PMC free article] [PubMed] [Google Scholar]
- 30. Aydin K, Isildak M, Karakaya J, Gürlek A. Change in amputation predictors in diabetic foot disease: effect of multidisciplinary approach. Endocrine. 2010;38(1):87‐92. [DOI] [PubMed] [Google Scholar]
- 31. Lin DY, Wei L‐J. The robust inference for the cox proportional hazards model. J Am Stat Assoc. 1989;84(408):1074‐1078. [Google Scholar]
- 32. Chen T, Guestrin C. Xgboost: a scalable tree boosting system. Paper presented at: 22nd ACM Sigkdd International Conference on Knowledge Discovery and Data Mining.
- 33. Deng L, Yu D. Deep learning: methods and applications. Found Trends Signal Process. 2014;7(3–4):197‐387. [Google Scholar]
- 34. Lundberg S, Lee S‐I. A unified approach to interpreting model predictions. arXiv preprint arXiv:170507874; 2017.
- 35. Lu S, Chen R, Wei W, Lu X. Understanding heart‐failure patients EHR clinical features via SHAP interpretation of tree‐based machine learning model predictions. arXiv preprint arXiv:210311254; 2021. [PMC free article] [PubMed]
- 36. Ramon Y, Martens D, Provost F, Evgeniou T. A comparison of instance‐level counterfactual explanation algorithms for behavioral and textual data: SEDC, LIME‐C and SHAP‐C. Adv Data Anal Classif. 2020;14(4):801‐819. [Google Scholar]
- 37. Mills JL. The application of the Society for Vascular Surgery Wound, ischemia, and foot infection (WIfI) classification to stratify amputation risk. J Vasc Surg. 2017;65(3):591‐593. [DOI] [PubMed] [Google Scholar]
- 38. Zhan LX, Branco BC, Armstrong DG, Mills JL Sr. The Society for Vascular Surgery lower extremity threatened limb classification system based on wound, ischemia, and foot infection (WIfI) correlates with risk of major amputation and time to wound healing. J Vasc Surg. 2015;61(4):939‐944. [DOI] [PubMed] [Google Scholar]
- 39. Sun J‐H, Tsai J‐S, Huang C‐H, et al. Risk factors for lower extremity amputation in diabetic foot disease categorized by Wagner classification. Diabetes Res Clin Pract. 2012;95(3):358‐363. [DOI] [PubMed] [Google Scholar]
- 40. Pierre‐Louis WS, Bath J, Mikkilineni S, et al. Neutrophil to lymphocyte ratio as a predictor of outcomes after amputation. Ann Vasc Surg. 2019;54:84‐91. [DOI] [PubMed] [Google Scholar]
- 41. Kaminski MR, Raspovic A, McMahon LP, et al. Factors associated with foot ulceration and amputation in adults on dialysis: a cross‐sectional observational study. BMC Nephrol. 2017;18(1):1‐11. [DOI] [PMC free article] [PubMed] [Google Scholar]
Associated Data
This section collects any data citations, data availability statements, or supplementary materials included in this article.
Data Availability Statement
All the data generated and analysed during this study are included in this published article.