

Abstract
Background
We aimed to explore the correlation between blood lipids (high density lipoprotein cholesterol [HDL‐C] and apolipoprotein A1 [ApoA1]) and epidermal growth factor receptor (EGFR) T790M mutation, as well as its predictive role in clinical efficacy and progression‐free survial (PFS) in advanced non‐small cell lung cancer (NSCLC) patients treated with EGFR tyrosine kinase inhibitors (EGFR‐TKI).
Methods
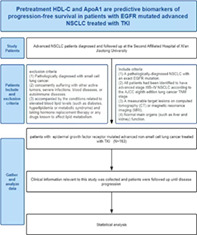
We retrospectively collected information of 153 patients with advanced NSCLC harboring exon EGFR mutation and receiving EGFR‐TKI.
Results
The best cutoff value for HDL‐C and ApoA1 was determined to be 1.15 and 1.14 mmol/l. The overall response rate (ORR) was 67.7% in the high HDL‐C group and 46.6% in the low HDL‐C group, respectively. The ORR of the high ApoA1 group showed a significant increase than that of the low ApoA1 group (68.1% vs. 38.5%). The mean ApoA1 level of the EGFR T790M mutation‐positive group was significantly higher than that of the EGFR T790M mutation‐negative group (1.13 g/l vs. 1.01 g/l). Patients with high ApoA1 levels were related to the EGFR T790M mutation (r = 0.324). (3) The median progression‐free survival (PFS) of the high HDL‐C group and low HDL‐C group were 13.00 months and 10.20 months. The median PFS of the high ApoA1 group and the low ApoA1 group were 12.10 and 10.00 months, respectively. Multivariate Cox stepwise regression model analysis demonstrated ECOG PS, pathological type and HDL‐C were confirmed as critical and independent predictors of PFS.
Conclusions
Patients with EGFR T790M mutations often show higher ApoA1 levels. Peripheral serum HDL‐C and ApoA1 before treatment can be used as potential significant factors for predicting clinical efficacy and PFS in advanced NSCLC patients treated with EGFR‐TKI.
Keywords: advanced non‐small cell lung cancer, apolipoprotein A1, epidermal growth factor receptor, high density lipoprotein cholesterol, progression‐free survival
We retrospectively collected information of 153 patients with advanced non‐small cell lung cancer (NSCLC) harboring exon epidermal growth factor receptor (EGFR) mutation and receiving EGFR tyrosine kinase inhibitors (EGFR–TKI). The study demonstrated ApoA1 after drug resistance was lower than before treatment, and patients with EGFR T790M mutation often show higher apolipoprotein A1 (ApoA1) levels. High density lipoprotein cholesterol (HDL–C) and ApoA1 can be used as critical predictive biomarkers for clinical efficacy and PFS in NSCLC patients treated with EGFR–TKI.
INTRODUCTION
Lung cancer is the leading cause of cancer death. 1 Non‐small lung cancer (NSCLC) accounts for about 85% of all cases and became the predominant histology. 2 About 30%–40% of East Asians are diagnosed with advanced NSCLC with epidermal growth factor receptor (EGFR) mutation. 3 Among them, exon 19 deletions (19‐del) and exon 21 L858R point mutation (21‐L858R) are the most common (90%). 4 Compared with traditional chemotherapy, EGFR‐tyrosine kinase inhibitors (EGFR‐TKI) have achieved curative effects on NSCLC patients with EGFR mutations, especially for patients with 19‐del or 21‐L858R mutation. 5 , 6 However, it is disappointing that after approximately 1 year of treatment, most NSCLC patients have been reported to experience progressive disease (PD) due to acquired drug resistance and the most frequent resistance mechanism is the EGFR T790M mutation (about 50%–60%). 7
Previous reports have revealed that most cancer cells show changes in lipid metabolism and seem to rely more on exogenous lipids to meet the rapid proliferation of tumors. 8 , 9 , 10 Lipid changes in lung cancer patients have been confirmed in multiple studies. 11 , 12 , 13 EGFR signaling events depend on the cholesterol content of lipid rafts. 14 , 15 Depletion of circulating cholesterol levels can damage normal structure of lipid rafts. 14 , 15 , 16 Moreover, previous reports have affirmed the unique position of cholesterol in the acquired resistance of the first generation of EGFR‐TKI. 17 , 18 Surprisingly, clinical data has affirmed the potential of statins combined with EGFR TKI drugs in prolonging survival 19 , 20 and overcoming drug resistance 21 , 22 , 23 . However, there have been very few clinical studies on the efficacy and prognosis of cholesterol in NSCLC patients treated with EGFR‐TKI. Reports on the cholesterol and first‐generation EGFR‐TKI resistance are scarce. In this study, we retrospectively collected the clinicopathological data of NSCLC patients with EGFR mutation who received corresponding EGFR‐TKI treatment to identify the correlation between high density lipoprotein cholesterol (HDL‐C) and apolipoprotein A1 (ApoA1) and EGFR T790M mutation, as well as its predictive role in clinical efficacy.
METHODS
Study patients
A total of 153 NSCLC patients with EGFR mutation treated with EGFR‐TKI (such as gefitinib, erlotinib and osimertinib) at the Second Affiliated Hospital of Xi'an Jiaotong University from January 2015 to December 2020 were enrolled into the study. Patients who met the following criteria were eligible for inclusion: (1) A pathologically‐diagnosed NSCLC with an exact EGFR mutation. (2) All patients had been identified to have advanced stage IIIB–IV NSCLC according to the AJCC eighth edition lung cancer TNM stage. (3) A measurable target lesions on computed tomography (CT) or magnetic resonance imaging (MRI), (4) Normal main organs (such as liver and kidney) function. Patients who fulfilled the following exclusion criteria were: (1) Pathologically diagnosed with small cell lung cancer. (2) concurrently suffering with other active tumors, severe infections, blood diseases, or autoimmune diseases. (3) accompanied by the conditions related to elevated blood lipid levels (such as diabetes, hyperlipidemia or metabolic syndrome) and taking hormone replacement therapy or any drugs known to affect lipid metabolism.
Response assessment and data collection
The primary endpoint of this study was progression‐free survival (PFS). PFS was defined as the time from the start of the study to the first disease progression. According to the response evaluation criteria for solid tumors (RECIST: version 1.1), 24 the patient's response to treatment was divided into complete response (CR), partial response (PR), and stable disease (SD), PD. Disease assessment was determined by regular chest and abdomen CT/enhanced CT, head MRI, and whole‐body PET‐CT. We collected the blood lipid levels of all patients who met the above criteria at the time of initial diagnosis and disease progression.
Statistical analysis
The statistical significance of differences in the HDL‐C and ApoA1 according to the response to EGFR‐TKI was determined by the Welch's t test. The comparison the level of HDL‐C and ApoA1 before and after disease progression was tested by paired t‐test. The receiver operating characteristic (ROC) curves and Youden's index were utilized to determine the optimal cutoff for HDL‐C and ApoA1. The Kaplan–Meier method and log‐rank tests were used to analyze and compare PFS. Cox proportional hazards model was used to identify the independent prognostic factors associated with PFS. All confidence intervals reported were two‐tailed, and p‐values <0.05 were considered statistically significant. Statistical analyses were performed using SPSS software, version 26.0 (SPSS Inc.).
RESULTS
Patient characteristics
The clinical characteristics of the patients are listed in Table 1. A total of 153 NSCLC patients treated with EGFR‐TKI were finally included. There were 88 (57.5%) females, with a mean age of 60 years old, and 117 (76.5%) patients were never smokers. All of the patients were at advanced stage of IIIB–IV. A total of 73.9% (113) of patients were in good condition (ECOG PS 0–1 score). There were 80 (52.3%) cases with EGFR exon 19 deletions (EGFR 19 del), 61 (39.9%) cases with EGFR exon 21 L858R mutation (EGFR 21 L858R) and 12 (7.8%) cases with other rare EGFR mutations. The number of patients who received gefitinib, afatinib or other EGFR‐TKI was 109 (71.2%), 24 (15.7%) and 20 (13.1%).
TABLE 1.
Baseline characteristics of cohort NSCLC patients
| Characteristics | N (%) |
|---|---|
| Age (years) | |
| ≥60 | 83 (54.2) |
| <60 | 70 (45.8) |
| Gender | |
| Male | 65 (42.5) |
| Female | 88 (57.5) |
| Smoking status | |
| Never smoker | 117 (76.5) |
| Smoker | 36 (23.5) |
| ECOG PS | |
| 0–1 | 113 (73.9) |
| 2–4 | 40 (26.1) |
| Stage | |
| IIIB | 26 (17.0) |
| IV | 127 (83.0) |
| Histology | |
| Adenocarcinoma | 144 (94.1) |
| Others | 9 (5.9) |
| EGFR genotype | |
| 19 del | 80 (52.3) |
| 21 L858R | 61 (39.9) |
| Others | 12 (7.8) |
| Type of EGFR TKIs | |
| Gefitinib | 109 (71.2) |
| Afatinib | 24 (15.7) |
| Others | 20 (13.1) |
| HDL‐C (mmol/l) | |
| ≥1.15 | 65 (42.5) |
| <1.15 | 88 (57.5) |
| ApoA1 (g/l) | |
| ≥1.14 | 88 (57.5) |
| <1.14 | 65 (42.5) |
Abbreviations: ECOG PS, Eastern Cooperative Oncology Group performance status; EGFR, epidermal growth factor receptor; EGFR TKI, epidermal growth factor receptor tyrosine kinase inhibitors; HDL‐C, high density lipoprotein cholesterol; ApoA1, apolipoprotein A1.
Cutoff value for HDL‐C and ApoA1
We used PFS greater or shorter than 10 months as the binary variable of the ROC curve. 25 , 26 Based on the highest Youden index (specificity + sensitivity − 1), the best cutoff value for HDL‐C and ApoA1 was determined to be 1.15 mmol/l (AUC = 0.644, 95% CI = 0.537–0.751, p = 0.012, Figure 1a) and 1.14 mmol/l (AUC = 0.612, 95% CI = 0.503–0.721, p = 0.047, Figure 1b).
FIGURE 1.

Receiver‐operating characteristic curves analysis for HDL‐C (a) and ApoA1 (b)
High level of HDL‐C and ApoA1 indicate better response to EGFR‐TKI
According to follow‐up data, an objective response (CR or PR) was achieved in 85 of all 153 patients, indicating a 55.6% overall response rate (ORR), and 144 patients experienced SD or PR, showing a 94.1% disease control rate (DCR). Base on their cutoff value, the patients were classified into HDL‐C high and HDL‐C low group or ApoA1 high and ApoA1 low group. The ORR of the high HDL‐C group was significantly higher than that of the low HDL‐C group (67.7% vs. 46.4%, p = 0.009, Table 2). A similar trend was observed between the high ApoA1 group and the low ApoA1 group (68.1% vs. 38.5%, p < 0.0001, Table 3). In addition, the median HDL‐C and ApoA1 levels of responders (patients with CR + PR) were higher than those of nonresponders (patients with SD or PD) with statistical differences (1.16 mmol/l vs. 1.01 mmol/l, 1.21 g/l vs. 1.13 g/l, p < 0.05, Figure 2).
TABLE 2.
Correlation of HDL‐C and patient efficacy
| N = 153 | HDL‐C ≥ 1.15 (n = 65) | HDL‐C < 1.15 (n = 88) | |
|---|---|---|---|
| CR | 0 | 0 | 0 |
| PR | 85 | 44 | 41 |
| SD | 59 | 19 | 40 |
| PD | 9 | 2 | 7 |
| ORR (%) | 55.6 | 67.7 | 46.6 |
| p = 0.009 | |||
TABLE 3.
Correlation of ApoA1 and patient efficacy
| N = 153 | ApoA1 ≥ 1.14 (n = 88) | ApoA1 < 1.14 (n = 65) | |
|---|---|---|---|
| CR | 0 | 0 | 0 |
| PR | 85 | 60 | 25 |
| SD | 59 | 25 | 34 |
| PD | 9 | 3 | 6 |
| ORR (%) | 55.6 | 68.1 | 38.5 |
| p < 0.0001 |
Abbreviations: HDL‐C, high density lipoprotein cholesterol; ApoA1, apolipoprotein A1; CR, complete response; PR, partial response; SD, stable disease; PD, progressive disease; ORR, objective response rate
FIGURE 2.

An evaluation of HDL‐C (a) and ApoA1 (b) in NSCLC patients with EGFR mutation before EGFR‐TKI therapy according to response (*p < 0.05; **p < 0.01)
HDL‐C and ApoA1 levels decreased after tumor progression
The median follow‐up time for those patients was 9.3 months. Towards the end of the last follow‐up, 93 (60.8%) patients experienced progression. A significant decrease was observed in the median ApoA1 level after disease progression (1.15 g/l [1.02,1.32] vs. 1.08 g/l [0.97,1.26], p = 0.014). However, there was no statistically significant change in HDL‐C before and after disease progression (1.00 g/l [0.88,1.23] vs. 1.10 g/l [0.84,1.31], p > 0.05).
High ApoA1 level correlated to EGFR T790M mutation
As mentioned above, 93 NSCLC patients who were treated with EGFR TKIs experienced disease progression (PD), but rebiopsy was only chosen in 52 patients to clarify the resistance mechanism. The rebiopsy results demonstrated 30 patients harbored the EGFR T790M mutation while 22 did not. The average level of ApoA1 in the EGFR T790M‐positive group was significantly higher than that of the EGFR T790M‐negative group (1.13 g/l vs. 1.01 g/l, p = 0.041) (Figure 3). There was no statistically significant difference in HDL‐C levels between the two groups (1.10 g/l vs. 1.02 g/l, p > 0.05).
FIGURE 3.

An evaluation of ApoA1 in NSCLC patients with or without EGFR T790M mutation. The average level of ApoA1 in the EGFR T790M‐positive group was significantly higher than that of the EGFR T790M‐negative group (a). High ApoA1 levels were related to EGFR T790M mutation in patients (b) (*p < 0.05)
Correlation analysis suggested that the proportion of patients with high ApoA1 in the EGFR T790M‐positive group was higher than that in the EGFR T790M‐negative group (60.00% vs. 27.27%, p = 0.019) (Figure 3), which further indicated patients with high ApoA1 levels were related to the EGFR T790M mutation (r = 0.324).
High level of HDL‐C and ApoA1 predict longer progression‐free survival (PFS) to EGFR‐TKI
The median PFS of all patients was 11.3 months (95% CI: 10.56–12.04, Figure 4). The median PFS of the high HDL‐C group was significantly longer than low HDL‐C group (13.00 months [95% CI: 11.48–14.52] vs. 10.20 months [95% CI: 8.62–11.78], p = 0.036) (Figure 5). Similarly, the median PFS of the high ApoA1 group was obviously longer than that of the low ApoA1 group as well (12.10 months [95% CI: 11.01–13.19] vs. 10.00 months [95% CI: 8.15–11.85], p = 0.048) (Figure 6).
FIGURE 4.

Progression‐free survival (PFS) Kaplan–Meier curve for all patients
FIGURE 5.

Kaplan–Meier curve of progression‐free survival (PFS) according to HDL‐C
FIGURE 6.

Kaplan–Meier curve of progression‐free survival (PFS) according to ApoA1
Univariate Kaplan–Meier survival analysis showed that ECOG PS, smoking status, clinical stage, pathological type, HDL‐C, and ApoA1 were critical predictors of PFS (Table 4). The statistically significant variables in the univariate survival analysis combined with gender and age (clinical experience) were included to perform multivariate Cox regression analysis. The results suggested that only ECOG PS (HR = 1.973, 95% CI: 1.243–3.130) and pathological type (HR = 4.904, 95% CI: 1.782–13.494) were independent predictors of longer‐term PFS in NSCLC patients treated with EGFR‐TKIs (Table 5). In addition, the multivariate Cox stepwise regression model analysis included ECOG PS (HR = 2.094, 95% CI: 1.351–3.245), pathological type (HR = 4.773, 95% CI: 1.798–12.464) and HDL‐C level (HR = 1.644, 95% CI: 1.057–2.557) (Table 6).
TABLE 4.
Univariate analysis of prognostic factors for PFS
| Variable (n) | Median PFS (95% CI) | X 2 values | p‐value |
|---|---|---|---|
| Age | |||
| ≥60 (82) | 11.00 (9.89, 12.11) | 0.430 | 0.512 |
| <60 (71) | 12.00 (10.42, 13.58) | ||
| Gender | |||
| Male (65) | 10.50 (9.40, 11.60) | 0.432 | 0.511 |
| Female (88) | 12.00 (11.22, 12.78) | ||
| Smoking status | |||
| Never smoker (126) | 12.00 (11.06, 12.94) | 5.930 | 0.015 |
| Smoker (27) | 9.60 (8.50, 10.71) | ||
| ECOG PS | |||
| 0–2 (113) | 13.00 (11.16, 14.84) | 10.275 | 0.001 |
| 3–4 (40) | 10.20 (8.59, 11.81) | ||
| Stage | |||
| IIIB (26) | 14.60 (13.13, 16.07) | 5.180 | 0.023 |
| IV (127) | 11.00 (9.87, 12.13) | ||
| Histology | |||
| Adenocarcinoma (144) | 11.50 (10.77, 12.23) | 12.923 | 0.000 |
| Others (9) | 7.80 (2.91, 12.69) | ||
| EGFR genotype | |||
| 19del (80) | 11.50 (10.54, 12.46) | 1.143 | 0.565 |
| L858R (61) | 11.00 (9.28, 12.72) | ||
| Others (13) | 13.00 (6.87, 19.14) | ||
| Type of EGFR TKIs | |||
| Gefitinib (109) | 11.50 (10.59, 12.41) | 1.813 | 0.404 |
| Afatinib (24) | 10.50 (9.20, 11.81) | ||
| Others (20) | 11.00 (7.99, 14.01) | ||
| HDL‐C (mmol/l) | |||
| ≥1.15 (65) | 13.00 (11.48, 14.52) | 4.400 | 0.036 |
| <1.15 (88) | 10.20 (8.62, 11.78) | ||
| ApoA1 (g/l) | |||
| ≥1.14 (88) | 12.10 (11.01, 13.19) | 3.907 | 0.048 |
| <1.14 (65) | 10.00 (8.15, 11.85) |
Abbreviations: ECOG PS, Eastern Cooperative Oncology Group performance status; EGFR, epidermal growth factor receptor; EGFR TKI, epidermal growth factor receptor tyrosine kinase inhibitors; HDL‐C, high density lipoprotein cholesterol; ApoA1, apolipoprotein A1.
TABLE 5.
Multivariate Cox regression analysis of prognostic factors for PFS
| Variable | b | SE (b) | Wald | p‐value | HR | HR 95% CI |
|---|---|---|---|---|---|---|
| Age | −0.216 | 0.240 | 0.807 | 0.369 | 0.806 | (0.503, 1.290) |
| Gender | 0.191 | 0.276 | 0.478 | 0.489 | 1.210 | (0.705, 2.077) |
| Smoking status | 0.546 | 0.356 | 2.346 | 0.126 | 1.726 | (0.858, 3.468) |
| ECOG PS | 0.679 | 0.236 | 8.318 | 0.004 | 1.973 | (1.243, 3.130) |
| Stage | 0.399 | 0.322 | 1.532 | 0.216 | 1.490 | (0.792, 2.804) |
| Histology | 1.590 | 0.516 | 9.481 | 0.002 | 4.904 | (1.782, 13.494) |
| EGFR genotype | −0.036 | 0.179 | 0.040 | 0.842 | 0.965 | (0.679, 1.370) |
| HDL‐C | 0.486 | 0.286 | 2.891 | 0.089 | 1.625 | (0.928, 2.845) |
| ApoA1 | 0.037 | 0.289 | 0.016 | 0.898 | 1.038 | (0.589, 1.828) |
Abbreviations: ECOG PS, Eastern Cooperative Oncology Group performance status; EGFR, epidermal growth factor receptor; HDL‐C, high density lipoprotein cholesterol; ApoA1, apolipoprotein A1; PFS, progression‐free survival.
TABLE 6.
Multivariate stepwise regression model of prognostic factors for PFS
| Variable | b | SE (b) | Wald | p‐value | HR | HR 95% CI |
|---|---|---|---|---|---|---|
| ECOG PS | 0.739 | 0.224 | 10.925 | 0.001 | 2.094 | (1.351, 3.245) |
| Histology | 1.555 | 0.494 | 9.904 | 0.002 | 4.773 | (1.798, 12.464) |
| HDL‐C | 0.497 | 0.225 | 4.864 | 0.027 | 1.644 | (1.057, 2.557) |
Abbreviations: ECOG PS, Eastern Cooperative Oncology Group performance status; HDL‐C, high density lipoprotein cholesterol; PFS, progression‐free survival.
DISCUSSION
In patients with advanced NSCLC, first‐generation EGFR‐TKI have shown good clinical efficacy. Several clinical studies on EGFR‐TKIs showed that clinical factors such as East Asian ethnicity, female sex, adenocarcinoma, and nonsmoking history are predictors of a favorable response in advanced NSCLC. 27 , 28 , 29 EGFR mutations such as EGFR 19 del and EGFR 21 L858R are strong predictors of a good response to EGFR‐TKI. 30 , 31 , 32 Previous reports have shown that, compared with the average control population, lung cancer patients usually have lower serum HDL‐C levels 12 and the reduction of preoperative HDL‐C levels is related to the low survival rate of NSCLC patients. 13 Our study provides evidence that high serum pretreatment HDL‐C or ApoA1 tend to respond better to EGFR‐TKI among NSCLC patients receiving EGFR‐TKI treatment. We also found that the risk of low pretreatment HDL‐C among NSCLC patients was 1.644 times the risk of progression to high pretreatment HDL‐C after adjusting for ECOG PS and pathological types. These findings suggest an interaction between pretreatment HDL‐C and efficacy and prognosis in NSCLC treated with EGFR‐TKI. In agreement with our data, a tendency toward higher HDL‐C levels among NSCLC patients with increased sensitivity to EGFR‐TKI has previously been reported. 33 Compared with patients with low HDL‐C levels, high HDL‐C levels before treatment can reduce the risk of death by 46%, 34 which is also consistent with the results of our study.
Although the association between HDL‐C and cancer risk and prognosis is probably complicated and largely unclear, there is no doubt that HDL‐C has a status that cannot be ignored in cancer occurrence and development. Previous studies provide some possible explanations. HDL has the functions of antioxidation, inhibiting the expression of endothelial cell adhesion molecules 35 , 36 ; as observed in this study, patients with high HDL‐C level before treatment tend to respond better to EGFR‐TKI, which is often related to longer PFS; cancer cell proliferation is accompanied by a variety of cholesterol metabolism changes, including the accumulation of cholesterol in cells to meet the needs of rapid tumor proliferation 37 , 38 ; cancer cells accelerate the uptake of cholesterol by HDL in the peripheral circulation by upregulating scavenger receptor‐B 1(SR‐B1), while reducing the expression of ATP‐binding cassette transporter A1(ABCA1), thereby synergistically reducing Cholesterol output of cancer cells. Eventually, the HDL‐C level in the serum of cancer patients is reduced. 39 , 40 Therefore, low plasma HDL‐C levels are also considered to be an incidental phenomenon of cancer.
Next, our study demonstrated that high ApoA1 levels before EGFR‐TKI treatment in NSCLC patients is associated with better efficacy and longer PFS. Studies have confirmed that elevated ApoA1 gene expression reduces tumor burden and benefits survival. 41 , 42 A meta‐analysis showed that pretreatment serum ApoA1 levels in patients with solid tumors (including NSCLC) in China were significantly correlated with improved prognosis. 43 Additionally, the reduction of serum ApoA1 levels is significantly associated with particular phenotypes of tumor progression, patients with reduced ApoA1 levels show disease progression. 44 As the main protein component of HDL, ApoA1 contributes to HDL's reverse cholesterol transport (RCT). 45 Due to the crucial role of ApoA1 in the RCT pathway, this may mean that the increase of ApoA1 in cancer can enhance cholesterol efflux and RCT, thus inhibiting the proliferation and growth of tumor cells with high cholesterol requirements. 46 It is also reported the physiological functions of ApoA1 include anti‐inflammatory, antiparasitic, antibacterial, and antiviral. 47 The development of tumors is closely related to chronic inflammation, infection, oxidative stress and lipids. 48 , 49 Preclinical studies have shown that the powerful immunomodulatory effect in the tumor microenvironment of ApoA1 leads to the transformation of tumor‐promoting M2 macrophages to antitumor M1 macrophages, improving tumor infiltration and reducing angiogenesis through cytotoxic T cells 42 ; In addition, ApoA1 increase the recruitment of tumor‐killing macrophages and CD8 T cells. 50 Based on the above mechanism, it is reasonable to believe that apoA1 contributes to survival of patients with malignant tumors.
The mechanism of acquired drug resistance involves various cellular pathways, among which the EGFR T790M point mutation plays an important role. Lipid rafts are small lipid‐rich areas in the cell membrane, and their particular structure and function depend on their lipid composition and the target protein involved. 51 EGFR is related to lipid rafts in multiple studies 52 , 53 Our analysis compared the blood lipid levels of the EGFR T790M mutation‐positive group and the EGFR T790M mutation‐negative group and found that the ApoA1 level of the EGFR T790M mutation‐positive group was higher than that of the EGFR T790M mutation‐negative group, and the high ApoA1 level was closely related to the EGFR T790M mutation. At present, there is no direct evidence of the causal relationship between blood lipid level and EGFR T790M mutation. The subsequent studies support our conclusion: the cholesterol level in lipid rafts of gefitinib‐resistant NSCLC cell lines is significantly higher than that of gefitinib‐sensitive cell lines cholesterol levels. 19 Also, EGFR is located in the lipid rafts of the cell membrane of EGFR TKI‐resistant cell lines, and provides a platform for activating Akt signaling. 54 Statins also induce cholesterol depletion in lipid rafts and can restore the sensitivity of drug‐resistant cell lines to gefitinib. 19 , 54 Interestingly, it has been found that combination therapy which inhibits cholesterol synthesis and targets EGFR has an individual potential to overcome resistance to EGFR‐TKI. The combination therapy of EGFR‐TKI and simvastatin can overcome T790M‐mediated EGFR‐TKI resistance by downregulating the AKT/β‐catenin survival pathway 21 and inhibiting RAF/ERK and AKT. 23 Simvastatin treatment can restore the expression of proapoptotic proteins in H1975 cells containing the T790M EGFR mutation. 22
Our study has the following limitations. First, it was retrospective conducted by a single center, which may inevitably bring bias. Second, the sample size of the study was relatively small, and the scope limited. In patients, the reported statistical significance and relevance need to be verified in a more extensive prospective cohort study. Third, a small number of patients received chemotherapy and radiotherapy before receiving EGFR TKIs treatment, which may bring some confounding factors. Fourth, due to the limited study time, there was a lack of correlation analysis between blood lipids and overall survival.
In conclusion, our study demonstrated ApoA1 after drug resistance was lower than before treatment, and patients with EGFR T790M mutations often show higher ApoA1 levels. HDL‐C and ApoA1 can be used as critical predictive biomarkers for clinical efficacy and PFS in NSCLC patients treated with EGFR‐TKIs.
CONFLICT OF INTEREST
The authors have no conflicts of interest to declare.
ACKNOWLEDGMENTS
This project was supported by the National Nature Science Foundation of China (no. 81672300) and Shaanxi Province Key Research and Development Plan (S2019‐YF‐GXYB‐0075).
Ma J, Bai Y, Liu M, Jiao T, Chen Y, Yuan B, et al. Pretreatment HDL‐C and ApoA1 are predictive biomarkers of progression‐free survival in patients with EGFR mutated advanced non‐small cell lung cancer treated with TKI . Thorac Cancer. 2022;13:1126–1135. 10.1111/1759-7714.14367
First Author: Juan Ma.
Funding information National Nature Science Foundation of China, Grant/Award Number: 81672300; Shaanxi Province Key Research and Development Plan, Grant/Award Number: S2019‐YF‐GXYB‐0075
REFERENCES
- 1. Siegel RL, Miller KD, Fuchs HE, et al. Cancer statistics, 2021. CA Cancer J Clin. 2021; 71(1):33. [DOI] [PubMed] [Google Scholar]
- 2. Miller K D, Nogueira L, Mariotto A B, Rowland JH, Yabroff KR, Alfano CM, et al. Cancer treatment and survivorship statistics, 2019. CA Cancer J Clin, 2019; 69(5):363–385. [DOI] [PubMed] [Google Scholar]
- 3. Midha A, Dearden S, McCormack R. EGFR mutation incidence in non‐small‐cell lung cancer of adenocarcinoma histology: a systematic review and global map by ethnicity (mutMapII). Am J Cancer Res. 2015;5(9):2892–911. [PMC free article] [PubMed] [Google Scholar]
- 4. Shigematsu H, Lin L, Takahashi T, Nomura M, Suzuki M, Wistuba II, et al. Clinical and biological features associated with epidermal growth factor receptor gene mutations in lung cancers. JNCI J Natl Cancer Inst. 2005;97(5):339–46. [DOI] [PubMed] [Google Scholar]
- 5. Lara‐Guerra H, Waddell TK, Salvarrey MA, Joshua AM, Chung CT, Paul N, et al. Phase II study of preoperative Gefitinib in clinical stage I non–small‐cell lung cancer. J Clin Oncol. 2009;27(36):6229–36. [DOI] [PubMed] [Google Scholar]
- 6. Roberts PJ, Stinchcombe TE, Der CJ, et al. Personalized medicine in non–small‐cell lung cancer: is KRAS a useful marker in selecting patients for epidermal growth factor receptor–targeted therapy? J Clin Oncol. 2010;28(31):4769–77. [DOI] [PubMed] [Google Scholar]
- 7. Arcila ME, Oxnard GR, Nafa K, Riely GJ, Solomon SB, Zakowski MF, et al. Rebiopsy of lung cancer patients with acquired resistance to EGFR inhibitors and enhanced detection of the T790M mutation using a locked nucleic acid‐based assay. Clin Cancer Res. 2011;17(5):1169–80. [DOI] [PMC free article] [PubMed] [Google Scholar]
- 8. Ackerman D, Simon MC. Hypoxia, lipids, and cancer: surviving the harsh tumor microenvironment. Trends Cell Biol. 2014;24(8):472–8. [DOI] [PMC free article] [PubMed] [Google Scholar]
- 9. Ackerman D, Tumanov S, Qiu B, Michalopoulou E, Spata M, Azzam A, et al. Triglycerides promote lipid homeostasis during hypoxic stress by balancing fatty acid saturation. Cell Rep. 2018;24(10):2596–605. [DOI] [PMC free article] [PubMed] [Google Scholar]
- 10. Kamphorst JJ, Cross JR, Fan J, de Stanchina E , Mathew R, White EP, et al. Hypoxic and Ras‐transformed cells support growth by scavenging unsaturated fatty acids from lysophospholipids. Proc Natl Acad Sci. 2013;110(22):8882–7. [DOI] [PMC free article] [PubMed] [Google Scholar]
- 11. Zhou T, Zhan J, Fang W, Zhao Y, Yang Y, Hou X, et al. Serum low‐density lipoprotein and low‐density lipoprotein expression level at diagnosis are favorable prognostic factors in patients with small‐cell lung cancer (SCLC). BMC Cancer. 2017;17(1):269. [DOI] [PMC free article] [PubMed] [Google Scholar]
- 12. Lin X, Lu L, Liu L, Wei S, He Y, Chang J, et al. Blood lipids profile and lung cancer risk in a meta‐analysis of prospective cohort studies. J Clin Lipidol. 2017;11(4):1073–81. [DOI] [PubMed] [Google Scholar]
- 13. Chi PD, Liu W, Chen H, Zhang JP, Lin Y, Zheng X, et al. High‐density lipoprotein cholesterol is a favorable prognostic factor and negatively correlated with C‐reactive protein level in non‐small cell lung carcinoma. PLoS One. 2014;9(3):e91080. [DOI] [PMC free article] [PubMed] [Google Scholar]
- 14. Adam RM, Mukhopadhyay NK, Kim J, di Vizio D, Cinar B, Boucher K, et al. Cholesterol sensitivity of endogenous and myristoylated Akt. Cancer Res. 2007;67(13):6238–46. [DOI] [PubMed] [Google Scholar]
- 15. Chen X, Resh MD. Cholesterol depletion from the plasma membrane triggers ligand‐independent activation of the epidermal growth factor receptor. J Biol Chem. 2002;277(51):49631–7. [DOI] [PubMed] [Google Scholar]
- 16. Elmore S. Apoptosis: a review of programmed cell death. Toxicol Pathol. 2007;35(4):495–516. [DOI] [PMC free article] [PubMed] [Google Scholar]
- 17. Howell MC, Green R, Khalil R, Foran E, Quarni W, Nair R, et al. Lung cancer cells survive epidermal growth factor receptor tyrosine kinase inhibitor exposure through upregulation of cholesterol synthesis. FASEB BioAdv. 2019;2(2):90–105. [DOI] [PMC free article] [PubMed] [Google Scholar]
- 18. Terai H, Kitajima S, Potter DS, Matsui Y, Quiceno LG, Chen T, et al. ER stress signaling promotes the survival of cancer “Persister cells” tolerant to EGFR tyrosine kinase inhibitors. Cancer Res. 2018;78(4):1044–57. [DOI] [PMC free article] [PubMed] [Google Scholar]
- 19. Chen Q, Pan Z, Zhao M, Wang Q, Qiao C, Miao L, et al. High cholesterol in lipid rafts reduces the sensitivity to EGFR‐TKI therapy in non‐small cell lung cancer. J Cell Physiol. 2018;233(9):6722–32. [DOI] [PubMed] [Google Scholar]
- 20. Fiala O, Pesek M, Finek J, Minarik M, Benesova L, Bortlicek Z, et al. Statins augment efficacy of EGFR‐TKIs in patients with advanced‐stage non‐small cell lung cancer harbouring KRAS mutation. Tumor Biology. 2015;36(8):5801–5. [DOI] [PubMed] [Google Scholar]
- 21. Hwang K, Kwon S, Kim Y, Park DS, Kim BR, Yoon KH, et al. Effect of simvastatin on the resistance to EGFR tyrosine kinase inhibitors in a non‐small cell lung cancer with the T790M mutation of EGFR. Exp Cell Res. 2014;323(2):288–96. [DOI] [PubMed] [Google Scholar]
- 22. Lee HY, Kim IK, Lee HI, Mo JY, Yeo CD, Kang HH, et al. The apoptotic effect of simvastatin via the upregulation of BIM in nonsmall cell lung cancer cells. Exp Lung Res. 2016;42(1):14–23. [DOI] [PubMed] [Google Scholar]
- 23. Park IH, Kim JY, Jung JI, Han JY. Lovastatin overcomes gefitinib resistance in human non‐small cell lung cancer cells with K‐Ras mutations. Invest New Drugs. 2010;28(6):791–9. [DOI] [PubMed] [Google Scholar]
- 24. Eisenhauer EA, Therasse P, Bogaerts J, Schwartz LH, Sargent D, Ford R, et al. New response evaluation criteria in solid tumours: revised RECIST guideline (version 1.1). Eur J Cancer. 2009;45(2):228–47. [DOI] [PubMed] [Google Scholar]
- 25. Zhang Y, Feng Y, Zhu H, Xiong TC, Hou YS, Song J, et al. The peripheral blood neutrophil‐to‐lymphocyte ratio is a prognostic predictor for survival of EGFR‐mutant nonsmall cell lung cancer patients treated with EGFR‐TKIs. Medicine. 2018;97(30):e11648. [DOI] [PMC free article] [PubMed] [Google Scholar]
- 26. Ono T, Igawa S, Kurahayashi S, Okuma Y, Sugimoto A, Kusuhara S, et al. Impact of neutrophil‐to‐lymphocyte ratio in patients with EGFR‐mutant NSCLC treated with tyrosine kinase inhibitors. Invest New Drugs. 2020;38(3):885–93. [DOI] [PubMed] [Google Scholar]
- 27. Tsao MS, Sakurada A, Cutz JC, Zhu CQ, Kamel‐Reid S, Squire J, et al. Erlotinib in lung cancer ‐ molecular and clinical predictors of outcome. N Engl J Med. 2005;353(2):133–44. [DOI] [PubMed] [Google Scholar]
- 28. Mitsudomi T, Kosaka T, Endoh H, Horio Y, Hida T, Mori S, et al. Mutations of the epidermal growth factor receptor gene predict prolonged survival after gefitinib treatment in patients with non‐small‐cell lung cancer with postoperative recurrence. J Clin Oncol. 2005;23(11):2513–20. [DOI] [PubMed] [Google Scholar]
- 29. Thatcher N, Chang A, Parikh P, Rodrigues Pereira J, Ciuleanu T, von Pawel J , et al. Gefitinib plus best supportive care in previously treated patients with refractory advanced non‐small‐cell lung cancer: results from a randomised, placebo‐controlled, multicentre study (Iressa survival evaluation in lung cancer). Lancet. 2005;366(9496):1527–37. [DOI] [PubMed] [Google Scholar]
- 30. Rosell R, Moran T, Queralt C, Porta R, Cardenal F, Camps C, et al. Screening for Epidermal Growth Factor Receptor Mutations in Lung Cancer. N Engl J Med. 2009;361(10):958–67. [DOI] [PubMed] [Google Scholar]
- 31. Riely GJ, Pao W, Pham D, Li AR, Rizvi N, Venkatraman ES, et al. Clinical course of patients with non–small cell lung cancer and epidermal growth factor receptor exon 19 and exon 21 mutations treated with Gefitinib or Erlotinib. Clin Cancer Res. 2006;12(3):839–44. [DOI] [PubMed] [Google Scholar]
- 32. Yang C, Yu C, Shih J, Chang YC, Hu FC, Tsai MC, et al. Specific EGFR mutations predict treatment outcome of stage IIIB/IV patients with chemotherapy‐naive non–small‐cell lung cancer receiving first‐line Gefitinib monotherapy. J Clin Oncol. 2008;26(16):2745–53. [DOI] [PubMed] [Google Scholar]
- 33. Yang L, Miao LY, Chen QF, Li Y, Shi ZX, Ding XS. Monitoring of high‐density lipoprotein cholesterol level is predictive of EGFR mutation and efficacy of EGFR‐TKI in patients with advanced lung adenocarcinoma. Onco Targets Ther. 2016;9:6977–85. [DOI] [PMC free article] [PubMed] [Google Scholar]
- 34. Zhang Y, Xu J, Lou Y, Hu S, Yu K, Li R, et al. Pretreatment direct bilirubin and total cholesterol are significant predictors of overall survival in advanced non‐small‐cell lung cancer patients with EGFR mutations. Int J Cancer. 2017;140(7):1645–52. [DOI] [PubMed] [Google Scholar]
- 35. Eckardstein AV, Hersberger M, Rohrer L. Current understanding of the metabolism and biological actions of HDL. Curr Opin Clin Nutr Metab Care. 2005;8(2):147–52. [DOI] [PubMed] [Google Scholar]
- 36. Lewis GF, Rader DJ. New insights into the regulation of HDL metabolism and reverse cholesterol transport. Circ Res. 2005;96(12):1221–32. [DOI] [PubMed] [Google Scholar]
- 37. Kuliszkiewicz‐Janus M, Małecki R, Mohamed A. Lipid changes occuring in the course of hematological cancers. Cell Mol Biol Lett. 2008;13(3):465–74. [DOI] [PMC free article] [PubMed] [Google Scholar]
- 38. Breslow JL, Eisenberg S, Brinton EA. Metabolic determinants of low HDL‐C levels. Ann N Y Acad Sci. 1993;676(1):157–62. [DOI] [PubMed] [Google Scholar]
- 39. Mooberry LK, Sabnis NA, Panchoo M, Nagarajan B, Lacko AG. Targeting the SR‐B1 receptor as a gateway for cancer therapy and imaging. Front Pharmacol. 2016;7:466. [DOI] [PMC free article] [PubMed] [Google Scholar]
- 40. Kontush A, Lindahl M, Lhomme M, et al. Structure of HDL: particle subclasses and molecular components. In: von Eckardstein A, Kardassis D, editors. High Density Lipoproteins: From Biological Understanding to Clinical Exploitation. Cham: Springer International Publishing; 2015. p. 3–51. [DOI] [PubMed] [Google Scholar]
- 41. Su F, Kozak KR, Imaizumi S, Gao F, Amneus MW, Grijalva V, et al. Apolipoprotein A‐I (apoA‐I) and apoA‐I mimetic peptides inhibit tumor development in a mouse model of ovarian cancer. Proc Natl Acad Sci. 2010;107(46):19997–20002. [DOI] [PMC free article] [PubMed] [Google Scholar]
- 42. Zamanian‐Daryoush M, Lindner D, Tallant TC, Wang Z, Buffa J, Klipfell E, et al. The cardioprotective protein apolipoprotein A1 promotes potent anti‐tumorigenic effects. J Biol Chem. 2013;288(29):21237–52. [DOI] [PMC free article] [PubMed] [Google Scholar]
- 43. Wu J, Zhang C, Zhang G, Wang Y, Zhang Z, Su W, et al. Association between pretreatment serum apolipoprotein A1 and prognosis of solid tumors in Chinese population: a systematic review and meta‐analysis. Cell Physiol Biochem. 2018;51(2):575–88. [DOI] [PubMed] [Google Scholar]
- 44. Cheng T, Dai X, Zhou D, Lv Y, Miao LY. Correlation of apolipoprotein A‐I kinetics with survival and response to first‐line platinum‐based chemotherapy in advanced non‐small cell lung cancer. Med Oncol. 2015;32(1):407. [DOI] [PubMed] [Google Scholar]
- 45. Cavigiolio G, Geier EG, Shao B, Heinecke JW, Oda MN. Exchange of apolipoprotein A‐I between lipid‐associated and lipid‐free states. J Biol Chem. 2010;285(24):18847–57. [DOI] [PMC free article] [PubMed] [Google Scholar]
- 46. Cruz PMR, Mo H, McConathy WJ, Sabnis N, Lacko AG. The role of cholesterol metabolism and cholesterol transport in carcinogenesis: a review of scientific findings, relevant to future cancer therapeutics. Front Pharmacol. 2013;4:119. [DOI] [PMC free article] [PubMed] [Google Scholar]
- 47. Mangaraj M, Nanda R, Panda S. Apolipoprotein A‐I: a molecule of diverse function. Indian J Clin Biochem. 2016;31(3):253–9. [DOI] [PMC free article] [PubMed] [Google Scholar]
- 48. Kobayashi Y, Kashima H, Wu R, Jung JG, Kuan JC, Gu J, et al. Mevalonate pathway antagonist suppresses formation of serous tubal intraepithelial carcinoma and ovarian carcinoma in mouse models. Clin Cancer Res. 2015;21(20):4652–62. [DOI] [PMC free article] [PubMed] [Google Scholar]
- 49. Coussens LM, Zitvogel L, Palucka AK. Neutralizing tumor‐promoting chronic inflammation: a magic bullet? Science. 2013;339(6117):286–91. [DOI] [PMC free article] [PubMed] [Google Scholar]
- 50. Peng M, Zhang Q, Cheng Y, Fu S, Yang H, Guo X, et al. Apolipoprotein A‐I mimetic peptide 4F suppresses tumor‐associated macrophages and pancreatic cancer progression. Oncotarget, 2017;8(59):99693–99706. [DOI] [PMC free article] [PubMed] [Google Scholar]
- 51. Babina IS. Lipid rafts as master regulators of breast cancer cell function. London: IntechOpen; 2011. [Google Scholar]
- 52. Gorin A, Gabitova L, Astsaturov I. Regulation of cholesterol biosynthesis and cancer signaling. Curr Opin Pharmacol. 2012;12(6):710–6. [DOI] [PMC free article] [PubMed] [Google Scholar]
- 53. Freeman MR, Cinar B, Kim J, Mukhopadhyay NK, di Vizio D, Adam RM, et al. Transit of hormonal and EGF receptor‐dependent signals through cholesterol‐rich membranes. Steroids. 2007;72(2):210–7. [DOI] [PMC free article] [PubMed] [Google Scholar]
- 54. Irwin ME, Mueller KL, Bohin N, Ge Y, Boerner JL. Lipid raft localization of EGFR alters the response of cancer cells to the EGFR tyrosine kinase inhibitor gefitinib. J Cell Physiol. 2011;226(9):2316–28. [DOI] [PMC free article] [PubMed] [Google Scholar]