

Abstract
Combining solid phase microextraction (SPME) and mass spectrometry (MS) analysis has become increasingly important to many bioanalytical, environmental, and forensic applications due to its simplicity, rapid analysis, and capability of reducing matrix effects for complex samples. To further promote the adoption of SPME-MS based analysis and expand its application scope calls for efficient and convenient interfaces that couple the SPME sample handling with the efficient analyte ionization for MS. Here we report a novel interface that integrates both the desorption and the ionization steps in one device based on the capillary vibrating sharp-edge spray ionization (cVSSI) method. We demonstrated that the cVSSI is capable of nebulizing liquid samples in a pulled-tip glass capillary with a battery powered function generator. The cVSSI device allows the insertion of a SPME probe into the spray capillary for desorption, and then direct nebulization of the desorption solvent in situ. With the integrated interface, we have demonstrated rapid MS analysis of drug compounds from serum samples. Quantitative determination of various drug compounds including metoprolol, pindolol, acebutolol, oxprenolol, capecitabine and irinotecan was achieved with good linearity (R2 = 0.97–0.99) and limit of detection ranging from 0.25 to 0.59 ng/mL without using a high voltage source. Only 3.5 μL of desorption solvent and 3 min desorption time were needed for the present method. Overall, we demonstrated a portable SPME-MS interface featuring high sensitivity, short analysis time, small footprint, and low cost, which makes it an attractive method for many applications requiring sample cleanup including drug compound monitoring, environmental sample analysis, and forensic sample analysis.
Graphical Abstract

A simple interface coupling SPME and MS for rapid detection of analytes from complex matrices
Introduction
Rapid and direct chemical analysis[1] using mass spectrometry (MS) is of great importance to many applications including environmental sample monitoring,[2–4] point-of-care medical testing,[5–7] forensic analysis,[8–10] and chemical/biological warfare agent detection.[11–13] With the rapid development of various ambient ionization techniques such as desorption electrospray ionization (DESI)[14], direct analysis in real-time (DART),[15] paper spray,[16, 17] and matrix-assisted inlet ionization (MAI),[18] we have seen an increasing number of applications of MS for rapid and direct analysis. While direct sample analysis is convenient, fast, and simple, the results of analysis are often greatly affected by the types of matrix used [19, 20] and analytes targeted. Therefore, to achieve relevant analytical performance, target analytes from complex matrices require sample pretreatment procedures, such as liquid-liquid extraction,[21] solid-phase extraction, and Soxhlet extraction [22]. To fully unleash the potential of various ambient and direct ionization methods and point of care MS testing, calls for sample preparation strategies that can effectively clean up and enrich target analytes while maintaining a simple, rapid, and portable workflow. Conventional extraction sample preparation methods [24] require lengthy experimental procedures and/or dedicated instruments, despite their excellent sample preparation capability. In recent years, microscale extraction-based sample cleanup methods that can be directly coupled with ambient mass spectrometry analysis [25, 26] has become increasingly important for rapid and portable chemical analysis. Among these methods, solid phase microextraction (SPME), first established by Pawliszyn et al.,[27] has gained traction within the scientific community owing to its simplicity, low sample/solvent consumption, and compatibility to other sample processing techniques. [28–31] In recent years, the development of biocompatible SPME probe that allows direct extraction of target analytes from complex biological matrices, has become an increasingly important tool for many bioanalytical applications. [32,33]
To date, many strategies have been reported to directly couple SPME to MS analysis, [34–38] which can be divided into two major categories based on their desorption mechanisms. Thermal desorption is an effective desorption technique, especially for volatile analytes. For heat-sensitive or non-volatile targets, solvent-based desorption is a preferred strategy. SMPE fibers are immersed into sample matrices to achieve the distribution partition balance between the coated surface and the sample. Target analytes are then extracted from the fiber using solvent and subsequently ionized for MS detection.[39–43] For solvent-based desorption, electrospray ionization (ESI) is the primary ionization method. Early works that couple SPME with ESI are based on Chen and Pawliszyn’s method using a customized desorption chamber and a six-port injection valve.[29] To further simplify the SPME-MS workflow and improve its performance, several new interfaces have been reported recently. NanoESI based SPME interfaces have been reported to improve the sensitivity of SPME analysis by using smaller volumes of the desorption solvent. [44–46] However, issues include clogging, air bubble generation, and inconsistent spray could complicate the SPME experiments. To achieve more reliable and robust interfaces, the open port SPME interface has been reported, which is comprised of a stainless-steel tube for desorption reagent delivery and SPME desorption, and a suction capillary with nebulization gas for atmospheric pressure chemical ionization (APCI).[47] Recently, a microfluidic open port interface was reported by the Pawliszyn group that further reduced the desorption volume for improved sensitivity and better integration.[48] The open port-based interface provides a more robust workflow and has better compatibility with automatic sample analysis. The major limitation of these interfaces is the need of an extra pump, which could be cumbersome for point of care and portable analyses. It is also possible to use SPME devices directly as ESI emitters. Based on the concept of substrate ESI, coated paper, wooden tips, and blades have been reported to serve both as the sample extraction and desorption probe and the ESI emitter, rendering them highly flexible and amenable to simple workflows and rapid analysis. [49–51]
Despite the rapid advancement of SPME-MS interfaces, existing methods rely on electrospray or nebulization gas to produce liquid droplets from desorption solutions, which limits the flexibility of the desorption design and increases the demand of peripheral equipment. Ultrasonics has been reported as an effective way to generate liquid droplets in the air for MS analysis, but a direct coupling interface based on this mechanism has not been achieved. [52,53] Here we report a high voltage-free and portable SPME desorption and ionization interface based on a simple mechanical based nebulization method, capillary vibrating sharp-edge spray ionization (cVSSI) [54,55] (Figure 1). In the present setup, the desorption solution of SPME in a pulled-tip capillary is nebulized and ionized by vibrating the capillary at ~95 kHz. This setup enables a simple and convenient SPME-MS workflow similar to that with a nanoESI based interface. The whole SPME desorption and ionization system is readily portable and can be operated with a battery-powered function generator. In addition, the system described here is less prone to bubble induced injection failure and has better reusability because of the robustness of cVSSI induced nebulization, which allows the use of a wide size range of emitter tips. Overall, we present a novel direct SPME-MS interface for solvent extraction-based analysis. The voltage-free, simple analysis workflow, robustness, portability, and low cost of this method make it an attractive interface to couple SPME based sample preparation with MS for applications that require fast qualitative and quantitative analysis for complex compounds.
Figure 1.

Pictures of the portable cVSSI device. a) The overall assembly of the cVSSI device. The picture shows all the equipment that is needed for a cVSSI experiment, which includes a portable function generator, a battery, and cVSSI device. b) A close-up picture of the cVSSI device that is comprised of a piezoelectric transducer, a cover glass, and a pulled-tip capillary. c) A close-up picture of cVSSI device near the mass spectrometer. d) Plume generation by the cVSSI device. e). The image of glass capillary with the tip ID of 50 μm, scale bar = 100 μm.
Experimental Section
Materials and reagents
All solvents used in this work are LC/MS grade. Water and methanol were purchased from Fisher Scientific (NJ, USA). Dulbecco’s phosphate buffered saline 1X was purchased from VWR life science. Adult bovine serum was purchased from MP biomedicals. Metoprolol, pindolol, acebutolol, and oxprenolol were provided by Dr. Lisa Holland in the Department of Chemistry at West Virginia University. Capecitabine and irinotecan (CPT11) were purchased from Tokyo Chemical Industry (Tokyo, Japan). Carbamazepine, selected as an internal standard for quantification, was purchased from Alfa Aesar (Haverhill, MA). Biocompatible SPME probes (C18, 45 μm thickness, 15 mm length of coating, Supelco) were purchased from Sigma-Aldrich (St.Louis,MO).
cVSSI Fabrication and Operation
Pulled-tip capillaries were fabricated by pulling 0.75 mm OD glass capillaries with a laser-based micropipette puller, Sutter P-2000 (CA, U.S.A.) under the program of Heat 700, Fil 4, Vel 60, Del 200, and Pul 175. After pulling, capillaries were etched by 30% hydrofluoric acid to the desired tip I.D. For drug analysis experiments, a 50 μm tip I.D was used. Finally, the cVSSI device was assembled by attaching the pulled-tip capillary (~4.2 cm long) to a VSSI device using glass glue. The fabrication of VSSI devices has been described in our previous studies. Briefly, a piezoelectric diaphragm (Murata) is bonded to one end of a No. 1 microscope cover glass (VWR) using epoxy-based super glue (Devcon).[54] The cVSSI device was activated by a portable function generator at an optimal working frequency (94–98 kHZ) and amplitude (7–20 Vpp). The frequency is selected to achieve highest energy efficiency of the device by sweeping the input frequency from 4 kHz to 1 MHz with an interval of 1 kHz. The cVSSI device was backfilled with desorption solvent using a 150 μm OD fused silica capillary (Polymicro Technologies). Regarding the reproducibility of the 50 μm capillaries, the coefficient of variation (relative standard deviation) for 10 μM metoprolol was determined to be 1.1% (n=10). The device position and angle have a major impact on the ion intensity as it affects the efficiency of transferring small droplets to the ion transfer tube. For the present method, no high voltage field exists between the capillary and mass spectrometer inlet. Therefore, droplets generated by the present method rely solely on the vibration induced pumping process, which requires an optimal setup. The distance and angle of the cVSSI device to the mass spectrometer inlet were optimized by comparing the ion intensity of 2.37 μg/mL Carbamazepine in water, respectively (Figure S1 and S2). The optimal distance was determined to be 5 mm away from the mass spectrometer inlet, and the optimal angle between the capillary and the inlet was 30 degree. The cVSSI device was placed on a stage with marks to ensure the exact position for each test (Figure S3). The flow rate reported is an average flow rate. We recorded the time of spray under different working conditions with a known total volume. The flow rate of the spray was calculated by dividing the solvent volume with the spray time.
After each spray, the capillary was cleaned with 120 μL methanol/water (V/V=1:1) by turning the transducer on for fluid pumping. With this protocol, no carry-over effect was observed. The cVSSI device was re-used after each analysis. For a single device, it can be reused for >50 times. The cost of each cVSSI device including glass slide, capillary and transducer is ~$1.
Mass spectrometry Analysis and Sample Preparation
A high-performance Q-Exactive Hybrid Quadruple Orbitrap (Thermo Fisher, San Jose, CA, U.S.A.) mass spectrometer was used for all MS analyses. The S lens voltage was set to 50 V with a mass resolution of 70000. The mass spectrometer inlet capillary temperature was set at 375°C, which improves the solvent desolvation of droplets and ion intensity. For 10 μM metoprolol samples, we did not observe in-source fragmentation by comparing mass spectra obtained at 50°C and 375°C (Figure S4). The mass scan rate was 1 s/scan, and the injection time was 100 ms. For a 50 μm capillary, 3–5 scans were typically collected. No significant difference in signal response and S/N were observed between 3 s spectra and 30 s spectra (Figure S5). The S/N in mass spectra was calculated based on the following equation: S/N= Ipeak/ σSTD, where Ipeak is the peak intensity of the analyte and σSTD is the standard deviation of the noise. For each spectrum, the noise region was selected a few m/z before or after the analyte peak, and the noise region does not include any detectable ion peak. [56,57]
All of the drug compounds (β-blockers, capecitabine and CPT11) were first dissolved in methanol to prepare 2.67 mg/mL stock solutions. The stock solutions were then stored at −20 °C. For MS analysis, the stock solutions were diluted to the desired concentration in different matrices including methanol, PBS, and bovine serum. To characterize the ionization performance of cVSSI, 0.267, 6.68, 13.35, 20.03, 26.7 ng/mL of Metoprolol solutions in methanol were prepared from the stock solution, and sprayed with the cVSSI device, respectively. For SPME optimization experiments, 2.67 μg/mL metoprolol in PBS was prepared and subsequently extracted and analyzed with MS. For serum sample analysis, the stock solutions of drug compounds were diluted in bovine serum to prepare 0.267 to 26.7 ng/mL sample solutions. To prepare desired concentrations, 1 μL drug containing PBS solution was added to 1 mL bovine serum sample. After spiking, the serum samples were vortex mixed for 30 seconds, and allowed to settle for 20 min before extraction.
Procedures for SPME-MS analysis
All of the commercial SPME probes were preconditioned before each analysis by inserting the probe into a methanol/water (V/V, 9:1) solution for 15 min followed by immersing into a different methanol/water (V/V, 1:9) solution for 15 min. Once the probe was conditioned, analyte extraction was achieved by inserting the SPME probe into 200–600 μL of sample solution in a 1000 μl pipette tip (VWR) sealed by epoxy glue for 5–30 min. The extraction step was performed on an Orbi-Blotter (Benchmark Scientific Inc, New Jersey) to promote the mixing of the target analyte (70 rpm). Following the extraction step, the SPME probe was inserted into the cVSSI capillary with 3.5–6 μL of desorption solvent (methanol/water V/V=9:1). After 1–3 min, the desorption solution was directly sprayed with the cVSSI for MS analysis. For each sample, a different SPME probe was used in one test. After the whole test, the SPME probes were cleaned by leaving SPME fiber in methanol/water (V/V=1:1) for 20 min, and then in acetonitrile solution for another 15 min to let all remaining redissolved in the solution. For each SPME probe, at least 20 samples were tested. The absolute recovery for the SPME experiment was calculated based on: Recovery = (Relative Intensity * R * 1 μM * volume of desorption) / (original concentration * volume of extraction) * 100%, where R is the concentration conversion coefficient. R was determined by establishing a calibration curve using a known concentration of the internal standard and a series of concentrations of metoprolol solutions in the desorption solvent, where R is the inverse of the slope of the calibration curve.
For the nanoESI interface, a 5 cm long Pt wire (Diameter: 20 μm) was inserted into the capillary (Tip diameter: 15 μm) as an electrode, and the end of the Pt electrode was ∼3 cm away from the tip of the capillary. The SPME probe was inserted into the pulled capillary with 3.5 μL of desorption solvent by 3 min for direct nanoESI analysis. The Pt wire was reused by cleaning with 1 mL methanol/water (V/V=1:1) in an ultrasonic cleaner after each run.
Results and discussion
Design principles and cVSSI characterization
Prior to the MS detection, a complete SPME-MS workflow includes analyte extraction, desorption, and ionization. Here, we designed a cVSSI based interface that integrates both the desorption and ionization steps in one device. The cVSSI has been demonstrated previously to be an effective voltage-free ionization source, which generates liquid plumes from a capillary attached on a vibrating glass slide. [55,58] In this work, we replaced the 360 μm OD fused silica capillary (ID: 0.1 mm) in our previous work with a pulled-tip borosilicate glass capillary with 0.75 mm OD (ID: 0.4 mm) at the back end. The glass capillary allows direct insertion of the commercial SPME probe into the capillary which serves as the desorption chamber for SPME. As shown in Figure 2, a simple two-step SPME workflow can be achieved: 1) Inserting a SPME probe to a sample tube for analyte extraction; and 2) Inserting the SPME probe to a cVSSI device for desorption and ionization.
Figure 2.

The complete workflow for cVSSI-SPME-MS analysis of chemicals from complex matrices. It includes 3 major steps: 1. Extraction, 2. Solvent desorption; 3. Ionization with the cVSSI.
We first studied the plume generation of cVSSI with the pulled-tip capillary. Compared to our previous cVSSI devices, using a pulled tip capillary with a 0.75 mm OD base significantly enhances the energy efficiency of plume generation. This is because the 360 μm OD capillary is more flexible than the 0.75 mm OD, which reduces the vibration efficiency at the tip due to the damping effect. As a result, the whole device can be driven by a portable, battery-powered function generator. Our results show that the power consumption of the cVSSI device with a 15 μm tip is as low as 80 mW. The minimum spray flow rate achieved under this operational mode is ~0.5 μl/min (Table S1). The small tip ID and low flow rate are desired for applications requiring long spray time for collecting more MS spectra. However, small tips are fragile and prone to channel clogging. Since the cVSSI method is compatible with a wide range of tip sizes, we also examined ~50 μm ID tips for this work. We determined that the droplet size from pulled capillaries with a tip size of 50 μm and 15 μm is similar (Figure S6). The average droplet diameter is 5.7 +/−0.5 μm for the 50 μm capillary and 5.4 +/− 0.7 μm for the 15 μm capillary. In addition, the ion intensity and S/N of 10 μM metoprolol using both capillaries are also similar (Figure S6). Given the similar level of MS performance, the larger tip was preferred in the present study as it can significantly reduce the likelihood of device clogging and tip damage and increases the tolerance of the device to air bubbles. Owing to the high efficiency of the cVSSI method, droplet spray can still be generated for the 50-μm tip with a portable power source. A larger tip device requires higher power input (100 – 300 mW) but can still be operated by a battery powered function generator without the need of a power amplifier.
We studied the effect of input frequency and voltage on spray generation and the stability of the cVSSI device. Figure 3a shows the relationship between input frequency and spray flow rate using an input voltage of 13 Vpp. Spray can be generated between 94–98 kHz with an optimal frequency of ~95.4 kHz. Figure 3c shows the dependence of spray flow rate on input voltage. As the voltage increases, the spray flow rate increases as well. The highest flow rate tested here is 20 Vpp, because 20 Vpp is the maximum output voltage of the portable function generator. We also tested the stability of the cVSSI device on separate days. Figure 3b and d show the correlation between the flow rate and frequency and flow rate and amplitude measured at three different days, respectively. The error bars represent the standard deviation of spray flow rate using varied input power and frequency for these measurements. The small relative standard deviation (6.5%+/−4.5%) from different days indicates the robustness and reproducibility of the portable ionization method.
Figure 3.

Optimization of cVSSI operation parameters. a) The frequency dependence of cVSSI spray flow rates tested on the same day. b) The frequency dependence of cVSSI spray flow rates tested on three different days for the same device. c) The amplitude dependence of cVSSI spray flow rates tested on the same day. d)The amplitude dependence of cVSSI spray flow rates tested on three different days.
We evaluated the ionization performance of cVSSI by directly spraying different concentrations of a β-blocker drug compound, metoprolol. We prepared 0.267, 6.68, 13.35, 20.03, 26.7 ng/mL of metoprolol in methanol/water (v/v, 9:1) with 11.85 ng/mL of carbamazepine as the internal standard. 6 μL of solution was first filled in the capillary and sprayed with the portable cVSSI device which was placed in front of the mass spectrometer inlet. As shown in Figure 4, good linearity can be obtained with the cVSSI device for direct spraying metoprolol from methanol/water solutions with different concentrations (R2=0.9999). The limit of detection (LOD) for direct spray of metoprolol was determined to be 0.267 ng/mL by comparing the lowest concentration in the calibration curve with a threshold value. The threshold value was determined using the average of intensity of blank solutions plus 3 times the standard deviation (n=10).
Figure 4.

Quantitative performance of direct cVSSI for metoprolol. a)-c) Mass spectra of metoprolol and the internal standard carbamazepine at 0.267 ng/mL, 6.68 ng/mL, and 20.03 ng/mL, respectively. Carbamazepine concentration is fixed at 11.85 ng/mL. d) The calibration of curve of direct spray of metoprolol solutions from 0.267 ng/mL to 26.7 ng/mL with cVSSI. M1: internal standard (carbamazepine); M2: metoprolol.
Optimization of operational parameters
After demonstrating the performance of the cVSSI device, we optimized the extraction time, sample volume, desorption time, and desorption volume of the SPME protocol using cVSSI. These parameters are important to SPME experiments and straightforward to test. Therefore, before evaluating the analytical performance of the cVSSI based SPME interface, we first sought to obtain optimal operational parameters for SPME extraction and desorption. We studied the extraction of 2.67 μg/mL metoprolol, from a PBS solution using a C18 SPME probe. 1.18 μg/mL of carbamazepine was added to the desorption solvent and used as the internal standard for MS quantification. Both the signal response (relative intensity to the internal standard) and the signal to noise ratio (S/N) were used to evaluate the analysis performance.
To optimize the sample volume, extraction time was set at 24 min with 6 μL desorption volume and 3 min desorption time. Sample volumes from 200 μL to 600 μL were tested and the results are shown in Figure 5a. Higher sample volumes generally lead to better signal response for MS detection. For sample volumes above 400 μL, signal responses do not show significant increase. The equilibrium conditions between the sample matrix and SPME fiber surface can be described as: [59]
where n is the mass of analyte extracted by the SPME fiber coating, Kfs is a fiber coating–sample matrix distribution constant, Vf is the fiber coating volume, Vs is the sample volume, and C0 is the initial concentration of a given analyte in the sample. When the sample volume (Vs) increases, the amount of analyte extracted also increases until the volume of the sample becomes significantly larger than the product of the distribution constant and volume of the coating. When the sample volume is very large, KfsVf << Vs, the equation can be simplified to: n = K fs Vf C0, where the extraction is independent of sample volume. For 10 μM sample with the present extraction setup, the extracted amount of analytes could become independent of sample volume after 400 μL. Based on these results, the sample volume for this study was chosen to be 500 μL, which gives the highest MS response. We did not test sample volume <200 μL, because these small sample volumes cannot fully cover the SPME probe in the 1000 μL pipette tip used in this study. For applications that have extremely limited sample volumes, a smaller container would be needed. It should be noted that the present extraction setup employed a customized pipette tip as the sample container to ensure full coverage of the SPME probe for the sample volumes tested. The epoxy glue used for sealing the tip may contaminate the sample. We compared the mass spectra of metoprolol after SPME extraction with a pipette tip and a 500 μL vial, respectively. The resulted mass spectra did not indicate the leaching glue contaminate to the samples (Figure S7).
Figure 5.
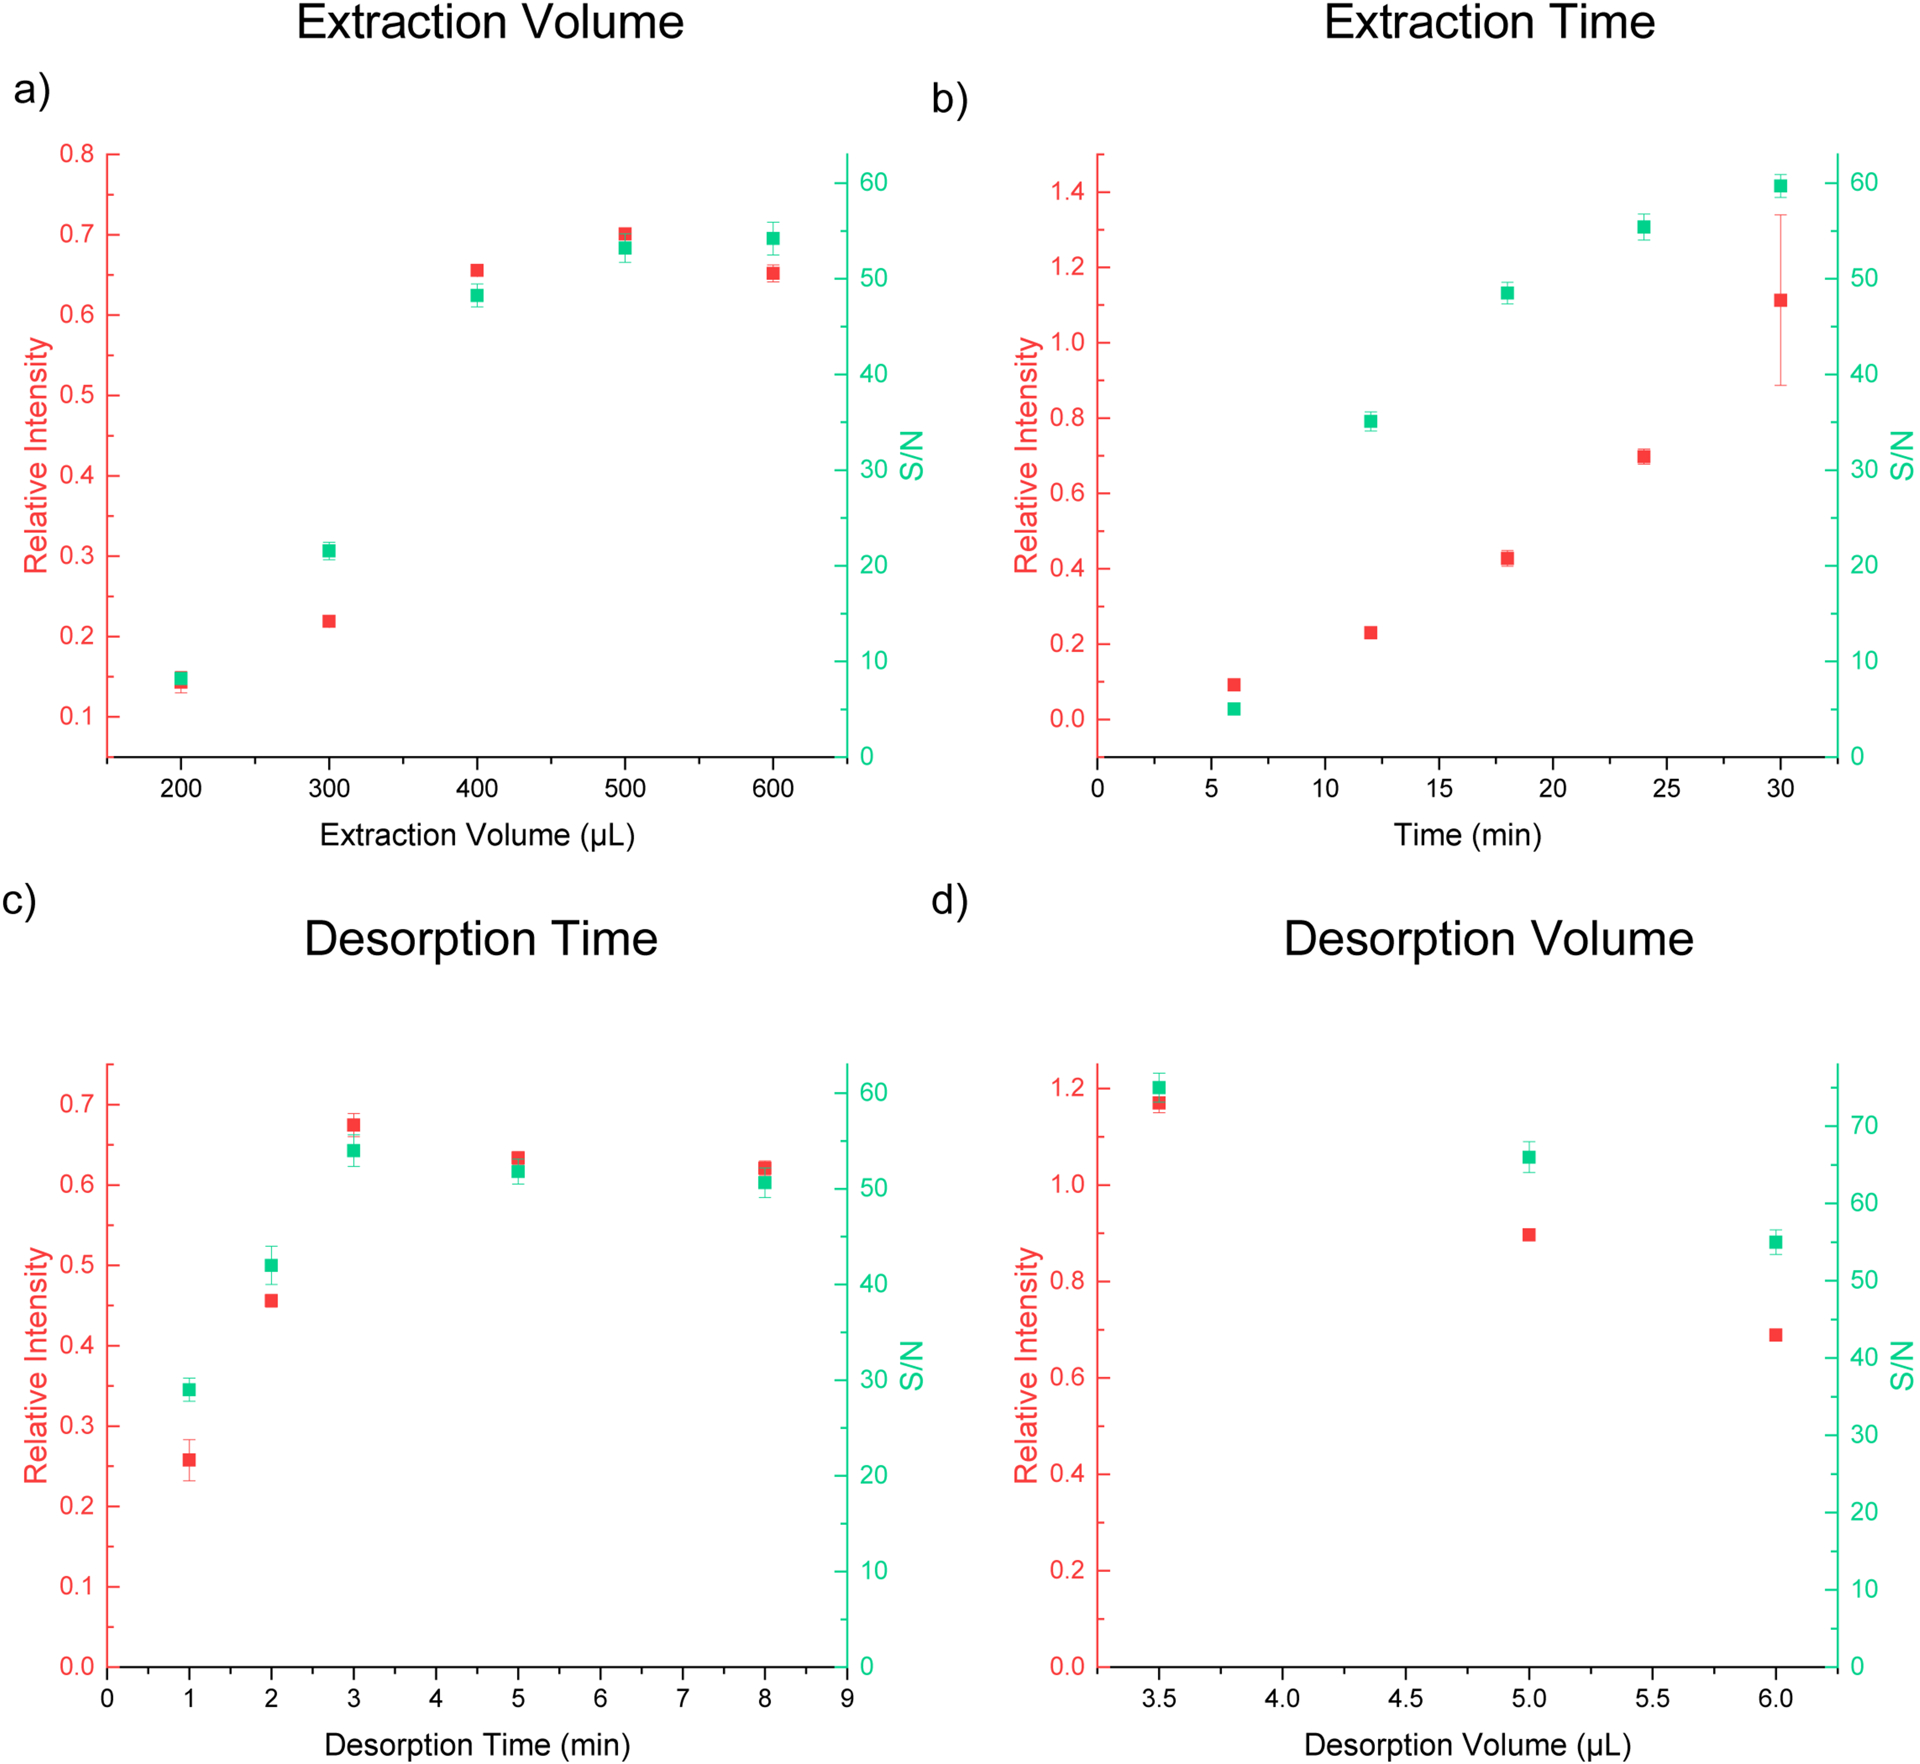
Optimization of SPME working conditions. a) The relationship of the signal response, S/N and the extracted volume used in the SPME, with 24 min extraction time, 3 min desorption time, and 6 μL desorption volume. b) The relationship of the signal response, S/N and extraction time with 500 μL extraction volume, 3 min desorption time, and 6 μL desorption volume. c) The relationship of the signal response, S/N and the desorption time with 500 μL extraction volume, 24 min extraction time, and 6 μL desorption volume. d) The relationship of the signal response, S/N and the desorption volume with 500 μL extraction volume, 30 min extraction time, and 3 min desorption time. The signal response is the ratio of the ion intensity of the analyte peak to the intensity of the internal standard.
Extraction time was optimized by maintaining the sample volume at 500 μL with 6 μL desorption volume and 3 min desorption time. As shown in Figure 5b, the MS response increases as the extraction time increases from 5 min to 30 min. While longer extraction time (>30 min) could further improve detection signals, 30 min is used in this study as we aim to develop a rapid and portable workflow for SPME-MS. A 30-min extraction time is still not ideal for applications that need faster response or high throughput, but the low cost ($5–10) and simplicity features of cVSSI devices could mitigate this problem by employing multiple ionization sources. To improve the overall analysis throughput, multiple samples can be extracted simultaneously with multiple SPME probes. [60–62] For the desorption and ionization process, it is feasible to use a number of cVSSI devices for each SPME probe because of the low cost, which allows continuous ionization of each sample without stopping for cleaning or inserting SPME probes.
Next, we studied the optimal desorption time for our system. The desorption volume was fixed at 6 μL for this study as it is the maximum volume that the capillary used here can hold. 6uL desorption solvent is sufficient to cover all of the effective surface area of SPME probes. As shown in Figure 5c, the MS signal responses increase as the desorption time increases from 1–3 min, and reaches a plateau after 3 min. Because of the small desorption volume, the time required to reach solvent saturation is expected to be short. It should be noted that for lower sample concentration, optimum desorption time may be longer as the time to reach solvent saturation is delayed. When we tested 26.7 ng/mL sample solutions, signal response still increased at 8 min (Figure S8). The short desorption time in the cVSSI device allows faster reuse of the cVSSI device so that a small number of cVSSI devices can accommodate a large number of SPME probes. The present desorption times are comparable to the ones achieved by LC-MS methods based on online-SPE. Lastly, we optimized the desorption volume in this workflow. The volume range studied here is from 3.5 to 6 μL. As mentioned above, the upper limit of the volume value is determined as the maximum desorption volume allowed in the cVSSI device is 6 μL, which is not expected to be the exhaustive extraction volume. For the lower limit, 3.5 μL is the minimum volume that can cover all the surface area of SPME probes. The results show (Figure 5d) that the MS signal responses decrease as the desorption volume increases due to the dilution effect of larger desorption volume. Therefore, the optimal desorption volume is determined to be 3.5 μL. The recovery of 0.267 ng/mL metoprolol sample was determined to be 50+/−2% by the comparing the original amount of the sample with the detected amount after desorption. The detected amount was estimated using 0.474 μg/mL carbamazepine as the internal standard. The absolute recovery rate will decrease as the increase of sample concentration for the current extraction and desorption conditions. For example, the recovery rate decreased to 21%+/−2% for 26.7 ng/mL samples. It should be noted that the recovery rate is not limited by the SPME probe. It is dependent on extraction and desorption conditions, which can be further increased with long extraction time and higher desorption volume.
Quantitative determination of drug compounds in serum samples
From experiments described above, we determined that the optimal parameters for our system are 30 min extraction time, 500 μL of extraction volume, 3 min of desorption time and 3.5 μL of desorption volume. With the optimal parameters, we evaluated the performance of our cVSSI-SPME-MS workflow in detecting drug compounds from adult bovine serum samples. We tested a series of drug compounds including metoprolol, pindolol, acebutolol, oxprenolol, capecitabine and irinotecan with spiked concentrations from 0.267–26.7 ng/mL where 4.74 or 11.85 ng/mL carbamazepine was used as the internal standard for the quantification of the drugs. Therapeutic concentrations of all drug analytes could be as low as 14 ng/mL. [63] Therefore, we examined whether the optimized cVSSI-SPME protocol is sufficient for detecting metoprolol in this concentration range. Figure 6a shows a linear dependence of the MS signal on the metoprolol concentration in serum from 0.267 to 26.7 ng/mL with R2= 0.9968. Figure 6b further confirms the quantification performance of the cVSSI-SPME in the sub-5.36 ng/mL concentration range with R2= 0.9946. The full linear range for metoprolol was from 0.267 ng/mL to 2.67μg/mL (Figure S9). The LOD for metoprolol is determined to be 0.267 ng/mL by comparing the signal of the 0.267 ng/mL sample with the signal of the blank sample requiring 3 times the standard deviation from 7 blank measurements. For spiked samples, the recovery rate was determined to be within the range of 80–90% (Table S2). These results demonstrated that the portable cVSSI-SPME workflow provides sufficient sensitivity for clinically relevant detection of metoprolol without the use of a high voltage power supply. As a comparison, we performed the same analysis using the nanoESI interface. The size of the nanoESI emitter was 10 μm to ensure optimal ionization performance. The nanoESI method achieved the same LOD (0.267 ng/mL) as the cVSSI method (Figure S10). We further tested the other 5 drug compounds, which all show good linearity between 0.25 to 59 ng/mL (R2=0.97–0.99) and a LOD in the range from 0.2 to 0.6 ng/mL. (Fig. 6c, Fig.S11 a–d). The details of the calibration curves are listed in Table S3. We also tested the simultaneous detection of two β-blockers (metoprolol and pindolol) with the present method, and the results also indicate good quantification performance for multi-compound detection, which is a major advantage of using MS as the detection method (Fig.6d). All the LODs for these drugs compounds are below the typical plasma concentration in patients, which demonstrate the potential utility of the current system for monitoring pharmacokinetics (Table S4). [63–68] Collectively, the cVSSI-SPME method was demonstrated to be an effective tool for rapid analysis of drug compounds from serum samples using MS. Compared with existing methods, the device is portable and does not require a high voltage source. In addition, the workflow is simple and easy to carry out. Combined with the low-cost nature of the cVSSI device, the throughput for analyzing multiple samples can reach ~1 sample/min by performing parallel desorption with multiple cVSSI devices and ionizing the samples consecutively with one mass spectrometer.
Figure 6.

Quantitative determination of concentrations of β-blockers in serum samples. a) The extracted linear curve of metoprolol in serum from 0.267 ng/mL to 26.7 ng/mL and b) 0.534 ng/mL to 5.34 ng/mL. c) The extracted linear curve of pindolol in serum in the range from 0.249 ng/mL to 24.9 ng/mL. and d) The extracted linear curve of a mixture containing metoprolol and pindolol in serum from 0.249 to 26.7 ng/mL.
Conclusion
In this work, we report a new interface that couples SPME to MS detection with minimum footprint and external equipment requirements. The workflow of this method is similar to existing nanoESI based interfaces. Therefore, it shares similar advantages of simplicity, low desorption volume, and short analysis time. Using cVSSI as the nebulization method enables a wider range of spray flow rates (0.5 μL/min-60 μL/min). Being able to run at higher flow rates makes this method more robust, and less prone to air bubbles in the capillary, which is the major weakness of the nanoESI based interface. Running at high flow rates also enables fast and efficient washing between samples thereby allowing the reuse of capillaries and improving the overall sample analysis throughput. For applications benefit from longer observation window, smaller tip size can be employed to extend the spray time. In addition, cVSSI offers the voltage-free ionization option as demonstrated in this work, which further reduces the demand on peripheral equipment and the complexity of the instrument.
Because of the high efficiency of the cVSSI device reported here, the new interface is run by a low-cost function generator (<$200 USD) with battery power. Additionally, the voltage-free ionization capability of cVSSI, the present interface, is readily portable for SPME-based MS analysis, which could be useful in a number of applications benefiting from onsite detection or point of care testing. Future development of SPME-cVSSI-MS will evaluate and optimize the method with a portable mass spectrometer.
Supplementary Material
Acknowledgement
This work is supported by National Institutes of Health (R01GM135432) and West Virginia University Deans’ Instrumentation Seed Program for Innovative Research (InSPIRe). We acknowledge use of the WVU Shared Research Facilities for mass spectrometry analysis. We thank Dr. Callee Walsh and Sandra Majuta in the WVU-BNRF research facility for assisting in mass spectrometry experiments. We thank Dr. Stephen J. Valentine’s input on this manuscript, and Dr. Lisa Holland for providing β-blocker compounds.
Footnotes
Conflict of Interest
P.L. has co-founded a start-up company, Invibragen Inc., to commercialize technologies involving vibrating sharp-edge spray ionization (VSSI).
Associated Content
Supporting information included results of flow rate study of 15 μm pulled-tip capillary, the recovery test for spiked metoprolol samples at different concentrations, cVSSI optimization and validation experiments, and droplet size study.
References
- 1.Pu F, Chiang S, Zhang W, Ouyang Z: Direct sampling mass spectrometry for clinical analysis. The Analyst. 144, 1034–1051 (2019) [DOI] [PMC free article] [PubMed] [Google Scholar]
- 2.de Urzedo APFM, Diniz MER, Nascentes CC, Catharino RR, Eberlin MN, Augusti R: Photolytic degradation of the insecticide thiamethoxam in aqueous medium monitored by direct infusion electrospray ionization mass spectrometry. 42, 1319–1325 (2007) [DOI] [PubMed] [Google Scholar]
- 3.Hernández F, Sancho JV, Pozo O, Lara A, Pitarch E: Rapid direct determination of pesticides and metabolites in environmental water samples at sub-μg/l level by on-line solid-phase extraction-liquid chromatography–electrospray tandem mass spectrometry. Journal of Chromatography A. 939, 1–11 (2001) [DOI] [PubMed] [Google Scholar]
- 4.Suzuki T, Yaguchi K, Suzuki S, Suga T: Monitoring of Phthalic Acid Monoesters in River Water by Solid-Phase Extraction and GC-MS Determination. Environmental Science & Technology. 35, 3757–3763 (2001) [DOI] [PubMed] [Google Scholar]
- 5.Ferreira CR, Yannell KE, Jarmusch AK, Pirro V, Ouyang Z, Cooks RG: Ambient Ionization Mass Spectrometry for Point-of-Care Diagnostics and Other Clinical Measurements. Clinical Chemistry. 62, 99 (2016) [DOI] [PMC free article] [PubMed] [Google Scholar]
- 6.Campbell IS, Ton AT, Mulligan CC: Direct Detection of Pharmaceuticals and Personal Care Products from Aqueous Samples with Thermally-Assisted Desorption Electrospray Ionization Mass Spectrometry. Journal of the American Society for Mass Spectrometry. 22, (2011) [DOI] [PubMed] [Google Scholar]
- 7.Espy RD, Manicke NE, Ouyang Z, Cooks RG: Rapid analysis of whole blood by paper spray mass spectrometry for point-of-care therapeutic drug monitoring. Analyst. 137, 2344–2349 (2012) [DOI] [PubMed] [Google Scholar]
- 8.Ifa DR, Gumaelius LM, Eberlin LS, Manicke NE, Cooks RG: Forensic analysis of inks by imaging desorption electrospray ionization (DESI) mass spectrometry. Analyst. 132, 461–467 (2007) [DOI] [PubMed] [Google Scholar]
- 9.Ifa DR, Jackson AU, Paglia G, Cooks RG: Forensic applications of ambient ionization mass spectrometry. Analytical and Bioanalytical Chemistry. 394, 1995–2008 (2009) [DOI] [PubMed] [Google Scholar]
- 10.Rodriguez-Cruz SE: Rapid analysis of controlled substances using desorption electrospray ionization mass spectrometry. 20, 53–60 (2006) [DOI] [PubMed] [Google Scholar]
- 11.D’Agostino PA, Hancock JR, Chenier CL, Lepage CRJ: Liquid chromatography electrospray tandem mass spectrometric and desorption electrospray ionization tandem mass spectrometric analysis of chemical warfare agents in office media typically collected during a forensic investigation. Journal of Chromatography A. 1110, 86–94 (2006) [DOI] [PubMed] [Google Scholar]
- 12.Griest WH, Wise MB, Hart KJ, Lammert SA, Thompson CV, Vass AA: Biological agent detection and identification by the Block II Chemical Biological Mass Spectrometer*. 5, 177–184 (2001) [Google Scholar]
- 13.Steiner WE, Klopsch SJ, English WA, Clowers BH, Hill HH: Detection of a Chemical Warfare Agent Simulant in Various Aerosol Matrixes by Ion Mobility Time-of-Flight Mass Spectrometry. Analytical Chemistry. 77, 4792–4799 (2005) [DOI] [PubMed] [Google Scholar]
- 14.Takáts Z, Wiseman JM, Cooks RG: Ambient mass spectrometry using desorption electrospray ionization (DESI): instrumentation, mechanisms and applications in forensics, chemistry, and biology. 40, 1261–1275 (2005) [DOI] [PubMed] [Google Scholar]
- 15.Hajslova J, Cajka T, Vaclavik L: Challenging applications offered by direct analysis in real time (DART) in food-quality and safety analysis. TrAC Trends in Analytical Chemistry. 30, 204–218 (2011) [Google Scholar]
- 16.Liu J, Wang H, Manicke NE, Lin J-M, Cooks RG, Ouyang Z: Development, Characterization, and Application of Paper Spray Ionization. Analytical Chemistry. 82, 2463–2471 (2010) [DOI] [PubMed] [Google Scholar]
- 17.Manicke NE, Abu-Rabie P, Spooner N, Ouyang Z, Cooks RG: Quantitative Analysis of Therapeutic Drugs in Dried Blood Spot Samples by Paper Spray Mass Spectrometry: An Avenue to Therapeutic Drug Monitoring. Journal of the American Society for Mass Spectrometry. 22, 1501–1507 (2011) [DOI] [PubMed] [Google Scholar]
- 18.Lietz CB, Richards AL, Ren Y, Trimpin S: Inlet ionization: protein analyses from the solid state without the use of a voltage or a laser producing up to 67 charges on the 66 kDa BSA protein. 25, 3453–3456 (2011) [DOI] [PubMed] [Google Scholar]
- 19.Dams R, Huestis MA, Lambert WE, Murphy CM: Matrix effect in bio-analysis of illicit drugs with LC-MS/MS: Influence of ionization type, sample preparation, and biofluid. Journal of the American Society for Mass Spectrometry. 14, 1290–1294 (2003) [DOI] [PubMed] [Google Scholar]
- 20.Hsieh Y, Chintala M, Mei H, Agans J, Brisson J-M, Ng K, Korfmacher WA: Quantitative screening and matrix effect studies of drug discovery compounds in monkey plasma using fast-gradient liquid chromatography/tandem mass spectrometry. 15, 2481–2487 (2001) [DOI] [PubMed] [Google Scholar]
- 21.Clarke MW, Tuckey RC, Gorman S, Holt B, Hart PH: Optimized 25-hydroxyvitamin D analysis using liquid–liquid extraction with 2D separation with LC/MS/MS detection, provides superior precision compared to conventional assays. Metabolomics. 9, 1031–1040 (2013) [Google Scholar]
- 22.Helaleh MIH, Tanaka K, Fujii S-I, Korenaga T: GC/MS Determination of Phenolic Compounds in Soil Samples Using Soxhlet Extraction and Derivatization Techniques. Analytical Sciences. 17, 1225–1227 (2001) [DOI] [PubMed] [Google Scholar]
- 23.Alara OR, Abdurahman NH, Ukaegbu CI: Soxhlet extraction of phenolic compounds from Vernonia cinerea leaves and its antioxidant activity. Journal of Applied Research on Medicinal and Aromatic Plants. 11, 12–17 (2018) [Google Scholar]
- 24.Choong E, Rudaz S, Kottelat A, Guillarme D, Veuthey J-L, Eap CB: Therapeutic drug monitoring of seven psychotropic drugs and four metabolites in human plasma by HPLC–MS. Journal of Pharmaceutical and Biomedical Analysis. 50, 1000–1008 (2009) [DOI] [PubMed] [Google Scholar]
- 25.Badu-Tawiah AK, Eberlin LS, Ouyang Z, Cooks RG: Chemical Aspects of the Extractive Methods of Ambient Ionization Mass Spectrometry. 64, 481–505 (2013) [DOI] [PubMed] [Google Scholar]
- 26.Cooks RG, Ouyang Z, Takats Z, Wiseman JM: Ambient Mass Spectrometry. 311, 1566–1570 (2006) [DOI] [PubMed] [Google Scholar]
- 27.Belardi RP, Pawliszyn JB: The Application of Chemically Modified Fused Silica Fibers in the Extraction of Organics from Water Matrix Samples and their Rapid Transfer to Capillary Columns. Water Quality Research Journal. 24, 179–191 (1989) [Google Scholar]
- 28.Arthur CL, Killam LM, Buchholz KD, Pawliszyn J, Berg JR: Automation and optimization of solid-phase microextraction. Analytical Chemistry. 64, 1960–1966 (1992) [Google Scholar]
- 29.Chen J, Pawliszyn JB: Solid Phase Microextraction Coupled to High-Performance Liquid Chromatography. Analytical Chemistry. 67, 2530–2533 (1995) [DOI] [PubMed] [Google Scholar]
- 30.Jinno K, Kawazoe M, Saito Y, Takeichi T, Hayashida M: Sample preparation with fiber-in-tube solid-phase microextraction for capillary electrophoretic separation of tricyclic antidepressant drugs in human urine. Electrophoresis. 22, 3785–3790 (2001) [DOI] [PubMed] [Google Scholar]
- 31.Wu ML, Chen TY, Chen WJ, Fahad Baig MM, Wu YC, Chen YC: Carbon fiber ionization mass spectrometry coupled with solid phase microextraction for analysis of Benzo[a]pyrene. Anal Chim Acta. 1049, 133–140 (2019) [DOI] [PubMed] [Google Scholar]
- 32.Deng J, Li W, Yang Q, Liu Y, Fang L, Guo Y, Guo P, Lin L, Yang Y, Luan T: Biocompatible Surface-Coated Probe for in Vivo, in Situ, and Microscale Lipidomics of Small Biological Organisms and Cells Using Mass Spectrometry. Anal Chem. 90, 6936–6944 (2018) [DOI] [PubMed] [Google Scholar]
- 33.Reyes-Garcés N, Diwan M, Boyacı E, Gómez-Ríos GA, Bojko B, Nobrega JN, Bambico FR, Hamani C, Pawliszyn J: In Vivo Brain Sampling Using a Microextraction Probe Reveals Metabolic Changes in Rodents after Deep Brain Stimulation. Anal Chem. 91, 9875–9884 (2019) [DOI] [PubMed] [Google Scholar]
- 34.Vasiljevic T, Singh V, Pawliszyn J: Miniaturized SPME tips directly coupled to mass spectrometry for targeted determination and untargeted profiling of small samples. Talanta. 199, 689–697 (2019) [DOI] [PubMed] [Google Scholar]
- 35.Hook GL, Kimm GL, Hall T, Smith PA: Solid-phase microextraction (SPME) for rapid field sampling and analysis by gas chromatography-mass spectrometry (GC-MS). TrAC Trends in Analytical Chemistry. 21, 534–543 (2002) [Google Scholar]
- 36.Souza-Silva ÉA, Pawliszyn J: Direct Immersion Solid-Phase Microextraction with Matrix-Compatible Fiber Coating for Multiresidue Pesticide Analysis of Grapes by Gas Chromatography–Time-of-Flight Mass Spectrometry (DI-SPME-GC-ToFMS). Journal of Agricultural and Food Chemistry. 63, 4464–4477 (2015) [DOI] [PubMed] [Google Scholar]
- 37.Maggi F, Papa F, Cristalli G, Sagratini G, Vittori S: Characterisation of the mushroom-like flavour of Melittis melissophyllum L. subsp. melissophyllum by headspace solid-phase microextraction (HS-SPME) coupled with gas chromatography (GC–FID) and gas chromatography–mass spectrometry (GC–MS). Food Chemistry. 123, 983–992 (2010) [Google Scholar]
- 38.Xie W, Chavez-Eng CM, Fang W, Constanzer ML, Matuszewski BK, Mullett WM, Pawliszyn J: Quantitative liquid chromatographic and tandem mass spectrometric determination of vitamin D3 in human serum with derivatization: A comparison of in-tube LLE, 96-well plate LLE and in-tip SPME. Journal of Chromatography B. 879, 1457–1466 (2011) [DOI] [PubMed] [Google Scholar]
- 39.Vasiljevic T, Singh V, Pawliszyn J. Miniaturized SPME tips directly coupled to mass spectrometry for targeted determination and untargeted profiling of small samples. Talanta. 199, 689–697 (2019) [DOI] [PubMed] [Google Scholar]
- 40.Rocío-Bautista P, Famiglini G, Termopoli V, Palma P, Nazdrajić E, Pawliszyn J, Cappiello A: Direct Coupling of Bio-SPME to Liquid Electron Ionization-MS/MS via a Modified Microfluidic Open Interface. Journal of the American Society for Mass Spectrometry. 32, 262–269 (2021) [DOI] [PMC free article] [PubMed] [Google Scholar]
- 41.Vasiljevic T, Gómez-Ríos GA, Pawliszyn J: Single-Use Poly (etheretherketone) Solid-Phase Microextraction–Transmission Mode Devices for Rapid Screening and Quantitation of Drugs of Abuse in Oral Fluid and Urine via Direct Analysis in Real-Time Tandem Mass Spectrometry. Anal Chem. 90, 952–960 (2018) [DOI] [PubMed] [Google Scholar]
- 42.Zhao Y, Gong X, Si X, Wei Z, Yang C, Zhang S, Zhang X: Coupling a solid phase microextraction (SPME) probe with ambient MS for rapid enrichment and detection of phosphopeptides in biological samples. Analyst. 140, 2599–2602 (2015) [DOI] [PubMed] [Google Scholar]
- 43.Vasiljevic T, Gómez-Ríos GA, Li F, Liang P, Pawliszyn J: High-throughput quantification of drugs of abuse in biofluids via 96-solid-phase microextraction–transmission mode and direct analysis in real time mass spectrometry. 33, 1423–1433 (2019) [DOI] [PubMed] [Google Scholar]
- 44.Zhang C, Manicke NE: Development of a Paper Spray Mass Spectrometry Cartridge with Integrated Solid Phase Extraction for Bioanalysis. Analytical Chemistry. 87, 6212–6219 (2015) [DOI] [PubMed] [Google Scholar]
- 45.Deng J, Li W, Yang Q, Liu Y, Fang L, Guo Y, Guo P, Lin L, Yang Y, Luan T: Biocompatible Surface-Coated Probe for in Vivo, in Situ, and Microscale Lipidomics of Small Biological Organisms and Cells Using Mass Spectrometry. Analytical Chemistry. 90, 6936–6944 (2018) [DOI] [PubMed] [Google Scholar]
- 46.Hu B, Zheng B, Rickert D, Gómez-Ríos GA, Bojko B, Pawliszyn J, Yao Z-P: Direct coupling of solid phase microextraction with electrospray ionization mass spectrometry: A Case study for detection of ketamine in urine. Analytica Chimica Acta. 1075, 112–119 (2019) [DOI] [PubMed] [Google Scholar]
- 47.Lu K-H, Chen C-Y, Lee M-R: Trace determination of sulfonamides residues in meat with a combination of solid-phase microextraction and liquid chromatography–mass spectrometry. Talanta. 72, 1082–1087 (2007) [DOI] [PubMed] [Google Scholar]
- 48.Tascon M, Alam MN, Gómez-Ríos GA, Pawliszyn J: Development of a Microfluidic Open Interface with Flow Isolated Desorption Volume for the Direct Coupling of SPME Devices to Mass Spectrometry. Analytical Chemistry. 90, 2631–2638 (2018) [DOI] [PubMed] [Google Scholar]
- 49.Deng J, Yang Y, Fang L, Lin L, Zhou H, Luan T: Coupling Solid-Phase Microextraction with Ambient Mass Spectrometry Using Surface Coated Wooden-Tip Probe for Rapid Analysis of Ultra Trace Perfluorinated Compounds in Complex Samples. Analytical Chemistry. 86, 11159–11166 (2014) [DOI] [PubMed] [Google Scholar]
- 50.Colletes TC, Garcia PT, Campanha RB, Abdelnur PV, Romão W, Coltro WKT, Vaz BG: A new insert sample approach to paper spray mass spectrometry: a paper substrate with paraffin barriers. Analyst. 141, 1707–1713 (2016) [DOI] [PubMed] [Google Scholar]
- 51.Gómez-Ríos GA, Pawliszyn J: Development of Coated Blade Spray Ionization Mass Spectrometry for the Quantitation of Target Analytes Present in Complex Matrices. 53, 14503–14507 (2014) [DOI] [PubMed] [Google Scholar]
- 52.Lin SH, Lo TJ, Kuo FY, Chen YC: Real time monitoring of accelerated chemical reactions by ultrasonication-assisted spray ionization mass spectrometry. Journal of mass spectrometry: JMS. 49, 50–56 (2014) [DOI] [PubMed] [Google Scholar]
- 53.Chen T-Y, Lin J-Y, Chen J-Y, Chen Y-C: Ultrasonication-Assisted Spray Ionization Mass Spectrometry for the Analysis of Biomolecules in Solution. Journal of the American Society for Mass Spectrometry. 21, 1547–1553 (2010) [DOI] [PubMed] [Google Scholar]
- 54.Li X, Attanayake K, Valentine SJ, Li P: Vibrating Sharp-edge Spray Ionization (VSSI) for voltage-free direct analysis of samples using mass spectrometry. Rapid Commun. Mass Soectrom. 2021, 35(S1), e8232. [DOI] [PMC free article] [PubMed] [Google Scholar]
- 55.Ranganathan N, Li C, Suder T, Karanji AK, Li X, He Z, Valentine SJ, Li P: Capillary Vibrating Sharp-Edge Spray Ionization (cVSSI) for Voltage-Free Liquid Chromatography-Mass Spectrometry. Journal of The American Society for Mass Spectrometry. 30, 824–831 (2019) [DOI] [PMC free article] [PubMed] [Google Scholar]
- 56.Marginean I, Tang K, Smith RD, Kelly RT: Picoelectrospray Ionization Mass Spectrometry Using Narrow-Bore Chemically Etched Emitters. Journal of the American Society for Mass Spectrometry. 25, 30–36 (2014) [DOI] [PMC free article] [PubMed] [Google Scholar]
- 57.Santos JM, Vendramini PH, Schwab NV, Eberlin MN, de Morais DR: A dopant for improved sensitivity in easy ambient sonic-spray ionization mass spectrometry. Journal of Mass Spectrometry. 51, 53–61 (2016) [DOI] [PubMed] [Google Scholar]
- 58.Li C, Attanayake K, Valentine SJ, Li P: Facile Improvement of Negative Ion Mode Electrospray Ionization Using Capillary Vibrating Sharp-Edge Spray Ionization. Analytical Chemistry. 92, 2492–2502 (2020) [DOI] [PMC free article] [PubMed] [Google Scholar]
- 59.Pawliszyn J: Theory of solid-phase microextraction. J Chromatogr Sci. 38, 270–278 (2000) [DOI] [PubMed] [Google Scholar]
- 60.Gionfriddo E, Gómez-Ríos GA: Analysis of food samples made easy by microextraction technologies directly coupled to mass spectrometry. Journal of Mass Spectrometry. 56, e4665 (2021) [DOI] [PubMed] [Google Scholar]
- 61.Xie W, Mullett W, Pawliszyn J: High-throughput polymer monolith in-tip SPME fiber preparation and application in drug analysis. 3, 2613–2625 (2011) [DOI] [PubMed] [Google Scholar]
- 62.Gómez-Ríos GA, Reyes-Garcés N, Pawliszyn J: Evaluation of a multi-fiber exchange solid-phase microextraction system and its application to on-site sampling. Journal of Separation Science. 38, 3560–3567 (2015) [DOI] [PubMed] [Google Scholar]
- 63.Lundborg P, Steen B: Plasma levels and effect on heart rate and blood pressure of metoprolol after acute oral administration in 12 geriatric patients. Acta medica Scandinavica. 200, 397–402 (1976) [DOI] [PubMed] [Google Scholar]
- 64.Abdel-Hamid ME, Phillips OA: LC-MS/MS Determination of Carbamazepine, Pindolol, and Theophylline in Human Serum. Journal of Liquid Chromatography & Related Technologies. 26, 1937–1957 (2003) [Google Scholar]
- 65.Satoh T, Yasui H, Muro KEI, Komatsu Y, Sameshima S, Yamaguchi K, Sugihara K: Pharmacokinetic Assessment of Irinotecan, SN-38, and SN-38-Glucuronide: A Substudy of the FIRIS Study. Anticancer Research. 33, 3845 (2013) [PubMed] [Google Scholar]
- 66.Reigner B, Blesch K, Weidekamm E: Clinical Pharmacokinetics of Capecitabine. Clinical pharmacokinetics. 40, 85–104 (2001) [DOI] [PubMed] [Google Scholar]
- 67.Love JN: Acebutolol overdose resulting in fatalities. The Journal of emergency medicine. 18, 341–344 (2000) [DOI] [PubMed] [Google Scholar]
- 68.Bolli P, Bühler FR, Raeder EA, Amann FW, Meier M, Rogg H, Burckhardt D: Lack of beta-adrenoreceptor hypersensitivity after abrupt withdrawal of long-term therapy with oxprenolol. Circulation. 64, 1130–1134 (1981) [DOI] [PubMed] [Google Scholar]
Associated Data
This section collects any data citations, data availability statements, or supplementary materials included in this article.