

SUMMARY
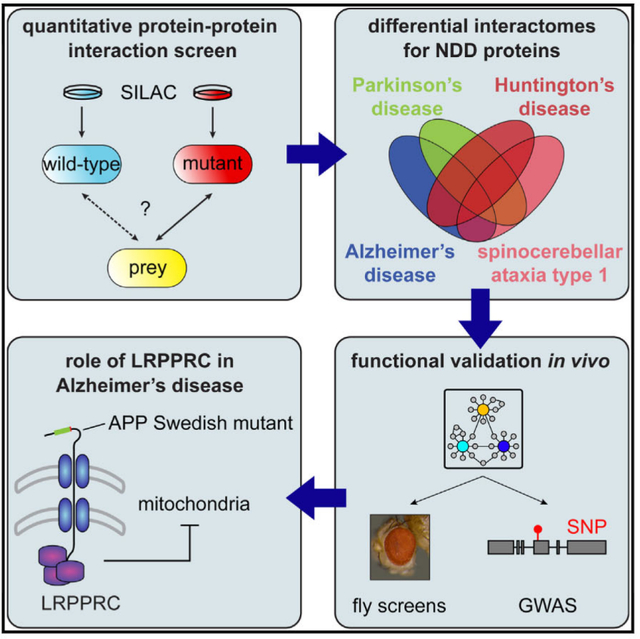
Several proteins have been linked to neurodegenerative disorders (NDDs), but their molecular function is not completely understood. Here, we used quantitative interaction proteomics to identify binding partners of Amyloid beta precursor protein (APP) and Presenilin-1 (PSEN1) for Alzheimer’s disease (AD), Huntingtin (HTT) for Huntington’s disease, Parkin (PARK2) for Parkinson’s disease, and Ataxin-1 (ATXN1) for spinocerebellar ataxia type 1. Our network reveals common signatures of protein degradation and misfolding and recapitulates known biology. Toxicity modifier screens and comparison to genome-wide association studies show that interaction partners are significantly linked to disease phenotypes in vivo. Direct comparison of wild-type proteins and disease-associated variants identified binders involved in pathogenesis, highlighting the value of differential interactome mapping. Finally, we show that the mitochondrial protein LRPPRC interacts preferentially with an early-onset AD variant of APP. This interaction appears to induce mitochondrial dysfunction, which is an early phenotype of AD.
In Brief
Hosp et al. show that quantitative interaction proteomics of neurodegenerative disease proteins captures interactions relevant to pathogenesis. Differential interactome mapping reveals preferential binding of the mitochondrial protein LRPPRC with an early-onset Alzheimer’s disease (AD) variant of APP, potentially contributing to mitochondrial dysfunction observed in AD.
Graphical Abstract
INTRODUCTION
The functional characterization of disease-associated proteins is a major challenge in the post-genomic era. Since proteins typically exert their function by binding other proteins, systematic mapping of protein-protein interactions (PPIs) can help with the understanding of protein function. The yeast two-hybrid (Y2H) system generated large-scale human PPI networks (Rual et al., 2005; Stelzl et al., 2005). Similarly, affinity purification and mass spectrometry (AP-MS) has been employed to create interactome maps for model organisms and humans (Ewing et al., 2007; Gingras et al., 2007; Guruharsha et al., 2011; Malovannaya et al., 2011). Although such interaction networks are still incomplete, they are beginning to provide valuable functional insights for human diseases (Barabási et al., 2011; Ideker and Sharan, 2008; Vidal et al., 2011).
Since mutations might alter PPIs, comparing the interactions of wild-type proteins and their disease-linked variants might be particularly informative (Schuster-Böckler and Bateman, 2008; Zhong et al., 2009). This information cannot be extracted from most available interaction datasets. The Y2H assay is at best semiquantitative and unable to detect small alterations in the affinity of PPIs (Estojak et al., 1995; Zhong et al., 2009). Similarly, most AP-MS studies only used semiquantitative methods like spectral counting or were performed entirely without quantification. Spectral counting yields unreliable data, especially when the interaction partner is of low abundance and/or the number of samples is small (Gingras and Raught, 2012; Rinner et al., 2007).
To overcome these problems, we sought to investigate PPIs of disease-associated proteins in a quantitative manner. Quantitative affinity purification and mass spectrometry (qAP-MS) can accurately distinguish between specific interaction partners and non-specific contaminants and quantify changes in PPIs upon perturbation (Paul et al., 2011; Vermeulen et al., 2008; Wepf et al., 2009). We reasoned that qAP-MS should be particularly well suited to identify interaction partners of disease-associated proteins. Therefore, we employed this technology to assess interaction partners of proteins involved in neurodegenerative diseases (NDDs). We focused on five well-known disease proteins involved in Alzheimer’s disease (AD), Huntington’s disease (HD), Parkinson’s disease (PD), and spinocerebellar ataxia type 1 (SCA1). These four NDDs are characterized by the accumulation of protein aggregates in the brain and the progressive loss of neurons (Ross and Poirier, 2004). HD and SCA1 are caused by expansion of CAG repeats in the huntingtin and ataxin-1 genes, respectively, which gives rise to proteins with abnormally long polyglutamine (polyQ) tracts (Chung et al., 1993; Rubinsztein et al., 1996). Although many risk factors contribute to prevalent cases of AD and PD, rare familial forms have been identified that are caused by mutations in few genes like APP, PSEN1/PSEN2, or PARK2 (Lin and Farrer, 2014; Tanzi and Bertram, 2005).
Our quantitative proteomics data provide a comparative protein interaction network across several NDDs, revealing both common modulators of several distinct disorders and disease-specific pathogenic properties. We validated our interaction data by co-immunoprecipitation (coIP) experiments and established links to disease phenotypes in animal models and humans. Our screen identified leucine-rich pentatricopeptide repeat motif containing protein (LRPPRC) as a preferential interactor of Amyloid beta precursor protein (APP) carrying the so-called Swedish mutation (APPsw), which causes early-onset AD. LRPPRC is a key regulator of mitochondrial gene expression. Thus, the interaction might contribute to mitochondrial dysfunction in AD.
RESULTS
Quantitative Interaction Screen for NDD Proteins
A fundamental challenge in biochemical screens for PPIs is the trade-off between sensitivity and specificity. To address this problem, we employed qAP-MS, in which the abundance of proteins co-purifying with the bait is compared with a control pull-down (Figure 1A). As an example, we show results from experiments with Ataxin-1 (ATXN1). We first investigated proteins specifically co-purifying with wild-type ATXN1 (normal polyQ track length, ATXN1-Q30) relative to the empty vector control in HEK293T cells. We identified 731 proteins, most of which had a heavy to light (H/L) stable isotope labeling by amino acids in cell culture (SILAC) ratio around 1 in both the forward experiment and the corresponding label swap (Figure 1B). These proteins were therefore considered unspecific contaminants (Figure S1A). ATXN1-Q30 itself had a high H/L ratio in the forward experiment and an inverse ratio in the reverse experiment, indicating efficient enrichment of the bait protein. In addition, several 14–3-3 proteins specifically co-purified with ATXN1-Q30 in both experiments (Figure S1B). 14–3-3 proteins are known interaction partners of wild-type and mutant ATXN1 with a critical role in ATXN1-mediated neurodegeneration in vivo (Chen et al., 2003). 14–3-3 proteins bind to ATXN1 phosphorylated on serine residue 776 by AKT (Chen et al., 2003; Emamian et al., 2003), and our mass spectrometry data showed that serine 776 is indeed phosphorylated (Figure S2). Another identified interaction partner was the transcriptional repressor Capicua protein homolog (CIC). ATXN1 is known to interact with CIC in the mouse brain and to alter its repressor activity (Lam et al., 2006). Collectively, these results indicate that our approach can identify functionally relevant in vivo interaction partners, including phosphorylation-dependent ones. Since AP-MS can enrich entire complexes, not all of these interaction partners are necessarily direct binders of the bait protein.
Figure 1. Experimental Design and Global Properties of the qAP-MS Screen.
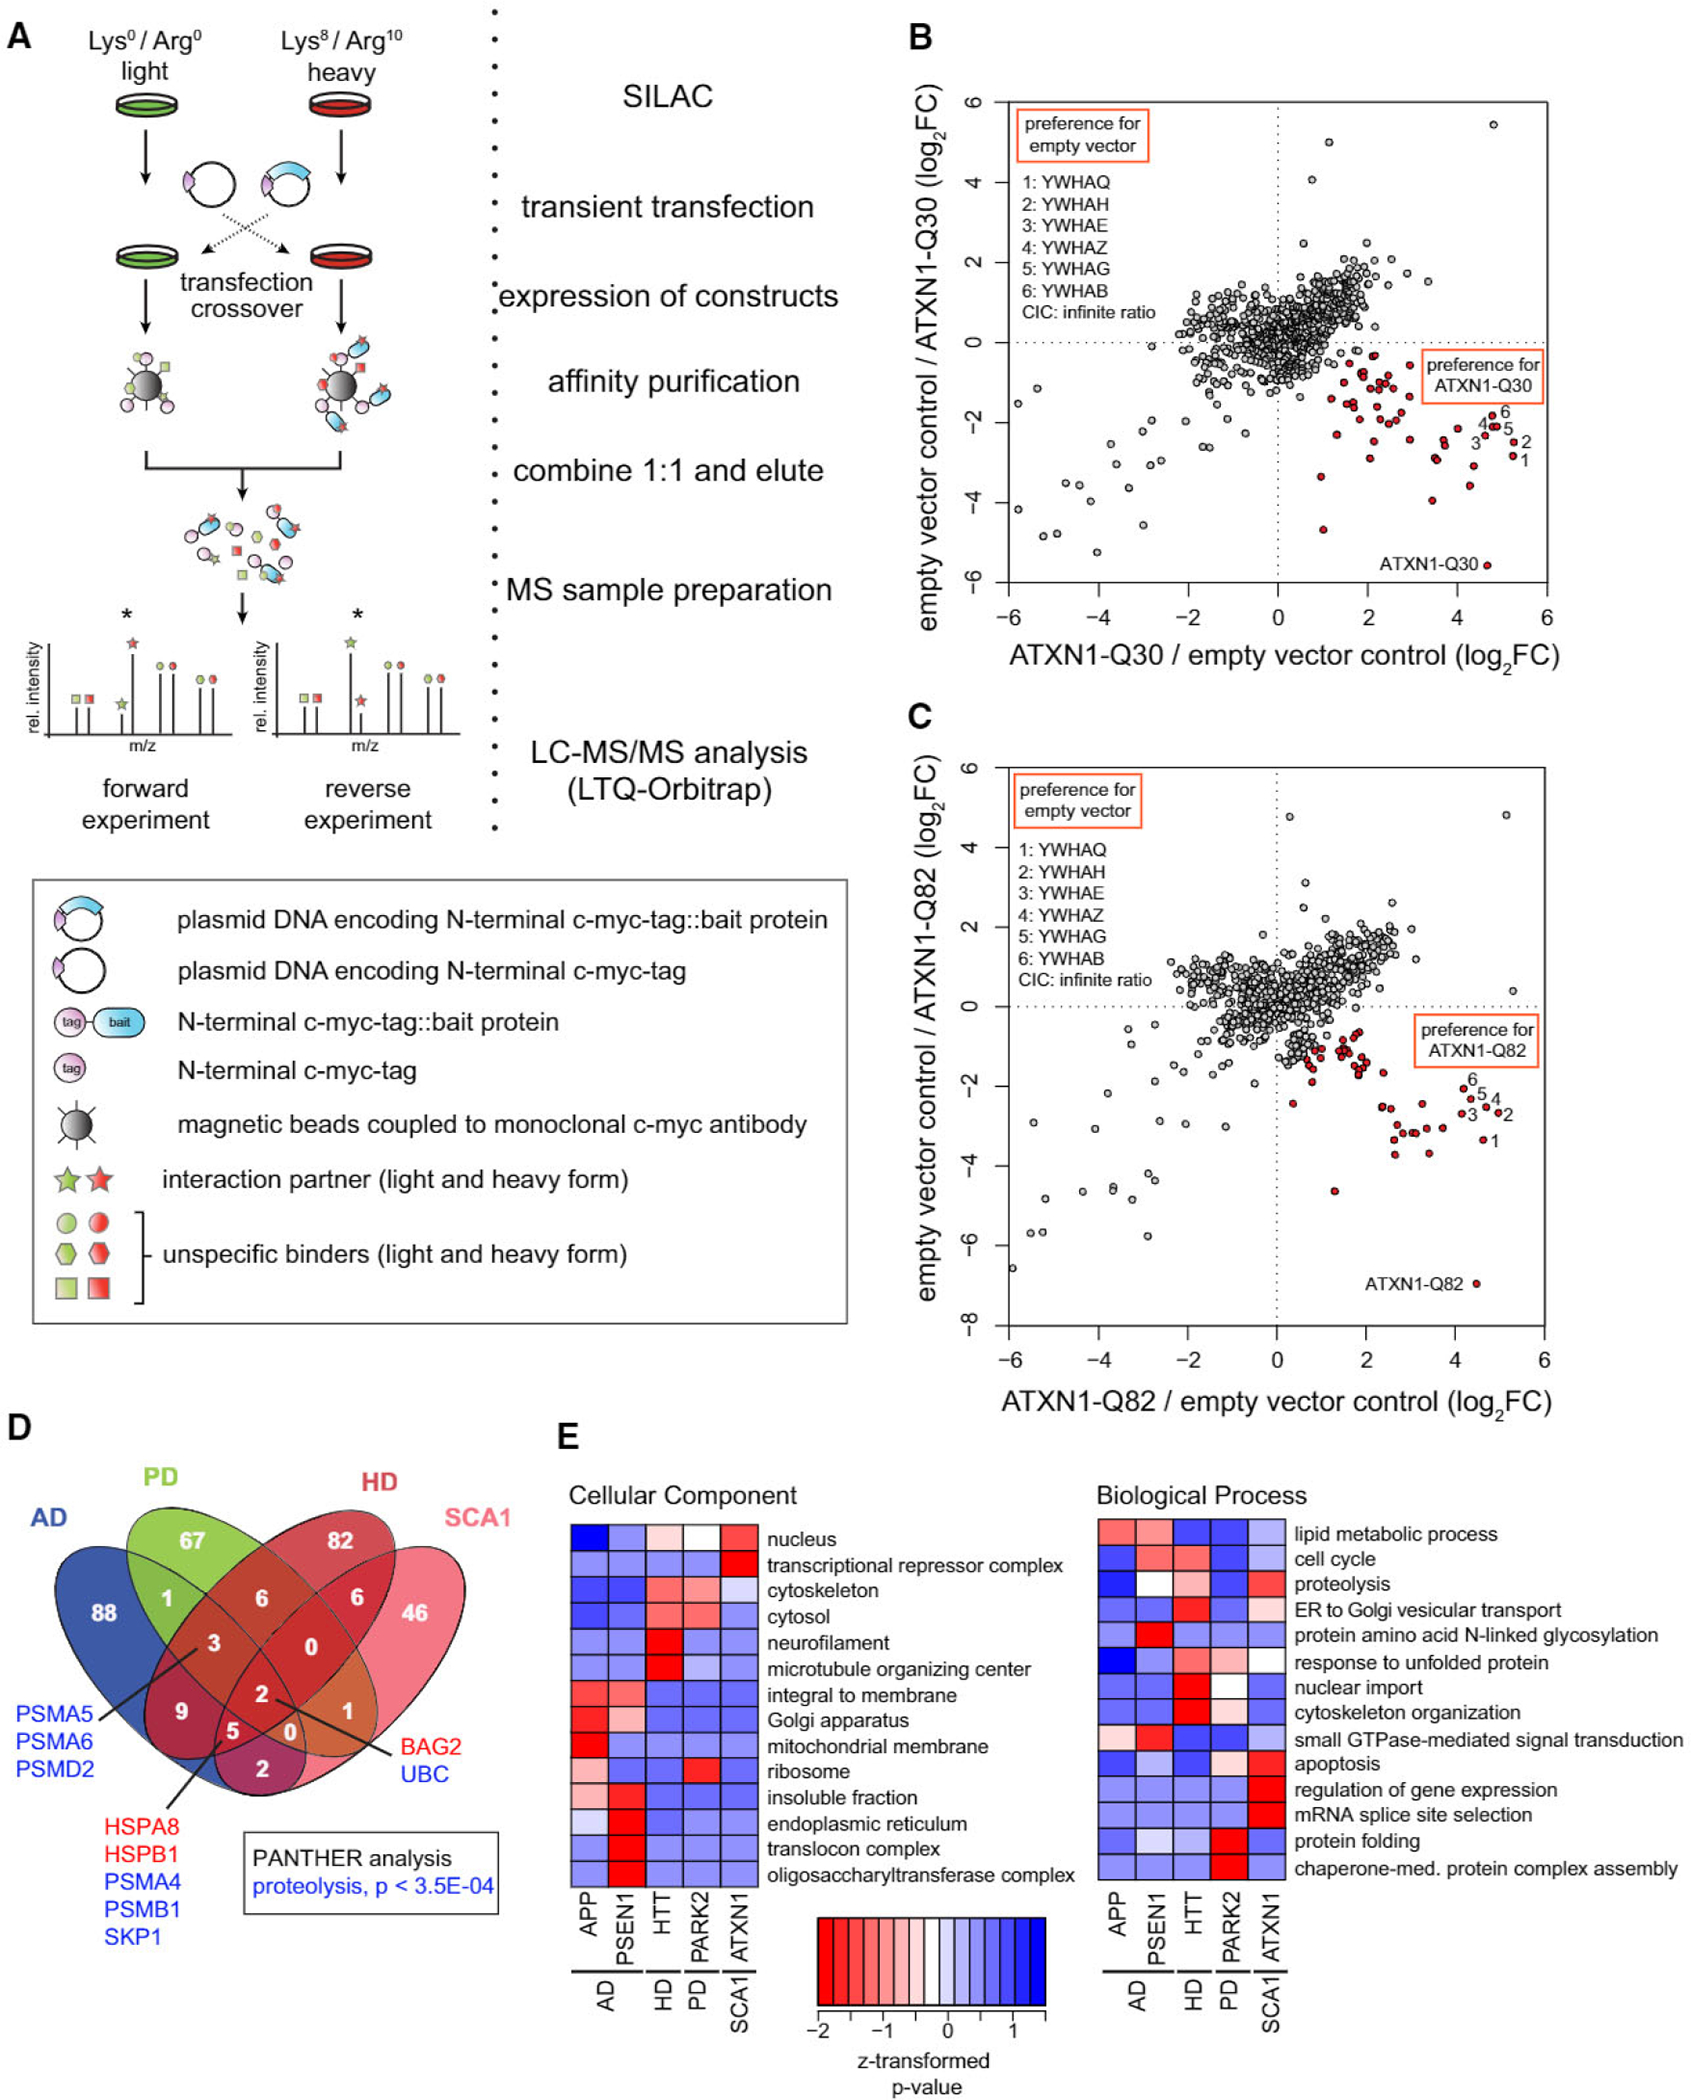
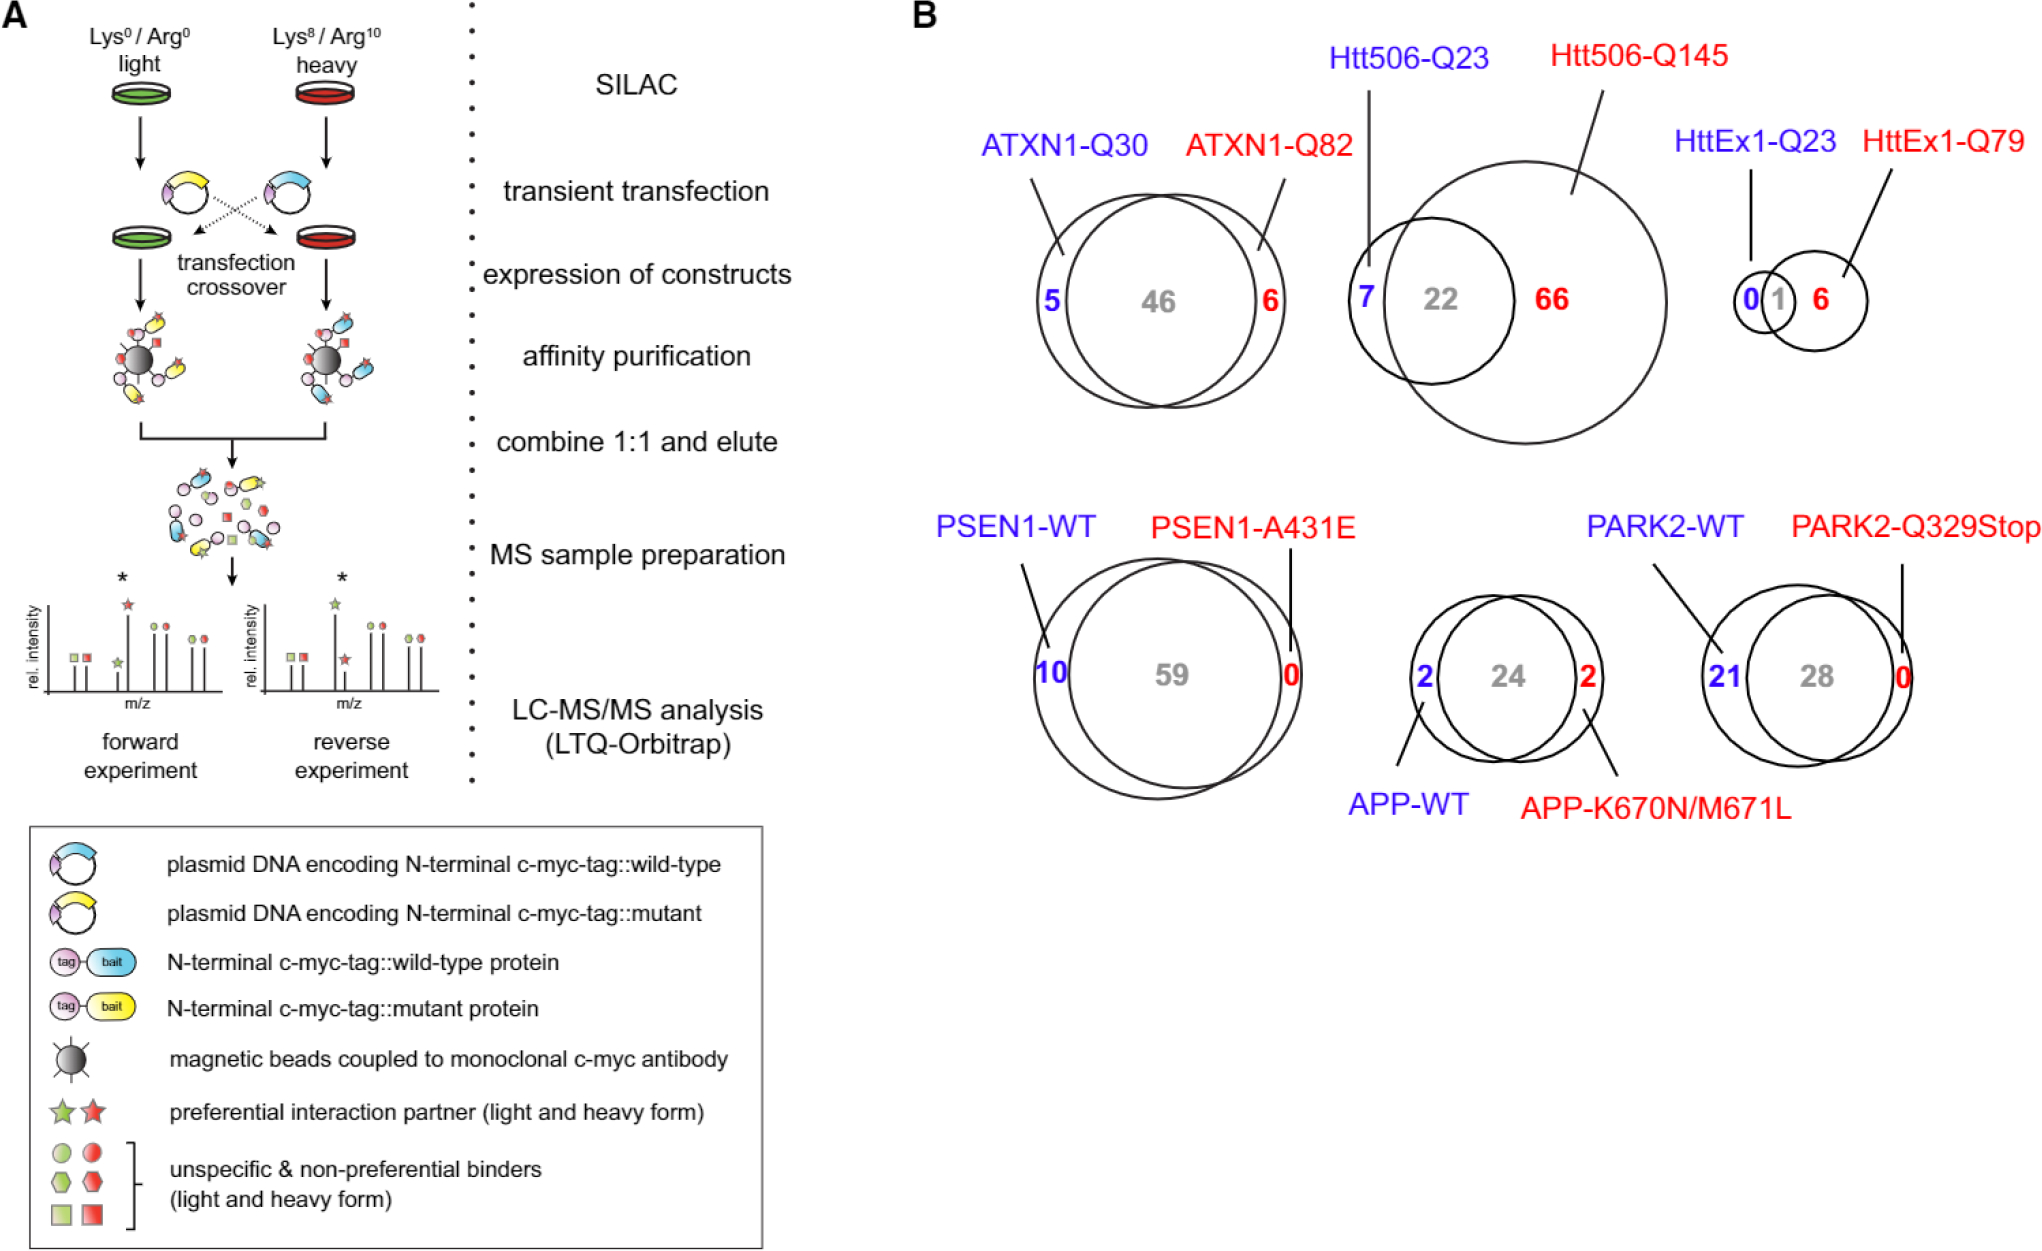
(A) Stable isotope-labeled HEK293T cells are transiently transfected with plasmids encoding a control or bait protein with a single c-myc-tag. Immunoprecipitation of tagged constructs is followed by liquid chromatography tandem mass spectrometry (LC-MS/MS) analysis. Crossover experiments are performed by swapping the transfected plasmid constructs. See also Figure S1.
(B and C) Protein-protein interaction screen for empty vector control pull-down against (B) ATXN1-Q30 (wild-type) and (C) ATXN1-Q82 (mutant), including reverse experiments. Specific interactors of ATXN1-Q30 or ATXN1-Q82, respectively, are marked in red. The position of the bait protein is indicated. See also Figure S2.
(D) A Venn diagram highlights unique and shared interactions between the bait proteins associated with different neurodegenerative diseases. See also Figures S3 and S4.
(E) Gene Ontology analysis of identified interactors.
Overall, we identified ~50 potential interaction partners of wild-type ATXN1. Several of these proteins are involved in splicing (MBNL1, SF1, U2AF1, and U2AF2) and transcriptional regulation (CIC, HDAC3, TBL1XR1, and MED27), consistent with the nuclear function of ATXN1 (Lam et al., 2006). Other proteins are involved in the ubiquitin proteasome system (PSMA4, PSMB1, SKP1, and UBC), consistent with previous data (Choi et al., 2007). Performing the same experiment with polyQ-extended ATXN1, we identified a similar number of potential interaction partners (Figures 1C and S1C). Of note, ~80% of the proteins were shared between the wild-type and disease-associated forms (Table S1). This result suggests that (1) polyQ expansion does not dramatically change the interaction partners of ATXN1 (see below) and (2) the reproducibility of the data is high.
Interaction Network of NDD Proteins
In total, we carried out qAP-MS screens for five different disease proteins involved in four NDDs (AD, HD, PD, and SCA1). For each protein, we used both the wild-type form and disease-associated variants, resulting in 12 different bait proteins (Figure S3A). Altogether, we performed 72 pull-downs of tagged bait proteins with corresponding empty vector controls. Every bait protein was tested in at least four biological replicates (i.e., at least two forward and two reverse experiments). Overall, the reproducibility between replicates was high (mean correlation coefficient R = 0.83; Figure S3B). To further increase robustness, we averaged over all forward and reverse experiments for each bait protein. Proteins were considered specific interaction partners when they (1) were enriched at least 2-fold on average and (2) showed inverted SILAC ratios in the reverse experiments (see the Supplemental Experimental Procedures for details). At this stage, we did not distinguish between wild-type forms and disease-associated variants but instead combined the data at the level of the disease protein (Table S1). In total, 373 proteins passed our cutoff criteria and were classified as interactors. Ten proteins were detected as shared interaction partners in at least three of the four diseases investigated (Figure 1D) and are enriched in the Gene Ontology (GO) term proteolysis (p < 3.5 × 10⁻⁴, Benjamini-Hochberg correction). This result is consistent with the idea that the ubiquitin-proteasome system and molecular chaperones are modulators of neurodegeneration in several NDDs (Williams and Paulson, 2008). Interestingly, however, most of the interactions were unique for a single disease. This was even the case for HD and SCA1, although both diseases are caused by proteins with elongated polyQ tracts. Hence, our data highlight considerable differences in disease pathogenesis and/or the native cellular function of the respective disease proteins.
Our NDD network contains several known interactions of biological relevance. For example, we observed binding of Presenilin-1 (PSEN1) to the N-oligosaccharyl transferase complex (OSC) (Lee et al., 2010) and the interaction of VCP with both Huntingtin (HTT) and Parkin (PARK2) (Hirabayashi et al., 2001; Imai et al., 2003). We also found that enriched GO terms of interaction partners are largely consistent with the respective bait protein in terms of localization and function (Figure 1E). Thus, our unbiased interaction network recapitulates results from multiple studies, strongly supporting the functional relevance of our data. On the other hand, we failed to identify several well-described interactions such as binding of APP and PSEN1 to the gamma-secretase complex. This may be due to the transient nature of these interactions or other factors. For example, it has been reported previously that the mature gamma-secretase complex can only be purified when pull-downs are combined with lectin-based affinity chromatography (Kimberly et al., 2002; Yang et al., 2002).
Since most of our interactions are novel, we sought to validate our data by independent experimental approaches. First, we tested if western blotting could validate the interactions. In 18 out of 18 tested cases (selection based on antibody availability), this confirmed our results (Figure S4A). Given that tagging, overexpression, and/or using HEK293T cells could also lead to false-positive interactions, we also performed coIP experiments with the endogenous proteins in neuroblastoma cells. In nine out of nine tested cases, these experiments validated the qAP-MS results (Figure S4B). Collectively, these results indicate that our qAP-MS screen detects PPIs with high specificity.
Interaction Partners of ATXN1 Are Relevant for Neurodegeneration In Vivo
Next, we sought to investigate the link between identified PPIs and NDD phenotypes in vivo. To this end, we employed a well-established Drosophila melanogaster model for NDD to test the relevance of identified ATXN1 interaction partners in vivo (Fernandez-Funez et al., 2000). As expected, flies expressing human ATXN1-Q82 in photoreceptor cells showed the characteristic, so-called rough-eye phenotype (REP) indicative of neurodegeneration (Figures 2A–2C). We then asked if proteins, which we identified as ATXN1-Q82 interaction partners, have an impact on the REP by knocking them down in a tissue-specific manner with small hairpin RNAs (shRNAs) (Dietzl et al., 2007). Of the 49 identified interaction partners of ATXN1-Q82, 24 had direct fly orthologs, and 14 of those were available as non-sterile shRNA strains. Silencing two of these genes affected eye morphology alone, and the strains were therefore excluded. The remaining 12 strains were crossed with ATXN1-Q82 transgenic flies to generate F1 flies that express ATXN1-Q82 and the respective shRNA under the same eye-specific promoter. Strains were classified according to the impact of the shRNA on the REP (from 0 = no impact to +++ = lethal). Intriguingly, 9 of the 12 lines exhibited a strong enhancement of the REP (++ or +++, Figures 2F and 2G; Table S2; Figure S5), including necrotic spots indicative of neurodegeneration from subjacent photoreceptor neurons (purple coloring, Figures 2F and 2G). In some cases, no viable offspring was obtained, suggesting a strong enhancement of the neurodegeneration phenotype (Figure 2G). The high overlap between ATXN1 interaction partners and genetic modifiers of ATXN1-mediated neurodegeneration strongly suggests that our data are functionally relevant for NDD phenotypes. The 75% hit rate is considerably higher than the typical hit rate in unbiased genetic screens (1%–4%) (Fernandez-Funez et al., 2000; Kaltenbach et al., 2007), which makes the overlap highly significant (p < 3.4 × 10⁻¹⁰, hypergeometric test with an assumed hit rate of 5%). We also tested all 12 shRNA in another Drosophila model expressing human tau protein (GMR_Tau[R406W]), which exhibit a similar REP (Chatterjee et al., 2009). None of the 12 tested shRNA lines showed an apparent REP change in this model. Thus, the observed REP-modifying effects are specific for the ATXN1-Q82 disease model (Table S2). Collectively, these experiments show that our interaction partners are specifically relevant for ATXN1-Q82-mediated neurodegeneration in vivo.
Figure 2. Disease-Modifying Effects of ATXN1 Interactors In Vivo.
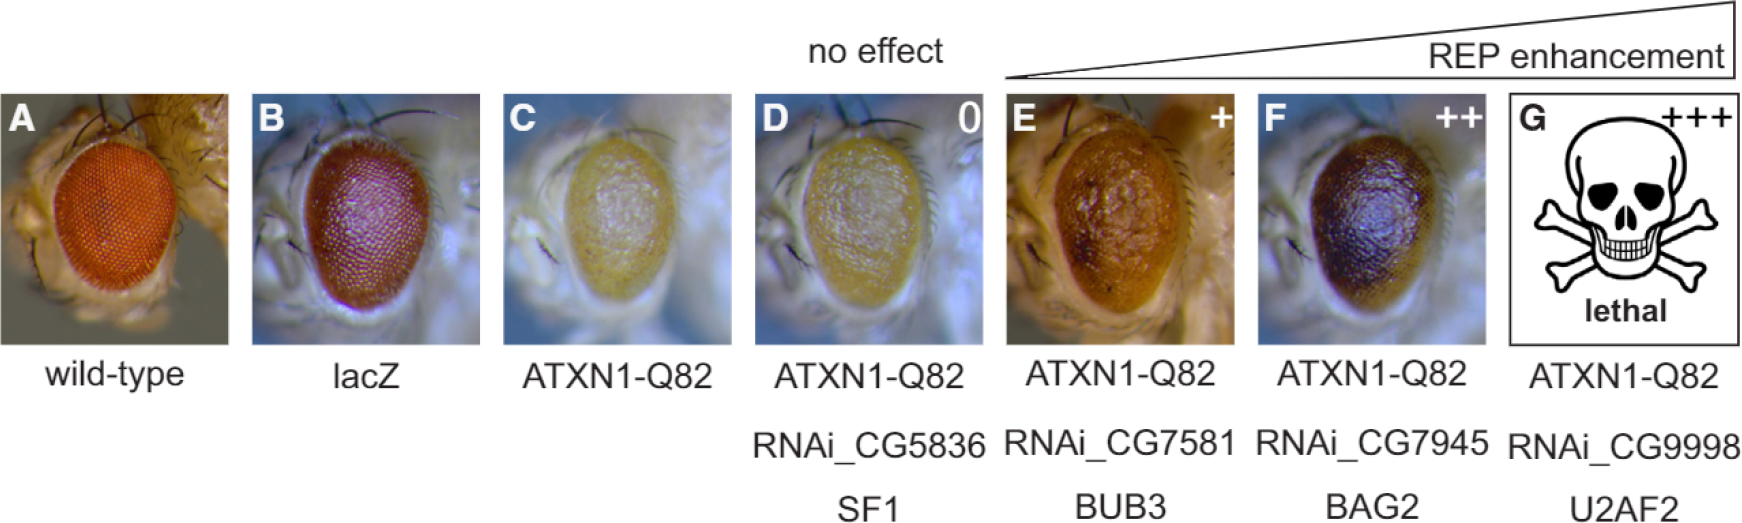
(A and B) Eye pictures of wild-type (A) and lacZ-expressing (B) Drosophila are shown as controls.
(C) Expression of ATXN1-Q82 in the fly compound eye induces a rough eye phenotype (REP).
(D–G) RNAi-mediated silencing of identified qAP-MS targets enhances the REP induced by ATXN1-Q82 expression (purple spots are necrotic lesions). REP-modifying effect classification: 0, unchanged; +, mild enhancement; ++ strong enhancement; +++, lethal.
Interaction Partners of APP and PSEN1 Are Linked to Human Disease Phenotypes
To investigate whether our identified interaction partners are also linked to disease phenotypes in humans, we compared our interaction data for APP and PSEN1 with a genome-wide association study (GWAS) for AD (Li et al., 2008). We used gene set enrichment analysis of SNP data (Heinig et al., 2010; Holden et al., 2008) to test if genes encoding APP and PSEN1 interaction partners are also found as candidates in the AD GWAS data (Figure 3A; see Experimental Procedures for details). We found that SNPs associated with interaction partners of wild-type and mutant APP and mutant PSEN1 had significantly lower p values than the global distribution of SNPs (Figures 3B and 3C; Table S3; one-sided Wilcoxon-Mann-Whitney test). Thus, the interactome of these proteins is significantly associated with disease, even though no single interaction partner alone showed genome-wide significance in this GWAS. To validate these findings, we went on and replicated this analysis with an independent GWAS dataset based on a larger cohort (Harold et al., 2009). We were able to replicate our findings for wild-type and mutant APP (Figures 3B and 3C; Table S3). In summary, the comparison with GWAS data suggests that our interaction maps for APP and PSEN1 are functionally relevant for AD. This corroborates the view that PPI data can help linking disease genes and phenotypes (Lundby et al., 2014; Rossin et al., 2011).
Figure 3. APP and PSEN1 Interactors Are Linked to Human Disease Phenotypes.
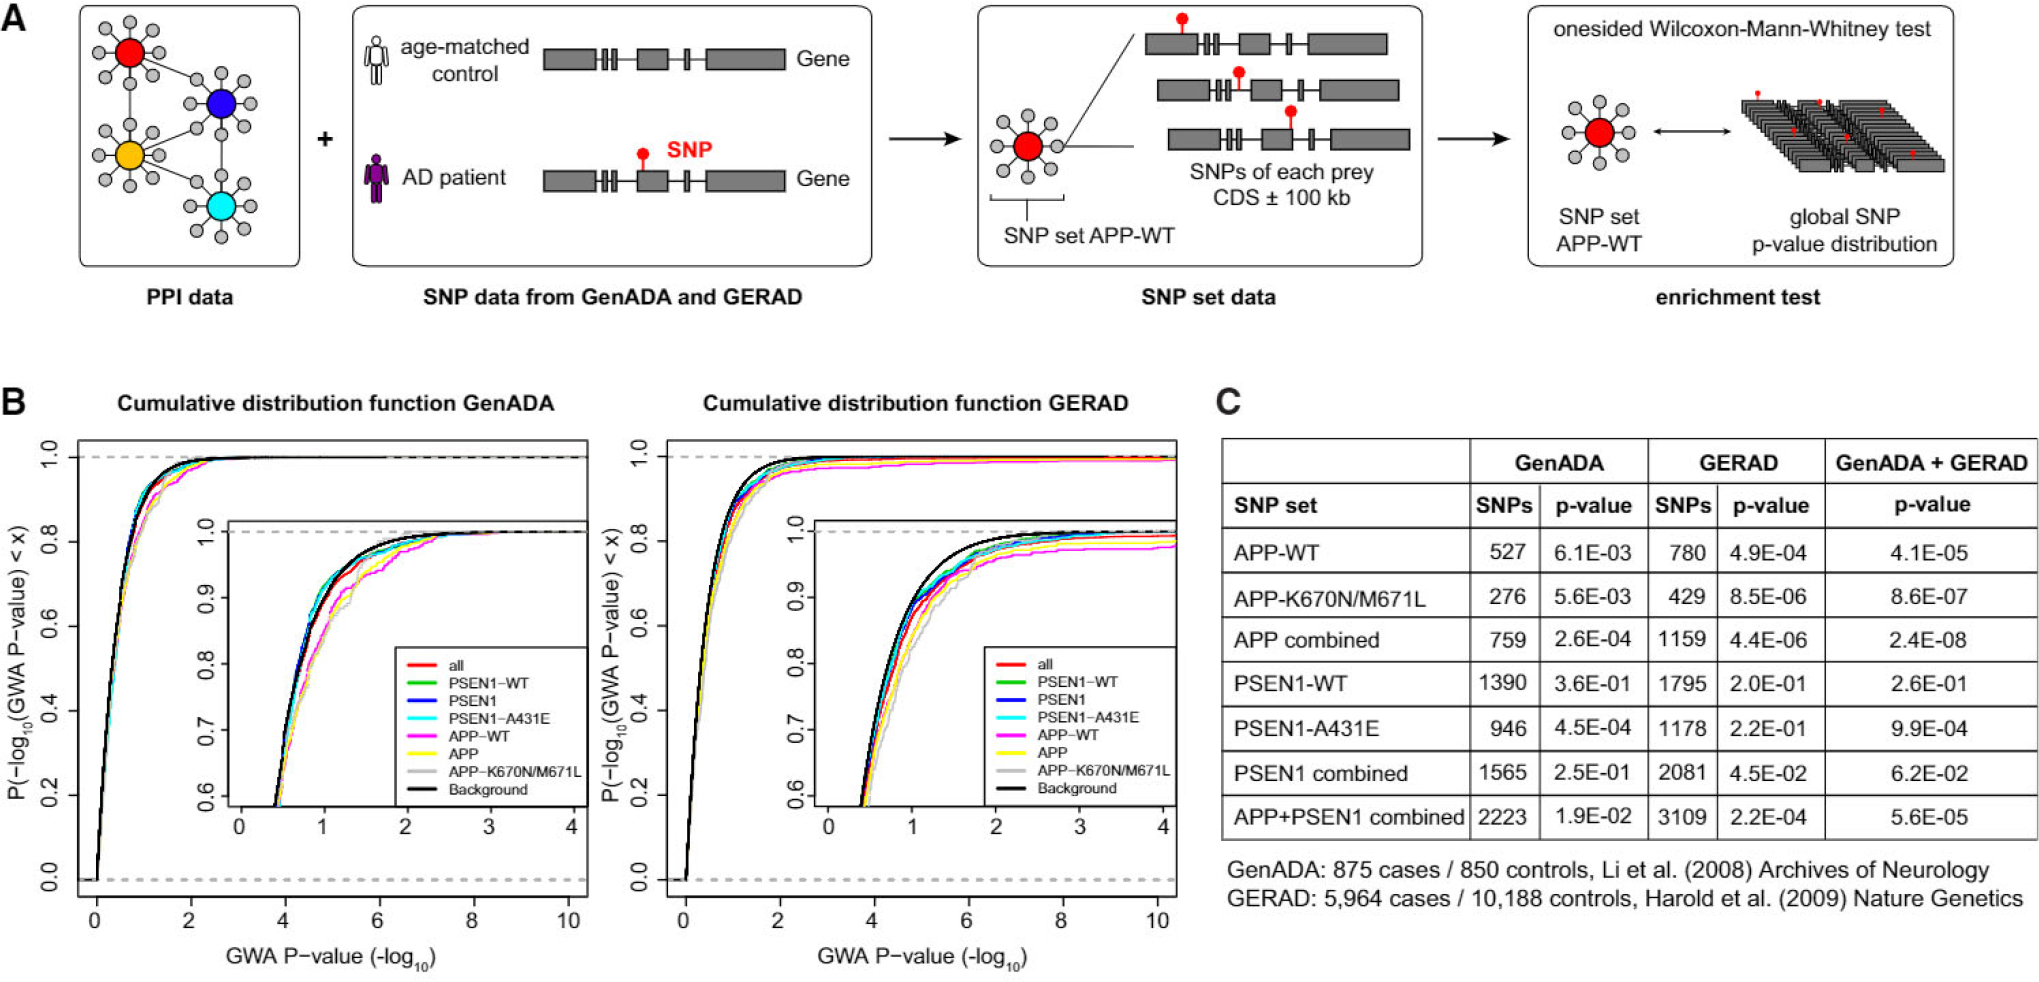
(A) Gene set enrichment analysis workflow for qAP-MS targets of Alzheimer’s disease.
(B) Cumulative distribution function of the p values of SNPs associated with genes in the different subsets for the GenADA and the GERAD cohort.
(C) GSEA-SNP results for GenADA and GERAD cohorts. Interactors of mutant baits are significantly linked to disease. p values are based on a one-sided Wilcoxon-Mann-Whitney test.
See also Table S3.
Preferential Interactions of Wild-Type Proteins and Disease-Associated Variants
Next, we asked if our approach could also identify differential protein binding behavior between the wild-type form of a protein and its disease-associated variant in the same pull-down experiment. To this end, we directly compared interaction partners of wild-type proteins and their disease-associated variants by transfecting HEK293T cells with either the myc-tagged wild-type bait proteins or their disease-associated variants (Figures 4A and S3A). Proteins were considered preferential binders when they were enriched at least 1.4-fold on average and showed an inverted ratio in the crossover experiment (Figure S6; Experimental Procedures). While most proteins had abundance ratios close to one, we found that several of our previously identified interactors indeed showed a preferential binding behavior for one of the two offered bait protein variants (Figure 4B). In total, we identified 125 proteins with preferential binding behavior with our qAP-MS approach (Table S1), including several already known differential interactors. For instance, we observed preferential binding of the Capicua homolog CIC toward the ATXN1-Q30 wild-type when compared to the ATXN1-Q82 mutant variant, as previously reported (Lim et al., 2008). The N-Cor/SMRT complex member HDAC3 showed the same behavior, consistent with the finding that ATXN1 loss of function contributes to transcriptional dysregulation (Crespo-Barreto et al., 2010). We also observed that two members (DDOST and RPN1) of the OST bound preferentially to wild-type PSEN1 compared to PSEN1-A431E. This interaction has recently been shown to mediate glycosylation of the v-ATPase required for lysosomal targeting, proteolysis, and autophagy, although it was not known before that it is affected by the disease-associated mutation (Lee et al., 2010).
Figure 4. Preferential Protein-Protein Interactions for Wild-Type or Disease-Associated Bait Variants.
(A) Stable isotope-labeled HEK293T cells are transiently transfected with plasmids encoding a wild-type or mutant bait protein with a single c-myc-tag. Immunoprecipitation of tagged constructs is followed by LC-MS/MS analysis. Crossover experiments are performed by swapping the transfected plasmid constructs.
(B) Venn diagrams comparison of preferential interactors for wild-type (blue) or disease-associated variants (red). Interactors not showing a preferential behavior for either one of the bait variants are depicted in gray. Classification as preferential binder was restricted to proteins that were also identified in the corresponding experiments with empty vector controls (Figure 1A).
See also Figure S6.
The APP Swedish Mutant K670N/M671L Binds LRPPRC and Impairs Mitochondrial Function
To further validate our data, we selected one differential binding partner for follow-up experiments. We focused on the interaction between APP and LRPPRC. LRPPRC is a conserved nuclear gene that encodes an RNA-binding protein that is imported into mitochondria (Sterky et al., 2010). In the mitochondrial matrix, LRPPRC post-transcriptionally regulates the expression of mitochondrial genes (Gohil et al., 2010; Ruzzenente et al., 2012; Sasarman et al., 2010). LRPPRC is therefore an essential regulator of the mitochondrial respiratory chain. Intriguingly, mutations in LRPPRC cause Leigh syndrome of the French-Canadian type (LSFC), a NDD characterized by complex IV deficiency (Mootha et al., 2003). Thus, LRPPRC is itself an NDD-associated gene.
Our original screen identified LRPPRC as an interaction partner of both wild-type APP and APP-K670N/M671L (Table S1). In the direct comparison, LRPPRC co-purified preferentially with the disease-associated form (Figure 5A; Table S1). The K670N/M671L variant of APP is the so-called Swedish mutation (APPsw), which causes excessive production of Aβ and leads to early-onset AD with highly elevated levels of oxidative stress (Marques et al., 2003). Given that it is well established that mitochondrial function is impaired in AD (Querfurth and LaFerla, 2010), we hypothesized that the APP/LRPPRC interaction might contribute to mitochondrial dysfunction.
Figure 5. LRPPRC Preferentially Binds the APP Swedish Mutant K670N/M671L.
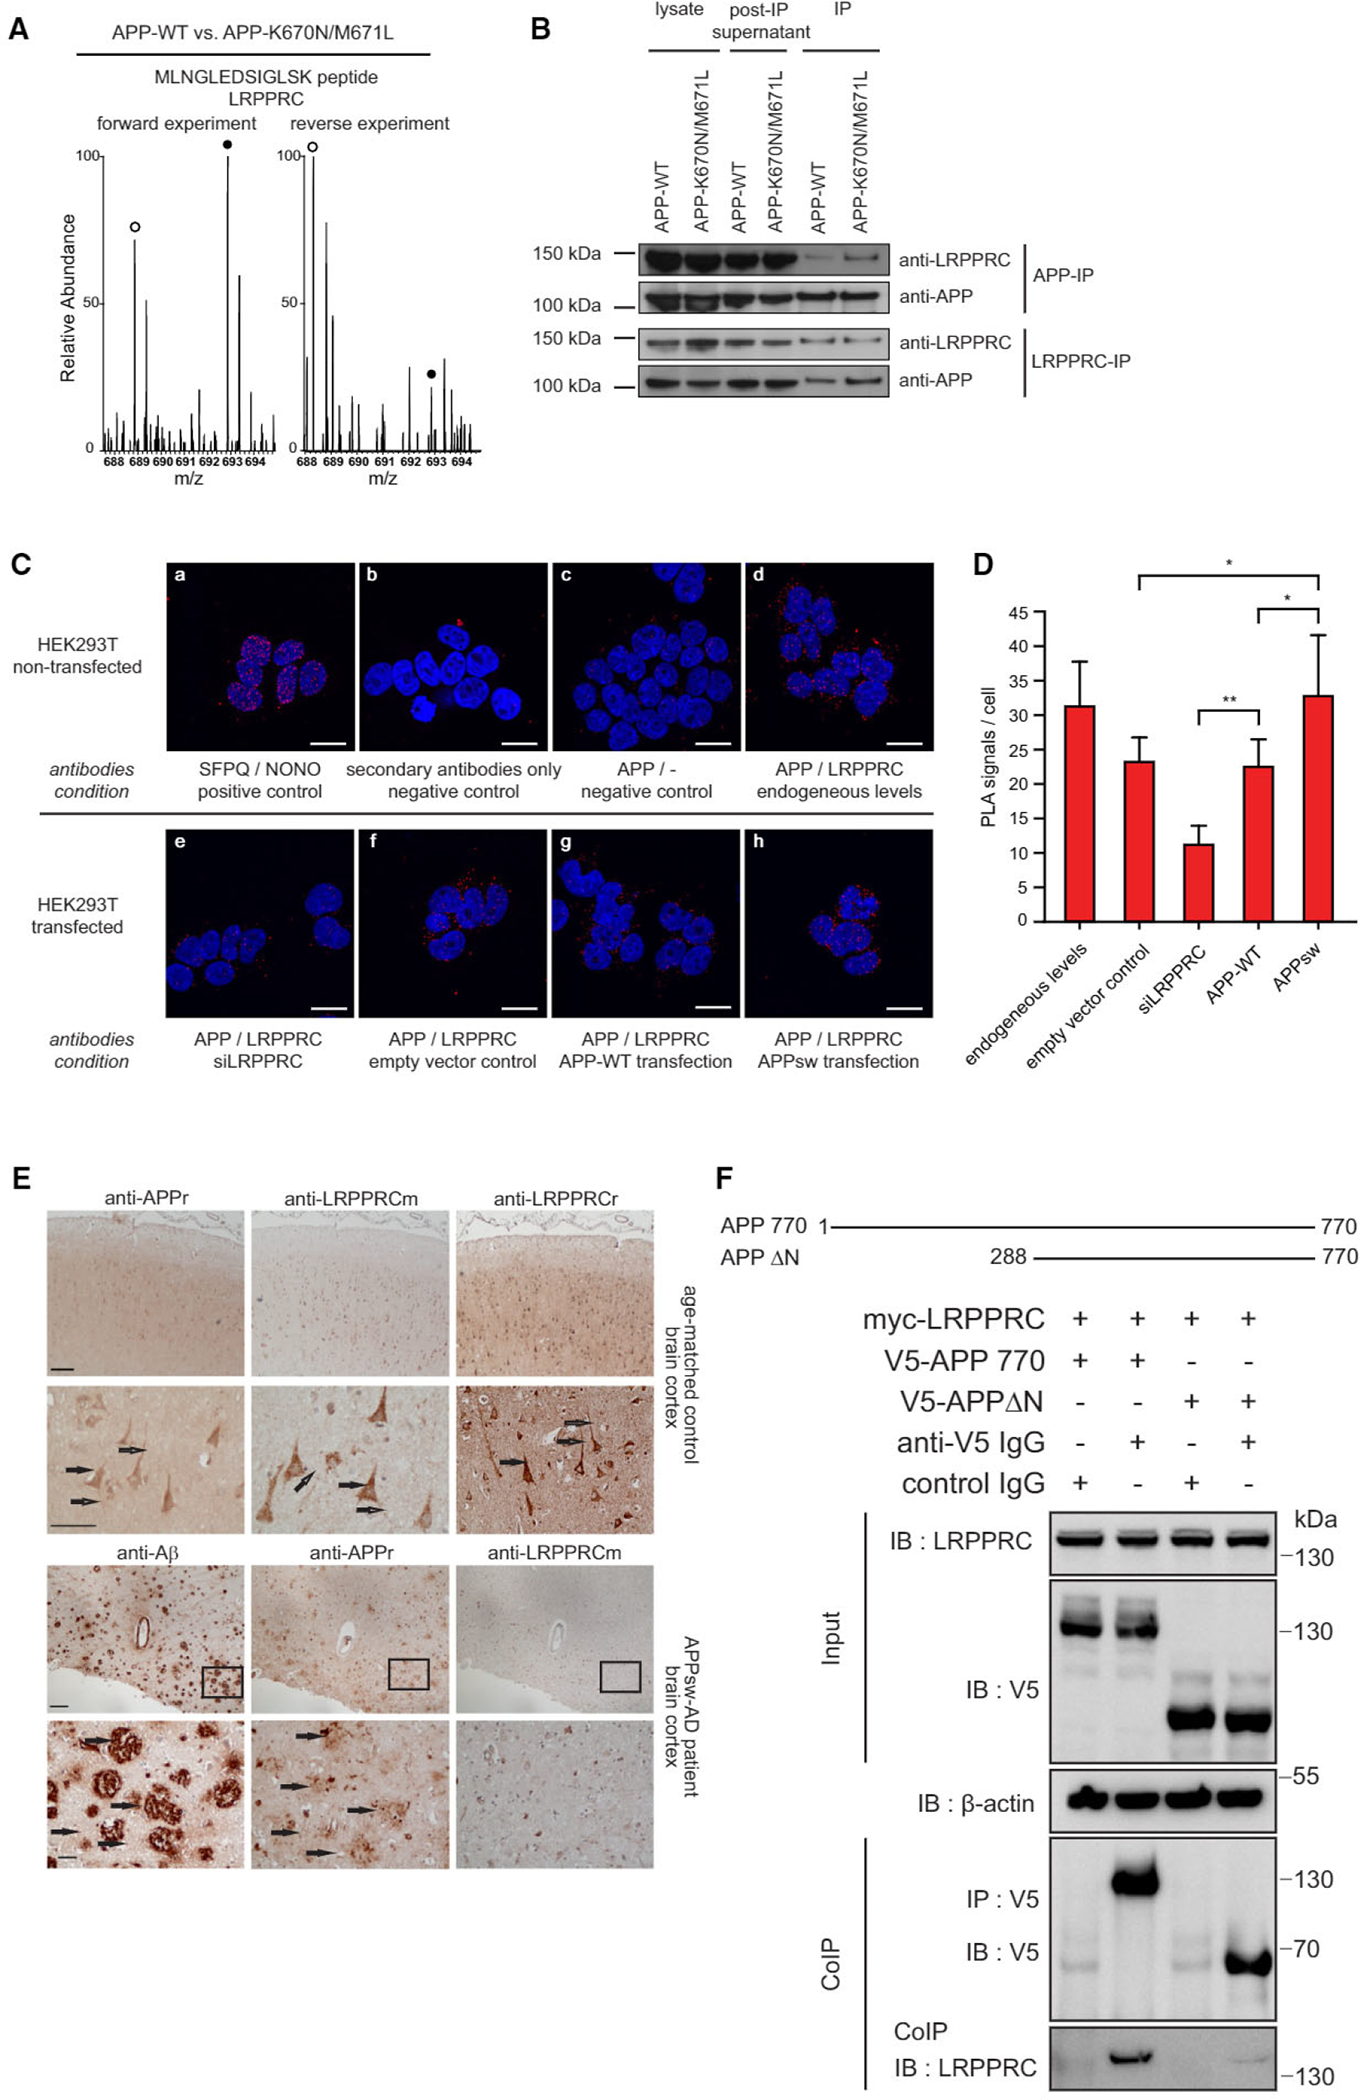
(A) MS spectrum showing light and heavy (white and black circles) isotope clusters of a LRPPRC-derived peptide in the forward and reverse experiments.
(B) Reciprocal co-immunoprecipitation of APP and LRPPRC after transfection of APP variants in HEK293T cells. The APPsw mutation (K670N/M671L) co-precipitates stronger with LRPPRC and vice versa, compared to APP wild-type.
(C) Proximity ligation assay (PLA) in non-transfected or transfected HEK293T cells: (a) positive control for SFPQ and NONO; (b) negative control without primary antibodies; (c) negative control without primary antibody for LRPPRC; (d) staining for endogenous levels of APP and LRPPRC; (e) siRNA-mediated knockdown of LRPPRC; (f) cells transfected with empty vector; (g) cells transfected with APP-WT; (h) cells transfected with APPsw. Scale bars, 25 μm. See also Figure S7.
(D) Quantification of PLA results from (C) (mean + SD; n = 3; *p < 0.05; **p < 0.005; >50 cells counted per experiment), two-tailed Student’s t test.
(E) Upper panel: immunodetection of LRPPRC in healthy aged-matched frontal cortex. Distinct granular immunostaining in neuronal cells along the cortical region is detected. Arrows in the higher magnifications from the same areas point to vesicular-like structures in the cytoplasm (black arrows) and in the neuronal processes (open arrows), similarly as for APP. Scale bar in upper panel is 500 μm and 200 μm in the magnified insets. Lower panel: immunodetection of Abeta plaques in the ADsw temporal cortex. Plaque peripheries are immunodecorated by anti-APP staining (black arrows), while anti-LRPPRC staining was negative. Scale bars represent 500 μm and 100 μm, respectively.
(F) LRPPRC co-purifies with APP splice-isoforms (APP770, APP695) and a C-terminal APP truncation (APP305) but not with an N-terminal APP truncation (APPΔN).
First, we used co-immunoprecipitation to confirm that the amount of LRPPRC that co-purified with APP was slightly higher for the Swedish variant (Figure 5B). Conversely, when we immunoprecipitated LRPPRC, we detected more APPsw than wild-type APP in the precipitate. Thus, the preferential binding observed by qAP-MS could be validated by reciprocal coIPs. We also found that endogenous (i.e., wild-type) APP and LRPPRC interact in neuroblastoma cells (Figure S4B). Second, in order to assess the differential binding behavior with an independent method, we used the proximity ligation assay (PLA). PLA detects endogenous protein complexes in situ using antibody-linked oligonucleotides (Söderberg et al., 2006). We found that endogenous APP and LRPPRC co-localized in HEK293T cells (Figure 6C, upper panels). Moreover, transfecting APPsw, but not wild-type APP, significantly increased the signal compared to the empty vector control (Figures 5C, lower panels, and 5D). We also found that a small interfering RNA (siRNA) against LRPPRC significantly reduced the signal, which validates the specificity of the assay. PLA experiments also showed co-localization of endogenous APP and LRPPRC in neuroblastoma cells (Figure S7). Next, to investigate the relationship between LRPPRC and APP in the human brain, we performed immunohistochemistry in postmortem cortical brain slices of a patient with early-onset AD caused by APPsw and age-matched controls (Figure 5E). We found that APP and LRPPRC are co-expressed in cortical neurons of healthy controls with an overall similar staining pattern, although these data cannot be used to infer co-localization. Importantly, no LRPPRC staining was observed in the Aβ-positive amyloid plaques in AD patients. Thus, the protein does not appear to interact with Aβ in the extracellular aggregates in affected brain regions. In summary, these data confirm the specific interaction between LRPPRC and APP and the preferential interaction with the Swedish mutant. The observation that LRPPRC is not a component of amyloid plaques in AD patients suggests that the interaction occurs with intracellular APP and not with extracellular Aβ.
Figure 6. The LRPPRC/APPsw Interaction Impairs Mitochondrial Function.
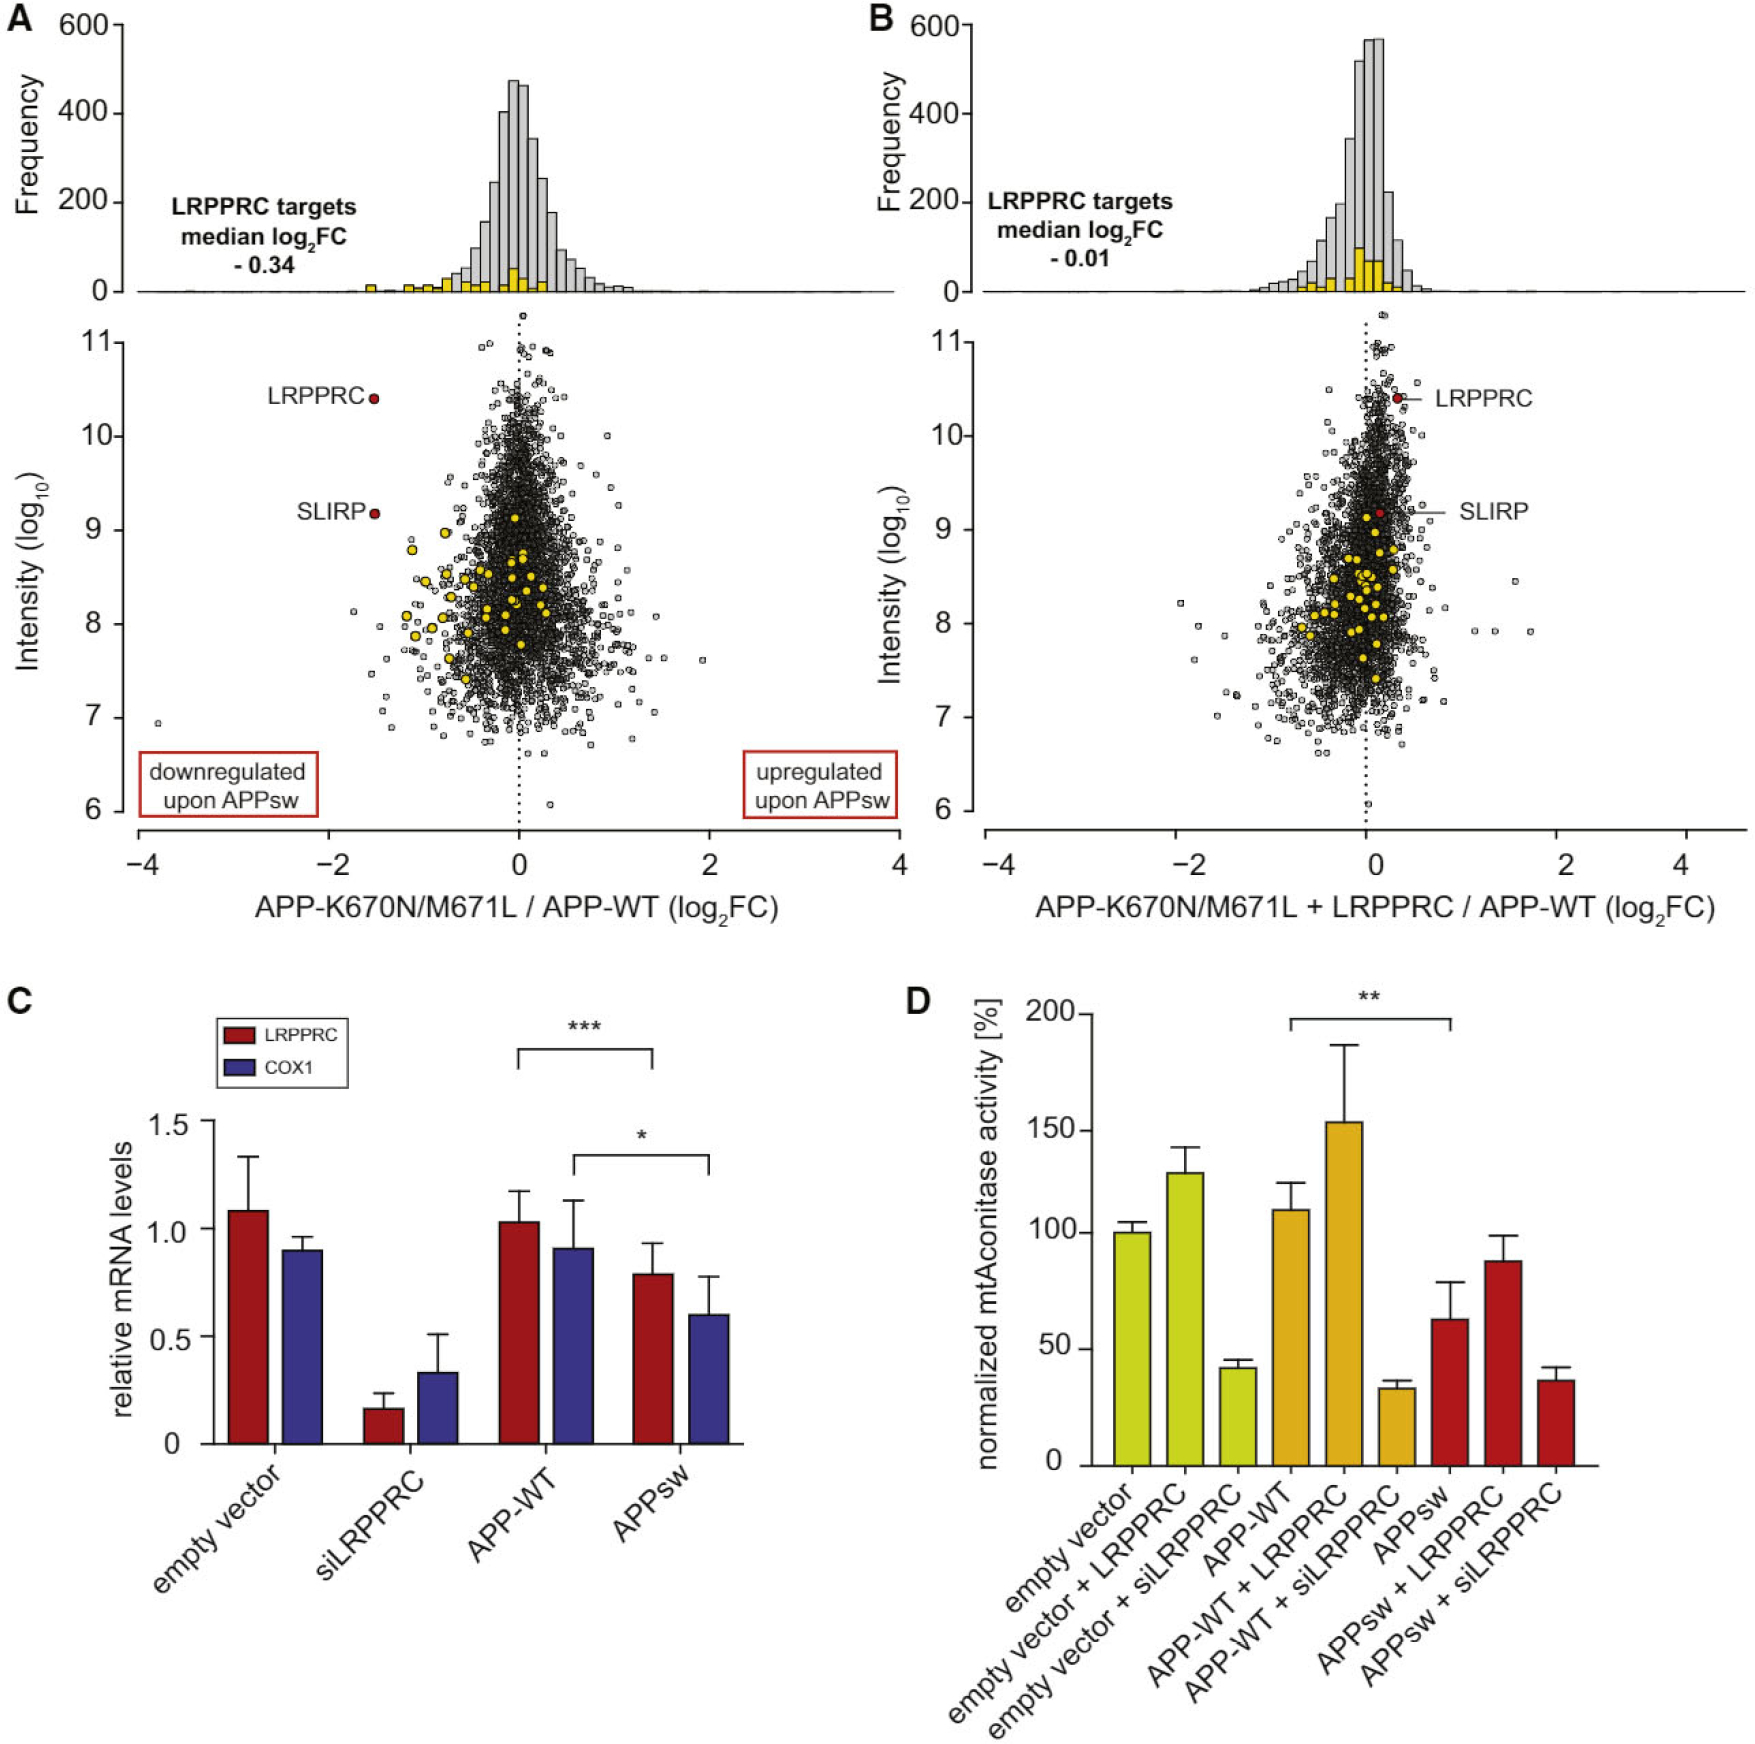
(A and B) SILAC-based LC-MS/MS analysis reveals global proteome changes in HEK293T cells 48 hr post transfection. Heights of the yellow bars were multiplied by ten for better visibility. (A) LRPPRC and SLIRP (marked in red) as well as downstream targets (mitochondrial complex I and IV members marked in yellow) show reduced expression after APPsw transfection compared to cells expressing APP wild-type. (B) Co-expression of LRPPRC together with APPsw results in almost APP wild-type expression levels.
(C) mRNA levels of LRPPRC and its downstream target COX1 are reduced in APPsw-expressing cells as measured by qRT-PCR; mean + SD, n = 5, ***p < 0.0005; *p < 0.05, two-tailed Student’s t test.
(D) Aconitase activity assay in transfected HEK293T cells; mean + SD; n = 4; **p < 0.005.
Mature LRPPRC is considered to be exclusively located in the mitochondrial matrix (Sterky et al., 2010). While APP is mainly thought to be associated with the plasma membrane and the ER, it is also recruited to mitochondria via a cryptic targeting sequence (Devi and Anandatheerthavarada, 2010; Devi et al., 2006; Keil et al., 2004; Lin and Beal, 2006; Park et al., 2006). Mitochondrial APP is not completely imported into the organelle but remains associated with mitochondrial translocases such as TOMM40. Consistently, we also identified TOMM40 and other mitochondrial membrane proteins as APP interactors (Figure 1E; Table S1). The topology of APP in mitochondria is such that its N terminus is located in the matrix while the C terminus faces the cytoplasm (Anandatheerthavarada et al., 2003; Devi et al., 2006). Given the topology of mitochondria-associated APP, the interaction with LRPPRC should occur via the matrix-exposed N terminus. To investigate this possibility, we tested the interaction of LRPPRC with an N-terminal truncation (Figure 5F). LRPPRC co-purified with full-length APP (APP770), but not with APPΔN. These findings suggest that LRPPRC binds to the mitochondrial matrix-exposed N terminus of APP.
Given that LRPPRC is a central regulator of mitochondrial gene expression, we asked how APPsw affects the proteome. We transiently transfected differentially SILAC-labeled cells with APP or APPsw for 48 hr. Quantitative proteomics revealed that APPsw markedly (~3-fold) downregulated the cellular levels of LRPPRC itself and its binding partner, SLIRP (Figure 6A). It is remarkable that these proteins were among the most strongly regulated ones in our unbiased experiment. Additionally, several members of the cytochrome c oxidase or the NADH dehydrogenase complexes were downregulated (Figure 6A). Thus, APPsw mediates downregulation of LRPPRC and its downstream targets. We speculated that the reduced expression of respiratory chain components may be due to the downregulation of LRPPRC. Therefore, we tested whether overexpressing LRPPRC together with APPsw might rescue its impact on mitochondria. Indeed, co-expression of LRPPRC together with APPsw resulted in almost-APPwt expression levels of LRPPRC/SLIRP and reduced the impact on the downstream targets (Figure 6B). To further characterize the relationship of APP, LRPPRC, and expression of respiratory chain components, we analyzed mRNA levels by qRT-PCR (Figure 6C). These data showed that APPsw significantly downregulates mRNA levels of LRPPRC and the respiratory chain member COX1, a primary downstream target of LRPPRC. In summary, these data show that APPsw downregulates expression of LRPPRC and respiratory chain genes, and that the impact of APPsw on respiratory chain proteins can partially be rescued by LRPPRC overexpression.
Finally, in order to test whether these results are relevant for mitochondrial function, we transiently transfected cells with either APP wild-type or APPsw constructs and co-transfected either LRPPRC or a siRNA directed against LRPPRC. We measured aconitase activity as an enzymatic readout for oxidative stress and overall mitochondrial function (Gardner, 2002). Co-expression of LRPPRC increased the aconitase activity in all conditions, while LRPPRC knockdown considerably reduced the enzymatic activity (Figure 6D). This is consistent with the essential role of LRPPRC for mitochondrial function (Ruzzenente et al., 2012). Cells expressing APPsw showed a significant (p < 0.005) decrease in aconitase activity when compared to APP wild-type-expressing cells. Again, LRPPRC co-expression partially restored aconitase activity to almost wild-type levels. These findings suggest that LRPPRC levels might play an important role in APPsw-induced stress phenotypes.
DISCUSSION
The premise of network medicine is that health and disease depends on complex interactions between the different molecular components of human cells (Barabási et al., 2011). Here, we used qAP-MS to obtain the first quantitative PPI network for several protein variants associated with different NDDs. Several observations indicate that our data are of high quality and important for pathogenesis. First, we recovered several known interactions that have been shown to be relevant for NDDs. Second, we confirmed 18 out of 18 novel interactions by co-immunoprecipitation in transiently transfected HEK cells and nine out of nine endogenous interactions in neuroblastoma cells. Third, we find that ~75% of the identified interaction partners for ATXN1 are functionally relevant for neurodegeneration in a fly model, similar to previous observations for HTT (Kaltenbach et al., 2007). Fourth, we observe that interaction partners of APP and PSEN1 are significantly enriched in AD-associated SNPs. Collectively, these findings indicate that our network of mostly novel interactions is a rich and valuable resource for the community and may help us to better understand the molecular mechanisms of NDDs.
Although the high validation rate shows the power of our screen, it is also important to keep the limitations in mind. Most importantly, we analyzed interactions of overexpressed proteins in human cell lines. Although this setup is arguably closer to the in vivo situation than the Y2H system, it cannot recapitulate all relevant processes in human neurons. Moreover, interactions might be lost during affinity purification or could be impaired by the tag. We also cannot rule out that overexpression of a disease-related protein might induce upregulation of specific proteins, which might therefore be misidentified as specific interaction partners.
It has been argued that interaction maps are most informative when they reflect differences between states such as health and disease (Ideker and Sharan, 2008). While the Y2H system and standard AP-MS experiments can, in principle, identify interaction partners of mutant proteins, the non-quantitative nature of these methods makes it difficult to directly assess which interactions are affected by the mutation. We used SILAC-based quantification to directly compare the interactions of wild-type proteins and their disease-associated variants for the first time across several different NDDs. We found that for most proteins, disease-associated mutations affected only a small subset of specific PPIs. We also observed that this subset contains several proteins with a known role in pathogenesis. This suggests that differential binding partners may indeed be particularly informative for disease mechanisms.
Mitochondrial dysfunction is one of the earliest markers of AD (Querfurth and LaFerla, 2010). While the role of Aβ in this process is well established, our finding that the mitochondrial matrix protein LRPPRC interacts with APP provides evidence that mitochondria-associated APP might also play a role. It has been shown that full-length APP associates with mitochondrial membranes in an N (in mitochondria) to C (out cytoplasm) orientation (Devi et al., 2006). We find that an N-terminal fragment of APP is required for the interaction with LRPPRC, suggesting that the interaction occurs via the matrix-exposed N terminus. It is not yet clear how the Swedish mutation in the C terminus can affect the interaction of the N terminus with LRPPRC. One possibility is that the mutation enhances mitochondrial import and thus the amount of APP accessible for the interaction. LRPPRC is a central regulator of mitochondrial gene expression required for the coordinated translation of mitochondrial mRNAs (Ruzzenente et al., 2012). It is intriguing that mutations in LRPPRC cause neurodegeneration in LSFC (Mootha et al., 2003). We therefore speculate that binding of APPsw to LRPPRC impairs mitochondrial gene expression (Figure 7). The Swedish mutation enhances both Aβ production and binding to LRPPRC. Thus, it is not straightforward to separate both effects from each other. Our observation that APPsw-induced mitochondrial stress is partially rescued by overexpressing LRPPRC indicates that both factors play a role. Since LRPPRC also associates with endogenous (i.e., wild-type) APP, the interaction may also be relevant for sporadic AD cases and/or for the normal cellular function of APP.
Figure 7. Hypothetical Model for Mitochondrial Impairments Caused by APPsw and LRPPRC.
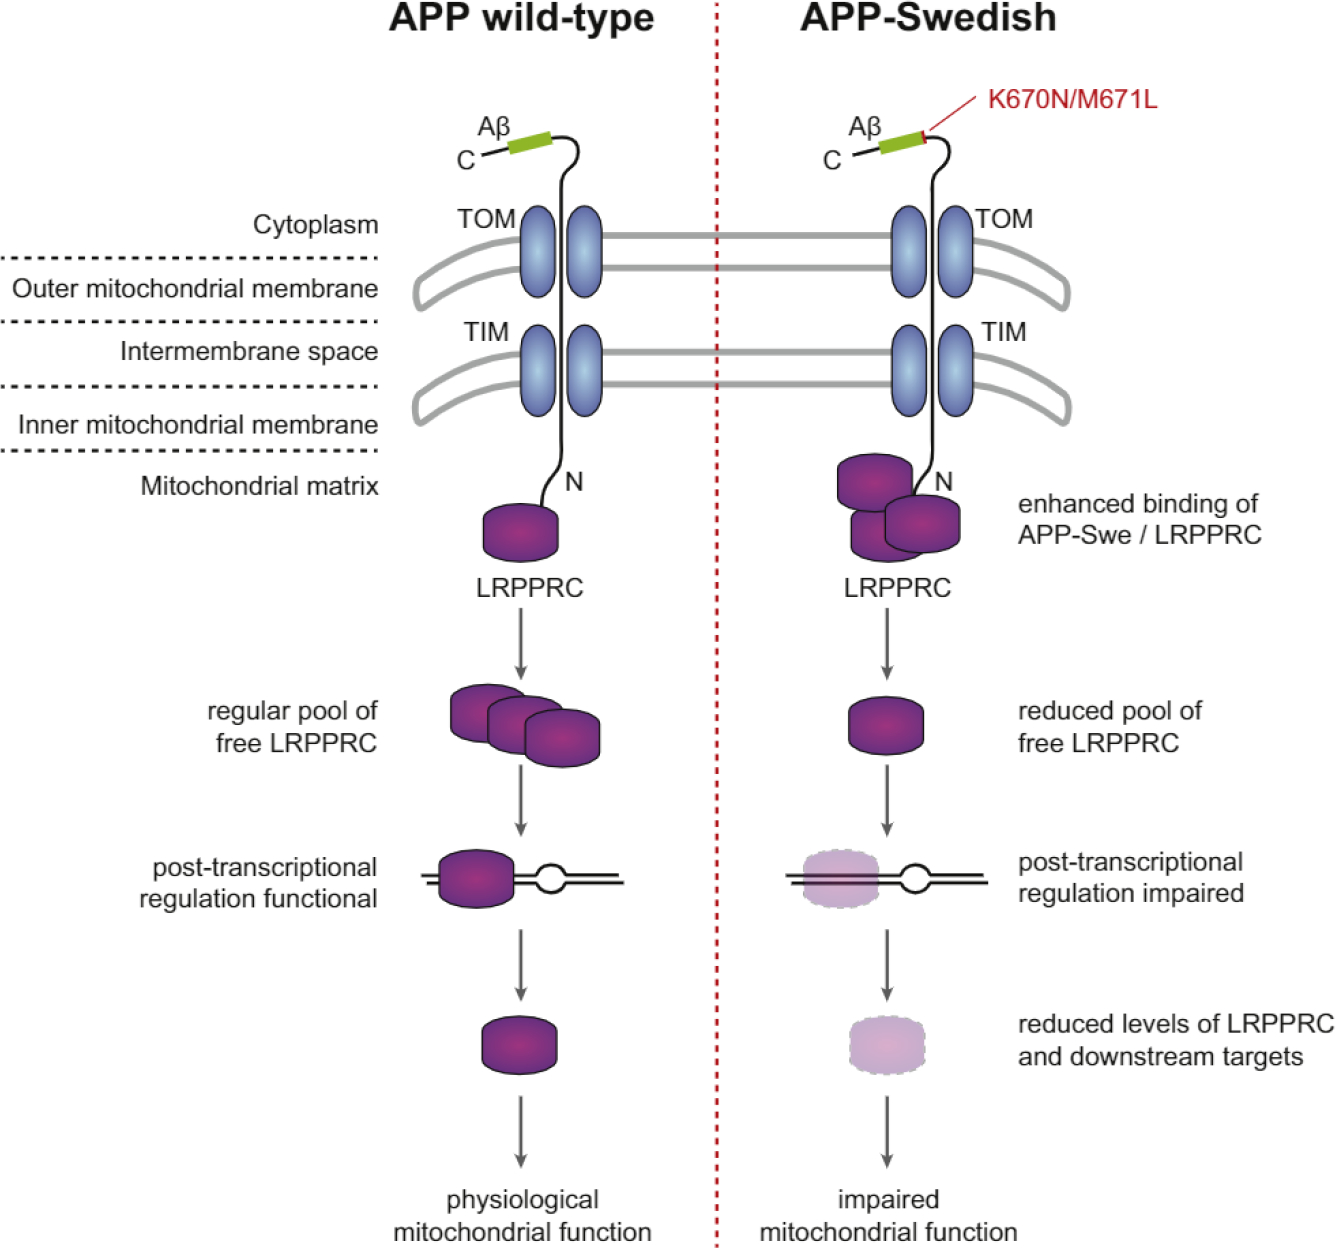
APP associates with mitochondria in an amino-terminus-in/carboxy-terminus-out position. In APP wild-type-expressing cells, LRPPRC interacts with the APP N terminus. The free remaining LRPPRC pool can fulfill its regular function preserving mitochondrial fidelity. In cells expressing APPsw, the pool of free LRPPRC is reduced via its enhanced binding to APPsw. Thus, overall levels of LRPPRC and downstream targets are reduced and impair mitochondrial function.
Genetic linkage analysis has identified many genes related to inherited diseases, and the recent advance of sequencing technologies dramatically accelerated this process. Compared to the pace of disease-gene discovery, their functional characterization is lagging behind. This study shows that quantitative interaction proteomics of disease proteins captures many aspects relevant for pathogenesis. Systematic mapping of changes in PPIs might thus help bridging the gap between identification of disease-associated variants and disease phenotypes. The approach is generic and can thus be applied to other diseases. Eventually, differential interaction proteomics might open new avenues toward individualized therapy.
EXPERIMENTAL PROCEDURES
Cell Culture
Human HEK293T cells were cultured and stable-isotope labeled under standard conditions (see the Supplemental Experimental Procedures). Transient transfections of 15 μg myc-tagged expression vectors were performed with 30 μg polyethylenimine transfection agent per 2 × 10⁷ cells. Cells were lysed in RIPA buffer supplemented with complete protease inhibitor (Roche) and 1% Benzonase (Merck), and cell debris was cleared by centrifugation at 13,000 × g for 10 min.
Pull-Down Experiments
Immunoprecipitations of myc-tagged bait proteins were performed using the μMACS c-myc isolation Kit (Miltenyi Biotec) according to the manufacturer’s instructions. Proteins bound to the beads were eluted with 100 mM glycine (pH 2.5) and ethanol-precipitated overnight at 4°C. Precipitated proteins were processed essentially as described previously (Paul et al., 2011). Co-immunoprecipitations of endogenous proteins were performed by crosslinking specific anti-bait antibodies to NHS-activated Sepharose as described (Paul et al., 2011). Co-precipitates were eluted by boiling in SDS loading buffer and subsequently analyzed by western blotting.
Drosophila Models and Genetic Screen
Flies were raised and maintained at 25°C on standard food. The screening stock was generated by recombination of GMR-GAL4 driver and UAS-ATXN1-Q82 insertion (GMR > ATXN1-Q82). Screening itself was essentially conducted as described previously (Vossfeldt et al., 2012).
Reporter Assays
For mitochondrial activity tests, mitochondria were isolated from 104–105 HEK293T cells using the mitochondria isolation kit (Miltenyi Biotec) according to the manufacturer’s instructions. Mitochondrial activity was then assessed by determining the mitochondrial aconitase activity (Aconitase Activity Assay Kit, Merck) according to the manufacturer’s instructions. Values were normalized to the mitochondrial protein concentration.
Liquid Chromatography Tandem Mass Spectrometry Analysis
Pull-down samples were measured on LTQ-Orbitrap or LTQ-Orbitrap XL mass spectrometers and whole-proteome experiments on LTQ-Orbitrap Velos machines. Raw mass spectrometric data were analyzed using the MaxQuant software environment (Cox and Mann, 2008). See the Supplemental Experimental Procedures for details.
GWAS Enrichment Analysis
Cohort data were acquired from two large GWASs with 753/736 cases/controls (GenADA; Li et al., 2008) and 3,941/7,848 cases/controls (GERAD; Harold et al., 2009). Genomic coordinates of all genes were obtained from BioMart (Ensembl release 54). SNP coordinates (NCBI36 assembly) and association summary statistics of the GenADA study were obtained from dbGAP (accession number phs000219v1). The same data structure for the GERAD study was kindly provided by the authors. For each bait protein SNP, sets were defined that comprise all SNPs that are located within a distance of 100 kb of any gene whose protein interacts with the corresponding bait protein. A one-sided Wilcoxon-Mann-Whitney test was applied in order to detect differences of the means of the distribution of GWAS p values within a SNP set compared to the global distribution of p values (Heinig et al., 2010). Combined p values were computed using Fisher’s method.
Supplementary Material
Highlights.
Quantitative interactomics of proteins involved in four neurodegenerative diseases
Differential interaction mapping of wild-type and disease-associated proteins
Interaction partners are significantly linked to disease phenotypes in vivo
Interaction of APP and LRPPRC appears to induce mitochondrial dysfunction in AD
ACKNOWLEDGMENTS
We would like to thank Christian Sommer, Katja Neugebauer, and Teija Inkinen for excellent technical assistance and Kathrin Saar for help with the dbGaP access. We gratefully acknowledge the kind gift of the ATXN1 fly strains from the Juan Botas lab (Baylor College of Medicine). GWAS data acknowledgements can be found in the Supplemental Information. The research leading to these results has received funding from the NGNF-plus network NeuroNet (BMBF) and the Cross-Program Initiative Personalized Medicine (iMed) of the Helmholtz Association. Data used in the preparation of this article were obtained from the Genetic and Environmental Risk for Alzheimer’s Disease (GERAD1) Consortium. As such, the investigators within the GERAD1 consortium provided data but did not participate in analysis or writing of this report. A full list of GERAD1 investigators can be found in the Supplemental Information.
Footnotes
SUPPLEMENTAL INFORMATION
Supplemental Information includes Supplemental Experimental Procedures, seven figures, and three tables and can be found with this article online at http://dx.doi.org/10.1016/j.celrep.2015.04.030.
REFERENCES
- Anandatheerthavarada HK, Biswas G, Robin MA, and Avadhani NG (2003). Mitochondrial targeting and a novel transmembrane arrest of Alzheimer’s amyloid precursor protein impairs mitochondrial function in neuronal cells. J. Cell Biol. 161, 41–54. [DOI] [PMC free article] [PubMed] [Google Scholar]
- Barabási AL, Gulbahce N, and Loscalzo J (2011). Network medicine: a network-based approach to human disease. Nat. Rev. Genet. 12, 56–68. [DOI] [PMC free article] [PubMed] [Google Scholar]
- Chatterjee S, Sang TK, Lawless GM, and Jackson GR (2009). Dissociation of tau toxicity and phosphorylation: role of GSK-3beta, MARK and Cdk5 in a Drosophila model. Hum. Mol. Genet. 18, 164–177. [DOI] [PMC free article] [PubMed] [Google Scholar]
- Chen HK, Fernandez-Funez P, Acevedo SF, Lam YC, Kaytor MD, Fernandez MH, Aitken A, Skoulakis EM, Orr HT, Botas J, and Zoghbi HY (2003). Interaction of Akt-phosphorylated ataxin-1 with 14–3-3 mediates neurodegeneration in spinocerebellar ataxia type 1. Cell 113, 457–468. [DOI] [PubMed] [Google Scholar]
- Choi JY, Ryu JH, Kim HS, Park SG, Bae KH, Kang S, Myung PK, Cho S, Park BC, and Lee H (2007). Co-chaperone CHIP promotes aggregation of ataxin-1. Mol. Cell. Neurosci. 34, 69–79. [DOI] [PubMed] [Google Scholar]
- Chung MY, Ranum LP, Duvick LA, Servadio A, Zoghbi HY, and Orr HT (1993). Evidence for a mechanism predisposing to intergenerational CAG repeat instability in spinocerebellar ataxia type I. Nat. Genet. 5, 254–258. [DOI] [PubMed] [Google Scholar]
- Cox J, and Mann M (2008). MaxQuant enables high peptide identification rates, individualized p.p.b.-range mass accuracies and proteome-wide protein quantification. Nat. Biotechnol. 26, 1367–1372. [DOI] [PubMed] [Google Scholar]
- Crespo-Barreto J, Fryer JD, Shaw CA, Orr HT, and Zoghbi HY (2010). Partial loss of ataxin-1 function contributes to transcriptional dysregulation in spinocerebellar ataxia type 1 pathogenesis. PLoS Genet. 6, e1001021. [DOI] [PMC free article] [PubMed] [Google Scholar]
- Devi L, and Anandatheerthavarada HK (2010). Mitochondrial trafficking of APP and alpha synuclein: Relevance to mitochondrial dysfunction in Alzheimer’s and Parkinson’s diseases. Biochim. Biophys. Acta 1802, 11–19. [DOI] [PMC free article] [PubMed] [Google Scholar]
- Devi L, Prabhu BM, Galati DF, Avadhani NG, and Anandatheerthavarada HK (2006). Accumulation of amyloid precursor protein in the mitochondrial import channels of human Alzheimer’s disease brain is associated with mitochondrial dysfunction. J. Neurosci. 26, 9057–9068. [DOI] [PMC free article] [PubMed] [Google Scholar]
- Dietzl G, Chen D, Schnorrer F, Su KC, Barinova Y, Fellner M, Gasser B, Kinsey K, Oppel S, Scheiblauer S, et al. (2007). A genome-wide transgenic RNAi library for conditional gene inactivation in Drosophila. Nature 448, 151–156. [DOI] [PubMed] [Google Scholar]
- Emamian ES, Kaytor MD, Duvick LA, Zu T, Tousey SK, Zoghbi HY, Clark HB, and Orr HT (2003). Serine 776 of ataxin-1 is critical for polyglutamine-induced disease in SCA1 transgenic mice. Neuron 38, 375–387. [DOI] [PubMed] [Google Scholar]
- Estojak J, Brent R, and Golemis EA (1995). Correlation of two-hybrid affinity data with in vitro measurements. Mol. Cell. Biol. 15, 5820–5829. [DOI] [PMC free article] [PubMed] [Google Scholar]
- Ewing RM, Chu P, Elisma F, Li H, Taylor P, Climie S, McBroom-Cerajewski L, Robinson MD, O’Connor L, Li M, et al. (2007). Large-scale mapping of human protein-protein interactions by mass spectrometry. Mol. Syst. Biol. 3, 89. [DOI] [PMC free article] [PubMed] [Google Scholar]
- Fernandez-Funez P, Nino-Rosales ML, de Gouyon B, She WC, Luchak JM, Martinez P, Turiegano E, Benito J, Capovilla M, Skinner PJ, et al. (2000). Identification of genes that modify ataxin-1-induced neurodegeneration. Nature 408, 101–106. [DOI] [PubMed] [Google Scholar]
- Gardner PR (2002). Aconitase: sensitive target and measure of superoxide. Methods Enzymol. 349, 9–23. [DOI] [PubMed] [Google Scholar]
- Gingras AC, and Raught B (2012). Beyond hairballs: The use of quantitative mass spectrometry data to understand protein-protein interactions. FEBS Lett. 586, 2723–2731. [DOI] [PMC free article] [PubMed] [Google Scholar]
- Gingras AC, Gstaiger M, Raught B, and Aebersold R (2007). Analysis of protein complexes using mass spectrometry. Nat. Rev. Mol. Cell Biol. 8, 645–654. [DOI] [PubMed] [Google Scholar]
- Gohil VM, Nilsson R, Belcher-Timme CA, Luo B, Root DE, and Mootha VK (2010). Mitochondrial and nuclear genomic responses to loss of LRPPRC expression. J. Biol. Chem. 285, 13742–13747. [DOI] [PMC free article] [PubMed] [Google Scholar]
- Guruharsha KG, Rual JF, Zhai B, Mintseris J, Vaidya P, Vaidya N, Beekman C, Wong C, Rhee DY, Cenaj O, et al. (2011). A protein complex network of Drosophila melanogaster. Cell 147, 690–703. [DOI] [PMC free article] [PubMed] [Google Scholar]
- Harold D, Abraham R, Hollingworth P, Sims R, Gerrish A, Hamshere ML, Pahwa JS, Moskvina V, Dowzell K, Williams A, et al. (2009). Genome-wide association study identifies variants at CLU and PICALM associated with Alzheimer’s disease. Nat. Genet. 41, 1088–1093. [DOI] [PMC free article] [PubMed] [Google Scholar]
- Heinig M, Petretto E, Wallace C, Bottolo L, Rotival M, Lu H, Li Y, Sarwar R, Langley SR, Bauerfeind A, et al. ; Cardiogenics Consortium (2010). A trans-acting locus regulates an anti-viral expression network and type 1 diabetes risk. Nature 467, 460–464. [DOI] [PMC free article] [PubMed] [Google Scholar]
- Hirabayashi M, Inoue K, Tanaka K, Nakadate K, Ohsawa Y, Kamei Y, Popiel AH, Sinohara A, Iwamatsu A, Kimura Y, et al. (2001). VCP/p97 in abnormal protein aggregates, cytoplasmic vacuoles, and cell death, phenotypes relevant to neurodegeneration. Cell Death Differ. 8, 977–984. [DOI] [PubMed] [Google Scholar]
- Holden M, Deng S, Wojnowski L, and Kulle B (2008). GSEA-SNP: applying gene set enrichment analysis to SNP data from genome-wide association studies. Bioinformatics 24, 2784–2785. [DOI] [PubMed] [Google Scholar]
- Ideker T, and Sharan R (2008). Protein networks in disease. Genome Res. 18, 644–652. [DOI] [PMC free article] [PubMed] [Google Scholar]
- Imai Y, Soda M, Murakami T, Shoji M, Abe K, and Takahashi R (2003). A product of the human gene adjacent to parkin is a component of Lewy bodies and suppresses Pael receptor-induced cell death. J. Biol. Chem. 278, 51901–51910. [DOI] [PubMed] [Google Scholar]
- Kaltenbach LS, Romero E, Becklin RR, Chettier R, Bell R, Phansalkar A, Strand A, Torcassi C, Savage J, Hurlburt A, et al. (2007). Huntingtin interacting proteins are genetic modifiers of neurodegeneration. PLoS Genet. 3, e82. [DOI] [PMC free article] [PubMed] [Google Scholar]
- Keil U, Bonert A, Marques CA, Scherping I, Weyermann J, Strosznajder JB, Müller-Spahn F, Haass C, Czech C, Pradier L, et al. (2004). Amyloid beta-induced changes in nitric oxide production and mitochondrial activity lead to apoptosis. J. Biol. Chem. 279, 50310–50320. [DOI] [PubMed] [Google Scholar]
- Kimberly WT, LaVoie MJ, Ostaszewski BL, Ye W, Wolfe MS, and Selkoe DJ (2002). Complex N-linked glycosylated nicastrin associates with active gamma-secretase and undergoes tight cellular regulation. J. Biol. Chem. 277, 35113–35117. [DOI] [PubMed] [Google Scholar]
- Lam YC, Bowman AB, Jafar-Nejad P, Lim J, Richman R, Fryer JD, Hyun ED, Duvick LA, Orr HT, Botas J, and Zoghbi HY (2006). ATAXIN-1 interacts with the repressor Capicua in its native complex to cause SCA1 neuropathology. Cell 127, 1335–1347. [DOI] [PubMed] [Google Scholar]
- Lee JH, Yu WH, Kumar A, Lee S, Mohan PS, Peterhoff CM, Wolfe DM, Martinez-Vicente M, Massey AC, Sovak G, et al. (2010). Lysosomal proteolysis and autophagy require presenilin 1 and are disrupted by Alzheimer-related PS1 mutations. Cell 141, 1146–1158. [DOI] [PMC free article] [PubMed] [Google Scholar]
- Li H, Wetten S, Li L, St Jean PL, Upmanyu R, Surh L, Hosford D, Barnes MR, Briley JD, Borrie M, et al. (2008). Candidate single-nucleotide polymorphisms from a genomewide association study of Alzheimer disease. Arch. Neurol. 65, 45–53. [DOI] [PubMed] [Google Scholar]
- Lim J, Crespo-Barreto J, Jafar-Nejad P, Bowman AB, Richman R, Hill DE, Orr HT, and Zoghbi HY (2008). Opposing effects of polyglutamine expansion on native protein complexes contribute to SCA1. Nature 452, 713–718. [DOI] [PMC free article] [PubMed] [Google Scholar]
- Lin MT, and Beal MF (2006). Alzheimer’s APP mangles mitochondria. Nat. Med. 12, 1241–1243. [DOI] [PubMed] [Google Scholar]
- Lin MK, and Farrer MJ (2014). Genetics and genomics of Parkinson’s disease. Genome Med. 6, 48. [DOI] [PMC free article] [PubMed] [Google Scholar]
- Lundby A, Rossin EJ, Steffensen AB, Acha MR, Newton-Cheh C, Pfeufer A, Lynch SN, Olesen SP, Brunak S, Ellinor PT, et al. ; QT Interval International GWAS Consortium (QT-IGC) (2014). Annotation of loci from genome-wide association studies using tissue-specific quantitative interaction proteomics. Nat. Methods 11, 868–874. [DOI] [PMC free article] [PubMed] [Google Scholar]
- Malovannaya A, Lanz RB, Jung SY, Bulynko Y, Le NT, Chan DW, Ding C, Shi Y, Yucer N, Krenciute G, et al. (2011). Analysis of the human endogenous coregulator complexome. Cell 145, 787–799. [DOI] [PMC free article] [PubMed] [Google Scholar]
- Marques CA, Keil U, Bonert A, Steiner B, Haass C, Muller WE, and Eckert A (2003). Neurotoxic mechanisms caused by the Alzheimer’s disease-linked Swedish amyloid precursor protein mutation: oxidative stress, caspases, and the JNK pathway. J. Biol. Chem. 278, 28294–28302. [DOI] [PubMed] [Google Scholar]
- Mootha VK, Lepage P, Miller K, Bunkenborg J, Reich M, Hjerrild M, Delmonte T, Villeneuve A, Sladek R, Xu F, et al. (2003). Identification of a gene causing human cytochrome c oxidase deficiency by integrative genomics. Proc. Natl. Acad. Sci. USA 100, 605–610. [DOI] [PMC free article] [PubMed] [Google Scholar]
- Park HJ, Kim SS, Seong YM, Kim KH, Goo HG, Yoon EJ, Min S, Kang S, and Rhim H (2006). Beta-amyloid precursor protein is a direct cleavage target of HtrA2 serine protease. Implications for the physiological function of HtrA2 in the mitochondria. J. Biol. Chem. 281, 34277–34287. [DOI] [PubMed] [Google Scholar]
- Paul FE, Hosp F, and Selbach M (2011). Analyzing protein-protein interactions by quantitative mass spectrometry. Methods 54, 387–395. [DOI] [PubMed] [Google Scholar]
- Querfurth HW, and LaFerla FM (2010). Alzheimer’s disease. N. Engl. J. Med. 362, 329–344. [DOI] [PubMed] [Google Scholar]
- Rinner O, Mueller LN, Hubálek M, Müller M, Gstaiger M, and Aebersold R (2007). An integrated mass spectrometric and computational framework for the analysis of protein interaction networks. Nat. Biotechnol. 25, 345–352. [DOI] [PubMed] [Google Scholar]
- Ross CA, and Poirier MA (2004). Protein aggregation and neurodegenerative disease. Nat. Med. 10 (Suppl), S10–S17. [DOI] [PubMed] [Google Scholar]
- Rossin EJ, Lage K, Raychaudhuri S, Xavier RJ, Tatar D, Benita Y, Cotsapas C, and Daly MJ; International Inflammatory Bowel Disease Genetics Constortium (2011). Proteins encoded in genomic regions associated with immune-mediated disease physically interact and suggest underlying biology. PLoS Genet 7, e1001273. [DOI] [PMC free article] [PubMed] [Google Scholar]
- Rual JF, Venkatesan K, Hao T, Hirozane-Kishikawa T, Dricot A, Li N, Berriz GF, Gibbons FD, Dreze M, Ayivi-Guedehoussou N, et al. (2005). Towards a proteome-scale map of the human protein-protein interaction network. Nature 437, 1173–1178. [DOI] [PubMed] [Google Scholar]
- Rubinsztein DC, Leggo J, Coles R, Almqvist E, Biancalana V, Cassiman JJ, Chotai K, Connarty M, Crauford D, Curtis A, et al. (1996). Phenotypic characterization of individuals with 30–40 CAG repeats in the Huntington disease (HD) gene reveals HD cases with 36 repeats and apparently normal elderly individuals with 36–39 repeats. Am. J. Hum. Genet. 59, 16–22. [PMC free article] [PubMed] [Google Scholar]
- Ruzzenente B, Metodiev MD, Wredenberg A, Bratic A, Park CB, Cámara Y, Milenkovic D, Zickermann V, Wibom R, Hultenby K, et al. (2012). LRPPRC is necessary for polyadenylation and coordination of translation of mitochondrial mRNAs. EMBO J. 31, 443–456. [DOI] [PMC free article] [PubMed] [Google Scholar]
- Sasarman F, Brunel-Guitton C, Antonicka H, Wai T, and Shoubridge EA; LSFC Consortium (2010). LRPPRC and SLIRP interact in a ribonucleoprotein complex that regulates posttranscriptional gene expression in mitochondria. Mol. Biol. Cell 21, 1315–1323. [DOI] [PMC free article] [PubMed] [Google Scholar]
- Schuster-Böckler B, and Bateman A (2008). Protein interactions in human genetic diseases. Genome Biol. 9, R9. [DOI] [PMC free article] [PubMed] [Google Scholar]
- Söderberg O, Gullberg M, Jarvius M, Ridderstråle K, Leuchowius KJ, Jarvius J, Wester K, Hydbring P, Bahram F, Larsson LG, and Landegren U (2006). Direct observation of individual endogenous protein complexes in situ by proximity ligation. Nat. Methods 3, 995–1000. [DOI] [PubMed] [Google Scholar]
- Stelzl U, Worm U, Lalowski M, Haenig C, Brembeck FH, Goehler H, Stroedicke M, Zenkner M, Schoenherr A, Koeppen S, et al. (2005). A human protein-protein interaction network: a resource for annotating the proteome. Cell 122, 957–968. [DOI] [PubMed] [Google Scholar]
- Sterky FH, Ruzzenente B, Gustafsson CM, Samuelsson T, and Larsson NG (2010). LRPPRC is a mitochondrial matrix protein that is conserved in metazoans. Biochem. Biophys. Res. Commun. 398, 759–764. [DOI] [PubMed] [Google Scholar]
- Tanzi RE, and Bertram L (2005). Twenty years of the Alzheimer’s disease amyloid hypothesis: a genetic perspective. Cell 120, 545–555. [DOI] [PubMed] [Google Scholar]
- Vermeulen M, Hubner NC, and Mann M (2008). High confidence determination of specific protein-protein interactions using quantitative mass spectrometry. Curr. Opin. Biotechnol. 19, 331–337. [DOI] [PubMed] [Google Scholar]
- Vidal M, Cusick ME, and Barabási AL (2011). Interactome networks and human disease. Cell 144, 986–998. [DOI] [PMC free article] [PubMed] [Google Scholar]
- Vossfeldt H, Butzlaff M, PrüSSing K, NÍ Chárthaigh RA, Karsten P, Lankes A, Hamm S, Simons M, Adryan B, Schulz JB, and Voigt A (2012). Large-scale screen for modifiers of ataxin-3-derived polyglutamine-induced toxicity in Drosophila. PLoS ONE 7, e47452. [DOI] [PMC free article] [PubMed] [Google Scholar]
- Wepf A, Glatter T, Schmidt A, Aebersold R, and Gstaiger M (2009). Quantitative interaction proteomics using mass spectrometry. Nat. Methods 6, 203–205. [DOI] [PubMed] [Google Scholar]
- Williams AJ, and Paulson HL (2008). Polyglutamine neurodegeneration: protein misfolding revisited. Trends Neurosci. 31, 521–528. [DOI] [PMC free article] [PubMed] [Google Scholar]
- Yang DS, Tandon A, Chen F, Yu G, Yu H, Arawaka S, Hasegawa H, Duthie M, Schmidt SD, Ramabhadran TV, et al. (2002). Mature glycosylation and trafficking of nicastrin modulate its binding to presenilins. J. Biol. Chem. 277, 28135–28142. [DOI] [PubMed] [Google Scholar]
- Zhong Q, Simonis N, Li QR, Charloteaux B, Heuze F, Klitgord N, Tam S, Yu H, Venkatesan K, Mou D, et al. (2009). Edgetic perturbation models of human inherited disorders. Mol. Syst. Biol. 5, 321. [DOI] [PMC free article] [PubMed] [Google Scholar]
Associated Data
This section collects any data citations, data availability statements, or supplementary materials included in this article.