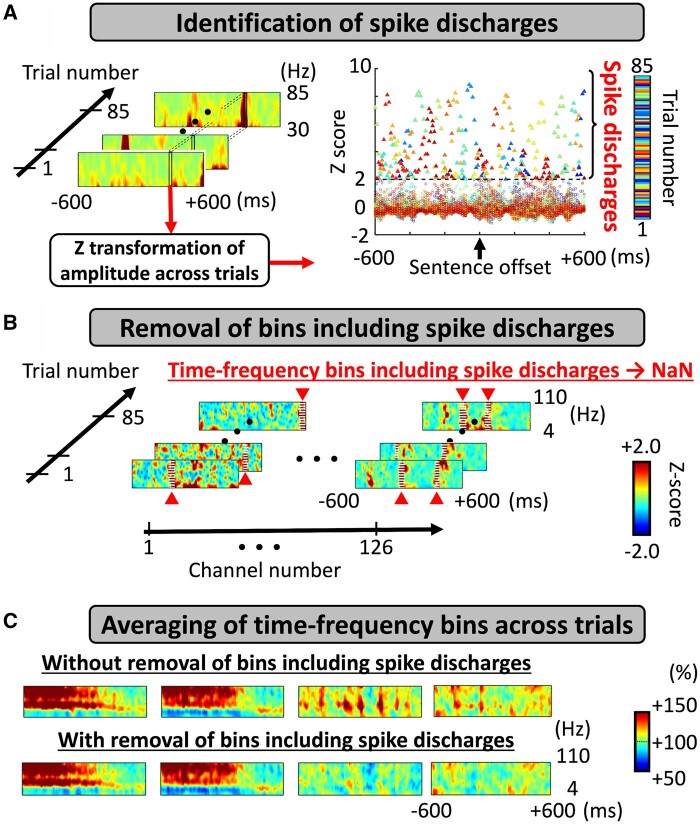
Figure 3.
Preprocessing to remove pathological components from time-frequency analysis. (A) Identification of randomly occurring spike discharges. We identified within-trial time-frequency bins showing a broadband (30–85 Hz) amplitude >2 SD from the across-trial mean (i.e. z-score of >2).45,46 (B) Removal of bins including spike discharges. We treated such time-frequency bins including an excessive broadband amplitude as missing values (i.e. NaN: Not a Number). (C) Averaging of time-frequency bins across trials. We computed the averaged amplitude modulations (i.e. percentage change) as compared to that during the 400-ms baseline period prior to the stimulus onset.39 Here, the time-frequency matrices present auditory naming-related spectral responses time-locked to stimulus offset at four electrode sites. Top: Across-trial averaged data before bins including spike discharges excluded; several matrices exhibit episodes of brief broadband augmentation attributed to randomly occurring spike discharges. Bottom: Across-trial averaged data after excluding bins with spike discharges. In the present study, we adopted the time-frequency data presented in the lower row. Amplitude scale: 100% indicates no change in amplitude compared to the baseline, whereas 110 and 90% indicate 10% increase and decrease, respectively.

