Figure 6.
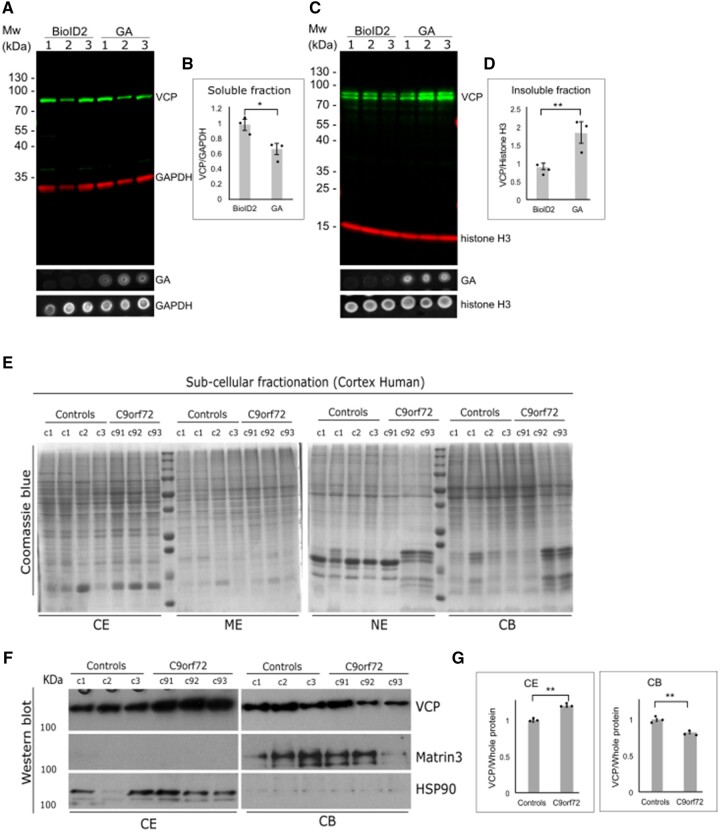
PolyGA sequesters VCP into GA aggregates. (A) HEK293 cells were transfected with BioID or polyGA, incubated for 24 h, and then the soluble fraction was extracted. Representative immunoblotting with anti-VCP antibodies (green) and anti-GAPDH antibodies (loading control; red). The dot blot shows expression level of polyGA in soluble fraction. (B) Quantification of immunoblotting as in A. Data are means ± SEM (n = 3 biological repeats). *P ˂ 0.05 (unpaired t-test). (C) HEK293 cells were transfected with BioID or polyGA, incubated for 24 h, and then the insoluble fraction was extracted. Immunoblotting with anti-VCP antibodies (green) and anti-histone H3 antibodies (loading control; red). The dot blot shows expression level of polyGA in insoluble fraction. (D) Quantification of immunoblotting as in C. Data are means ± SEM (n = 3 biological repeats). **P ˂ 0.01 (unpaired t-test). (E) Fractionation of brain tissue of three control samples (control) and three samples from C9orf72 patients (C9). The Coomassie blue gels show loading of total proteins. (F) Immunoblotting shows the amounts of VCP in the cytoplasmic extract (CE) and chromatin-bound extract (CB) fractions. MATR3 and HSP90 represent fractionation control for chromatin-bound and cytoplasmic extracts, respectively. (G) Quantification of immunoblotting as in F, normalized for total protein. Data are means ± SEM (n = 3 normal control and n = 3 C9orf72 ALS-FTD). **P ˂ 0.001 (unpaired t-test). ME = membrane extract; NE = nuclear extract.

