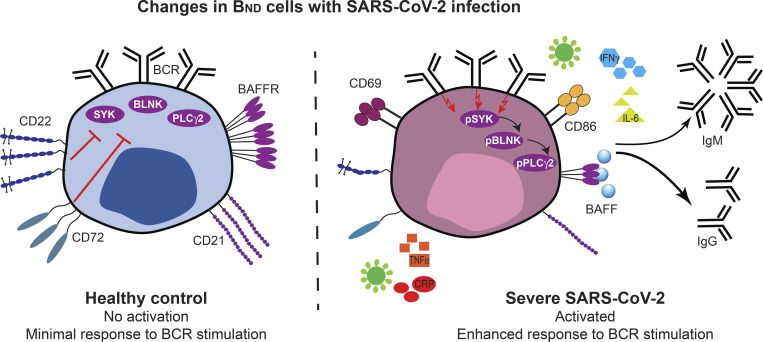
BND cells demonstrate phenotypical and functional changes indicative of a loss of anergy with severe SARS-CoV-2 infection, and these changes correlate with increased systemic inflammation and autoreactive antibodies. Together, this data suggests that viral infection relaxes peripheral B cell tolerance.
Abstract
Severe SARS-CoV-2 infection is associated with strong inflammation and autoantibody production against diverse self-antigens, suggesting a system-wide defect in B cell tolerance. BND cells are a B cell subset in healthy individuals harboring autoreactive but anergic B lymphocytes. In vitro evidence suggests inflammatory stimuli can breach peripheral B cell tolerance in this subset. We asked whether SARS-CoV-2–associated inflammation impairs BND cell peripheral tolerance. To address this, PBMCs and plasma were collected from healthy controls, individuals immunized against SARS-CoV-2, or subjects with convalescent or severe SARS-CoV-2 infection. We demonstrate that BND cells from severely infected individuals are significantly activated, display reduced inhibitory receptor expression, and restored BCR signaling, indicative of a breach in anergy during viral infection, supported by increased levels of autoreactive antibodies. The phenotypic and functional BND cell alterations significantly correlate with increased inflammation in severe SARS-CoV-2 infection. Thus, autoreactive BND cells are released from peripheral tolerance with SARS-CoV-2 infection, likely as a consequence of robust systemic inflammation.
Graphical Abstract
Introduction
Mechanisms of central B cell tolerance prevent the development of naturally arising high-affinity autoreactive B cells in healthy individuals (Wardemann et al., 2004; Meffre, 2011; Meffre and O’Connor, 2019; Pelanda and Torres, 2012; Lang et al., 2016; Nemazee, 2017). Nevertheless, nearly 40% of B cells that emigrate from the bone marrow and 20% of mature naive peripheral B cells in healthy humans are weakly autoreactive (Wardemann et al., 2003). In healthy individuals, peripheral B cell tolerance holds weakly autoreactive B cells in a functionally inert state termed “anergy,” whereby cells are restrained intrinsically and extrinsically from signaling through their B cell antigen receptor (BCR; Yarkoni et al., 2010; Cambier et al., 2007). Anergy is thought to be established when autoreactive naive B cells receive signals through the BCR in response to chronic self-antigen exposure in the absence of a secondary signal from T cells or pathogen-associated molecular patterns (PAMPs; Cambier et al., 2007; Franks and Cambier, 2018). Importantly, anergic B cells are hyporesponsive to antigen stimulation as evidenced by the lack of activation marker expression, nominal protein phosphorylation downstream of the BCR, reduced calcium signaling, and minimal proliferation or differentiation to antibody secreting cells (Franks and Cambier, 2018).
Although the identification of a naturally occurring anergic B cell subset was first shown in mouse models (Merrell et al., 2006; Goodnow et al., 1988; Benschop et al., 2001), human peripheral blood has also been demonstrated to harbor an autoreactive anergic B cell population termed “BND cells” (Duty et al., 2009). BND cells are mature naive B cells that do not express surface IgM but do express surface IgD, make up roughly 2.5% of total B cells, are enriched in autoreactive specificities (Duty et al., 2009), and confirmed to be in an anergic state in healthy humans (Chang et al., 2008; Quách et al., 2011; Smith et al., 2015; Smith et al., 2019; Szodoray et al., 2016). In the context of systemic lupus erythematosus (SLE), BND cells display an activated phenotype (Quách et al., 2011), elevated calcium flux upon BCR crosslinking (Szodoray et al., 2016), and are increased in frequency with the upregulation of co-stimulatory molecules CD80/CD86 (Chang et al., 2008), thereby indicating a reversal of anergy concomitant with autoimmunity. BND cells, which have been demonstrated to encompass naturally occurring insulin-binding B cells in healthy humans, are reduced in the blood of pre-diabetic individuals where it has been considered that they have transitioned to a non-anergic state and contribute to disease onset (possibly through the production of autoreactive antibodies; Smith et al., 2015). A similar reduction of anergic BND cells was observed in recent-onset autoimmune thyroid disease and correlated with the appearance of autoreactive antibodies (Smith et al., 2018). Overall, these reports suggest that BND cells from autoimmune diseases are less tolerized and could be a source of autoreactive antibodies with disease.
Importantly, in mouse models, the removal of self-antigen can reverse B cell anergy (Gauld et al., 2005). Similarly, the anergic state of BND cells in healthy humans was also shown to be reversible in vitro through stimulation with CD40L and IL-4 (mimicking T cell help), and was accompanied by an activated phenotype with enhanced calcium flux upon BCR signaling (Duty et al., 2009; Szodoray et al., 2016). Reversal of BND cell anergy was also demonstrated with exposure to other stimuli such as CpG, IL-2, anti-IgM, or CD40L with IL-21 (Quách et al., 2011). Together these reports experimentally demonstrate that anergy is flexible, especially in relation to the autoreactive BND population.
Given the accumulating evidence that certain inflammatory viral infections are often accompanied by autoantibody production (Koma et al., 2018; Vo et al., 2020; Rivera-Correa and Rodriguez, 2018; Tanay, 2017) and that in vitro immune-stimulatory conditions exist that allow anergy to be overcome in BND cells (Duty et al., 2009; Szodoray et al., 2016; Quách et al., 2011), we considered it possible that SARS-CoV-2 infection and ensuing inflammation promotes the relaxation of anergic autoreactive B cell peripheral tolerance. Indeed, severely infected COVID-19 subjects have increased levels of inflammatory markers IL-6, IL-8, TNFα, and IL-1β in the plasma (Del Valle et al., 2020) and also harbor autoreactive antibodies with specificity to type I IFN, phospholipids, anti-nuclear antigens (ANA), or tissue-specific targets (Bastard et al., 2020; Xiao et al., 2020; Chang et al., 2021; Wang et al., 2021). The wide breadth of autoreactive specificities generated after SARS-CoV-2 infection suggests a system-wide defect in B cell tolerance during viral infection and that the source of autoreactive antibodies is likely from a heterogenous subset of B cells, as could be found in the naturally arising autoreactive BND subset. However, the role and function of BND cells during viral infection needs further investigation.
In this report, we have interrogated peripheral blood mononuclear cells (PBMCs) and plasma from healthy controls, individuals immunized against SARS-CoV-2 infection with mRNA vaccines, and subjects with either convalescent mild or severe SARS-CoV-2 infection. The results of these analyses demonstrate that BND cells from severe SARS-CoV-2 patients have an altered phenotype consisting of an activated state with concomitant loss of survival and inhibitory receptors. We further demonstrate that with severe SARS-CoV-2 infection, BND cells display enhanced BCR signaling, and that plasma from severe patients with SARS-CoV-2 has increased levels of serum autoantibodies and inflammatory cytokines, which correlated with alteration in BND phenotype and function. Together, these data provide strong evidence that peripheral tolerance is relaxed with severe SARS-CoV-2 and likely as a result of the inflammatory cytokines produced during severe viral infection.
Results
Alteration in BND cell phenotype during severe SARS-CoV-2 infection
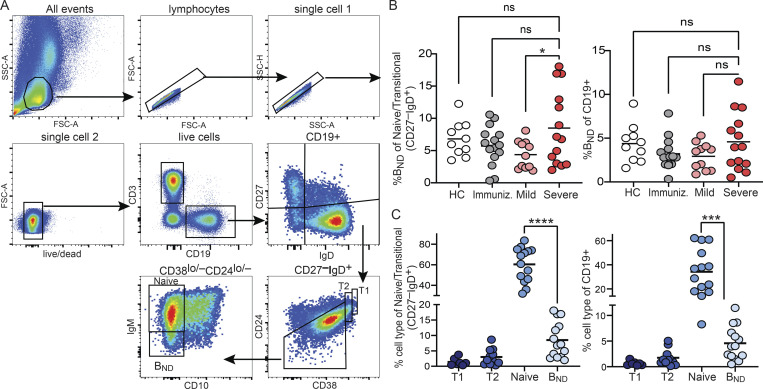
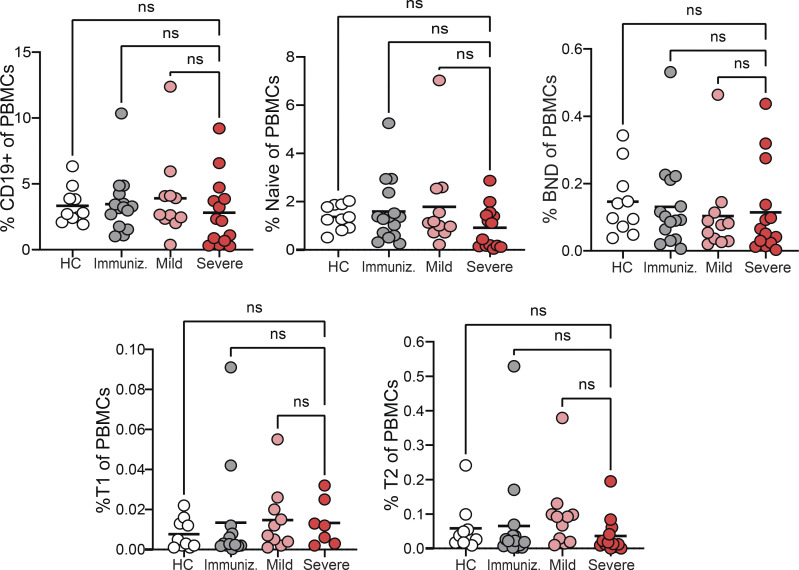
We characterized BND cells in human PBMCs sourced from either healthy controls, subjects immunized with an mRNA vaccine against SARS-CoV-2, subjects recovered from SARS-CoV-2 infection without the need for hospitalization (mild convalescent), or those hospitalized with SARS-CoV-2 infection (severe; Table S1). BND cells were identified using multi-color flow cytometry, as originally described (Duty et al., 2009), as a mature naive population of B cells expressing CD19+ CD27−, with low to negative levels of CD24 and CD38, expressing IgD and low to negative levels of surface IgM (Fig. 1 A). These analyses revealed no differences in the frequency of BND cells in individuals with severe SARS-CoV-2 infection relative to BND cells in healthy controls or immunized individuals within the respective naive/transitional or total B cell populations, although severely infected subjects had a significantly higher frequency of BND cells than the mildly infected within the naive/transitional population (Fig. 1 B). With severe SARS-CoV-2 infection, BND cells were more frequent than transitional T1 or T2 cells, but still less frequent than Naive B cells, both as a percent of naive/transitional populations and as a percent of total B cells (Fig. 1 C; “Naive” is used when referring to a specific population of B cells; “naive” is used when referring to a general population). However, neither total B cell nor BND cell frequencies were altered with severe SARS-CoV-2 infection when considered as a percentage of the combined myeloid and lymphocyte populations in PBMCs (Fig. S1).
Figure 1.
Identification of BND cells in human PBMCs. (A) Gating strategy used to identify BND cells by flow cytometry as lymphocyte single cell live CD3− CD19+ CD27− IgD+ CD24−/lo CD38−/lo CD10− IgM−/lo, shown here from mild SARS-CoV-2 infection. (B) Frequency of BND cells as a percent of the Naive/Transitional (CD27−IgD+) population or as a percent of B cells (CD19+) in healthy controls (HC; n = 10), those immunized (Immuniz.) against SARS-CoV-2 (n = 15), mild (n = 11), or severe SARS-CoV-2 infection (n = 14). (C) Frequency of BND cells from individuals with severe SARS-CoV-2 infection (n = 14) as a percent of the Naive/Transitional (CD27−IgD+) population or as a percent of the B cell (CD19+) population and compared to the frequency of Transitional T1, T2, or Naive B cells. Statistics: one-way ANOVA. *, P < 0.05; ***, P < 0.001; ****, P < 0.0001.
Figure S1.
Proportion of B cells in PBMCs. The proportion of CD19+ total B cells, BND cells, Naive, T1 or T2 B cells were enumerated as a percent of the PBMCs (myeloid and lymphocyte combined populations) from healthy controls (HC; n = 10), those immunized against SARS-CoV-2 (n = 15), or mild (n = 11) or severe infection with SARS-CoV-2 (n = 14). Statistics: one-way ANOVA.
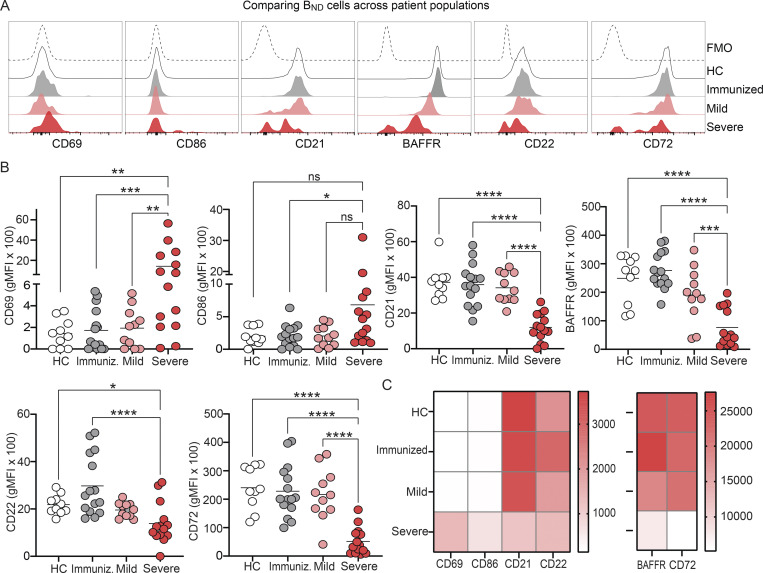
To begin to determine whether BND cells exhibited phenotypic changes indicative of a loss of anergy, these cells were evaluated ex vivo for expression of the activation markers CD69 and CD86, the inhibitory receptors CD22 and CD72, as well as CD21 and BAFFR (Sanz et al., 2019; Rathmell et al., 1998). These results revealed that BND cells from individuals with severe SARS-CoV-2 infection had significantly higher expression of CD69 as compared with BND cells from healthy controls, immunized individuals, or those with mild infection (Fig. 2, A and B). The average expression of CD86 was also higher on BND cells from severe infection when compared with immunized subjects (Fig. 2, A and B). Loss of CD21 expression has been correlated with activation, particularly in autoreactive B cell populations with chronic antigen exposure (Saadoun et al., 2013; Isnardi et al., 2010). Examination of CD21 on BND cells showed a significantly lower level of expression with severe infection as compared with the expression on BND cells from healthy controls, immunized individuals, or those with mild infection (Fig. 2, A and B). Together these data indicate that BND cells display a clearly activated phenotype in severe SARS-CoV-2 infection.
Figure 2.
BND cells become activated and down-regulate survival and inhibitory receptors during severe SARS-CoV-2 infection compared with controls. (A) Representative histograms depicting expression (geometric mean fluorescent intensity; gMFI) of activation markers CD69 and CD86, chronic antigen exposure marker CD21, survival marker BAFFR, or inhibitory markers CD22 and CD72 on BND cells from healthy controls (HC; white histogram), those immunized against SARS-CoV-2 (Immunized; grey histogram), Mild (pink histogram), or Severe SARS-CoV-2 infection (red histogram). The control histogram (dashed line) is an FMO for BND cells from healthy controls. (B) Summary quantification of marker expression for each population of healthy controls (HC; n = 10), those immunized (Immuniz.; n = 15) against SARS-CoV-2, Mild (n = 11), or Severe SARS-CoV-2 infection (n = 14). (C) A heatmap of the average geometric mean fluorescent intensity values for each population. Statistics: one-way ANOVA; *, P < 0.05; **, P < 0.01; ***, P < 0.001; ****, P < 0.0001.
Competition between anergic B cells and other mature naive B cells for the survival cytokine BAFF is dependent on the expression of its cognate receptor BAFFR (Lesley et al., 2004), with anergic B cells expressing lower levels and resulting in a shorter lifespan (Cambier et al., 2007). Surprisingly, BAFFR was significantly down-regulated on BND cells from those with severe SARS-CoV-2 infection when compared with levels expressed on BND cells from healthy controls, immunized subjects, or those with mild infection (Fig 2, A and B). BND cells from mild infection express an intermediate level of BAFFR when compared with the other groups, indicating viral infection, regardless of severity, leads to the down-regulation of this survival marker.
B cell–intrinsic mechanisms that contribute to maintaining anergy include the expression of inhibitory regulators, such as CD22 and CD72 (Smith et al., 1998; Gross et al., 2009; Adachi et al., 2000). Examination of CD22 on BND cells from severe SARS-CoV-2 infected individuals showed significantly lower expression of this inhibitory marker when compared with the expression on BND cells from healthy controls or immunized subjects (Fig. 2, A and B). Similarly, a significantly lower level of CD72 expression was observed on BND cells in individuals with severe infection (Fig. 2, A and B). Both of these stark differences demonstrate a loss of inhibitory regulators on BND cells during severe SARS-CoV-2 infection.
Overall, the above data demonstrate that major phenotypic changes occur in BND cells during severe SARS-CoV-2 infection that includes significantly increased expression of CD69 and CD86, decreased expression of inhibitory receptors CD22 and CD72, as well as decreased expression of CD21 and BAFFR (Fig. 2 C). These phenotypic changes are consistent with cell activation, suggesting loss of the anergic state.
BND cells from severe SARS-CoV-2 infection are a unique population within the naive/transitional B cell compartment
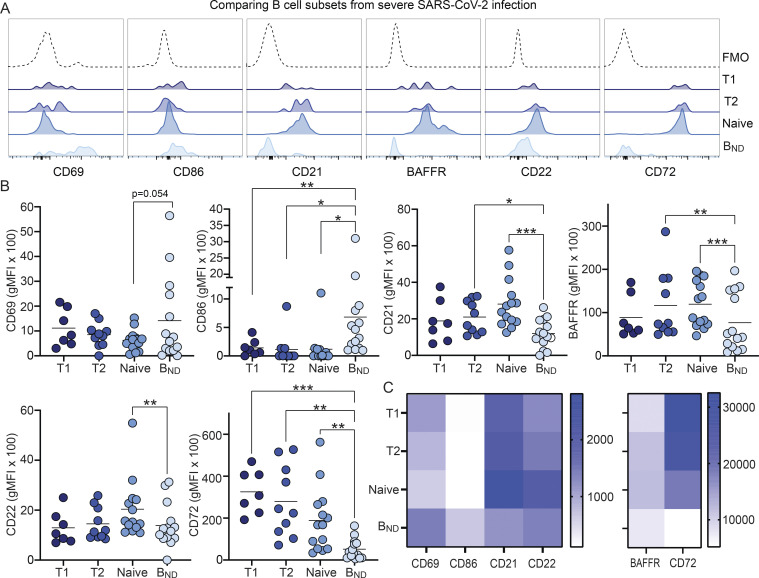
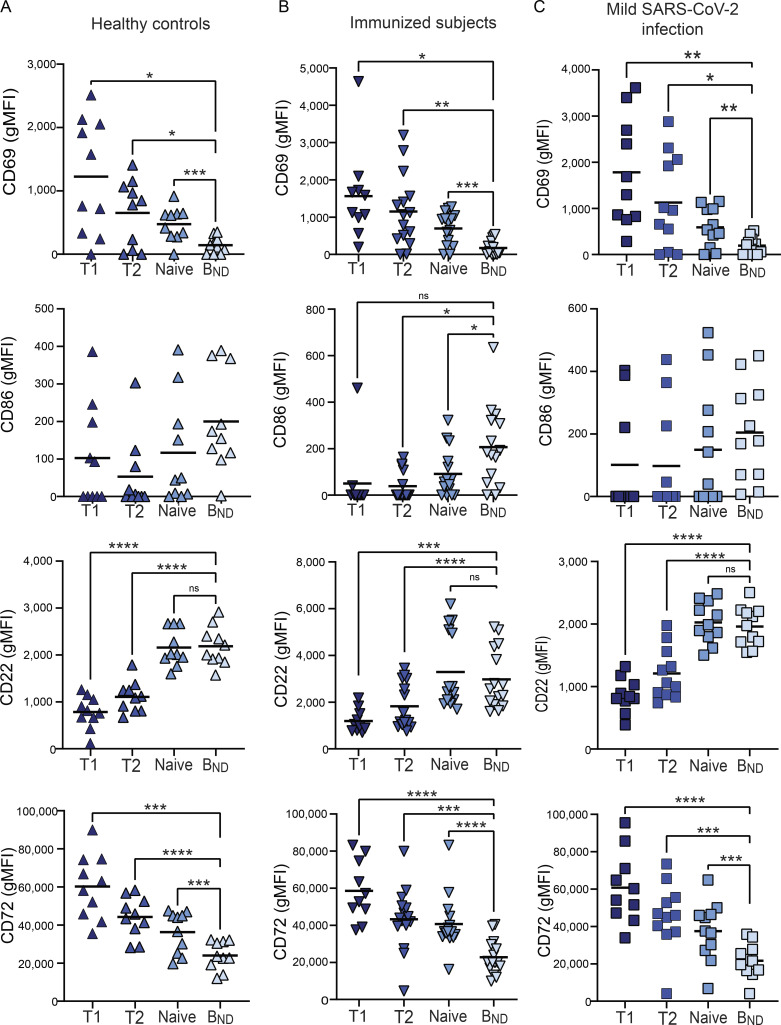
Having observed striking changes in the BND cell phenotype with severe SARS-CoV-2 infection, we next asked if these differences were specific to BND cells or rather reflected a global alteration of expression markers within multiple B cell subsets during severe infection. To address this, BND cells were compared with transitional T1, transitional T2, and mature Naive B cells (expressing IgM) from individuals with severe SARS-CoV-2 infection. BND cells expressed on average a higher level of CD69 than T1, T2, or Naive B cells during SARS-CoV-2 infection (Fig. 3, A and B). This is in contrast to BND cells from healthy controls, immunized subjects, or those mildly infected with SARS-CoV-2, where BND cells have lower levels of expression of CD69 than T1, T2, or Naive B cells (Fig. S2). CD86 was expressed at a significantly higher level on BND cells from severe SARS-CoV-2 infection compared with T1, T2, and Naive B cells (Fig. 3, A and B). A higher expression level of CD86 was also observed on BND cells compared with T2 and Naive B cells from immunized subjects but not from healthy controls or mildly infected subjects (Fig. S2). Furthermore, BND cells from severe SARS-CoV-2 infection displayed significantly lower levels of CD21 than T2 and Naive B cells (Fig. 3, A and B). Together, these data suggest that BND cells are at a heightened level of activation when compared with other subsets in the naive/transitional B cell compartment during severe viral infection. Next, the survival marker BAFFR was examined and found to be expressed at a lower level in BND cells than in T2 or Naive B cells (Fig. 3, A and B), possibly suggesting a reduced dependency of BND cells on BAFF for survival during severe viral infection. Examination of inhibitory receptors CD22 and CD72 within the naive/transitional compartment during severe infection revealed that BND cells have significantly lower expression levels of CD22 than Naive B cells and the average level is lower than T2 cells (Fig. 3, A and B). This is in contrast to comparing BND cells with T1 and T2 B cells from healthy controls, immunized, or mildly infected subjects, whereby, BND cells have higher levels of CD22 expression at a level similar to Naive B cells (Fig. S2). In addition, BND cells have significantly lower levels of CD72 expression during severe viral infection when compared to T1, T2, or Naive B cells (Fig. 3, A and B). However, we further note that CD72 expression is also lower on BND cells than T1, T2, and Naive B cells in healthy controls, immunized, or mildly infected subjects (Fig. S2). Overall, these data indicate that the phenotype associated with BND cells during severe SARS-CoV-2 infection are specific to this subset of autoreactive B cells (Fig. 3 C) within the naive/transitional compartment.
Figure 3.
BND cells are a unique population in severe SARS-CoV-2 infection. (A) Representative histogram expression (geometric mean fluorescent intensity) of CD69, CD86, CD21, BAFFR, CD22, and CD72 on BND cells (light blue) compared with the transitional T1 (dark blue), T2 (royal blue), and Naive (medium blue) B cells from the same severe SARS-CoV-2–infected individual. The control histogram is an FMO for BND cells from healthy controls. (B) Summary quantification of marker expression for each cell type from severe SARS-CoV-2–infected subjects (n = 14). (C) A heatmap of the average geometric mean fluorescent intensity values for each cell type. Statistics: one-way ANOVA; *, P < 0.05; **, P < 0.01; ***, P < 0.001.
Figure S2.
Characterization of BND cells in other patient populations. (A–C) Expression (geometric mean fluorescent intensity) of CD68, CD86, CD22, and CD72 on BND cells ex vivo from healthy controls (n = 10; A), those immunized against SARS-CoV-2 (n = 15; B) or subjects mildly infected with SARS-CoV-2 (n = 11; C). Statistics: one-way ANOVA; *, P < 0.05; **, P < 0.01; ***, P < 0.001; ****, P < 0.0001.
Alteration in BND signaling through the BCR during severe SARS-CoV-2 infection
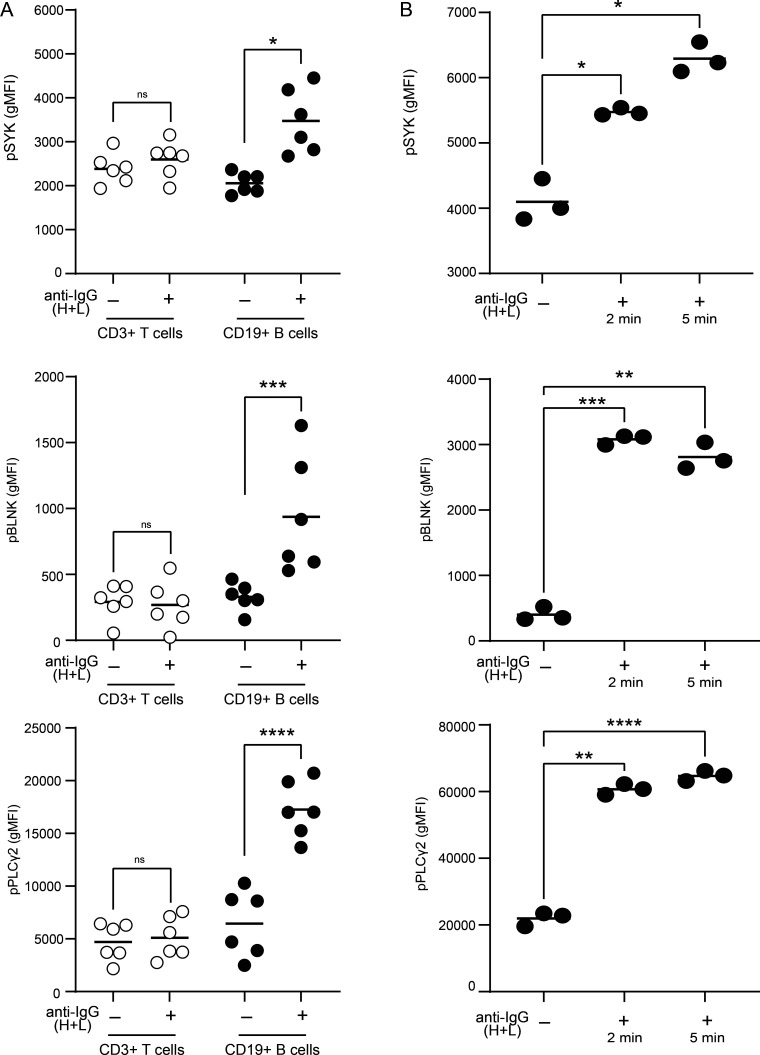
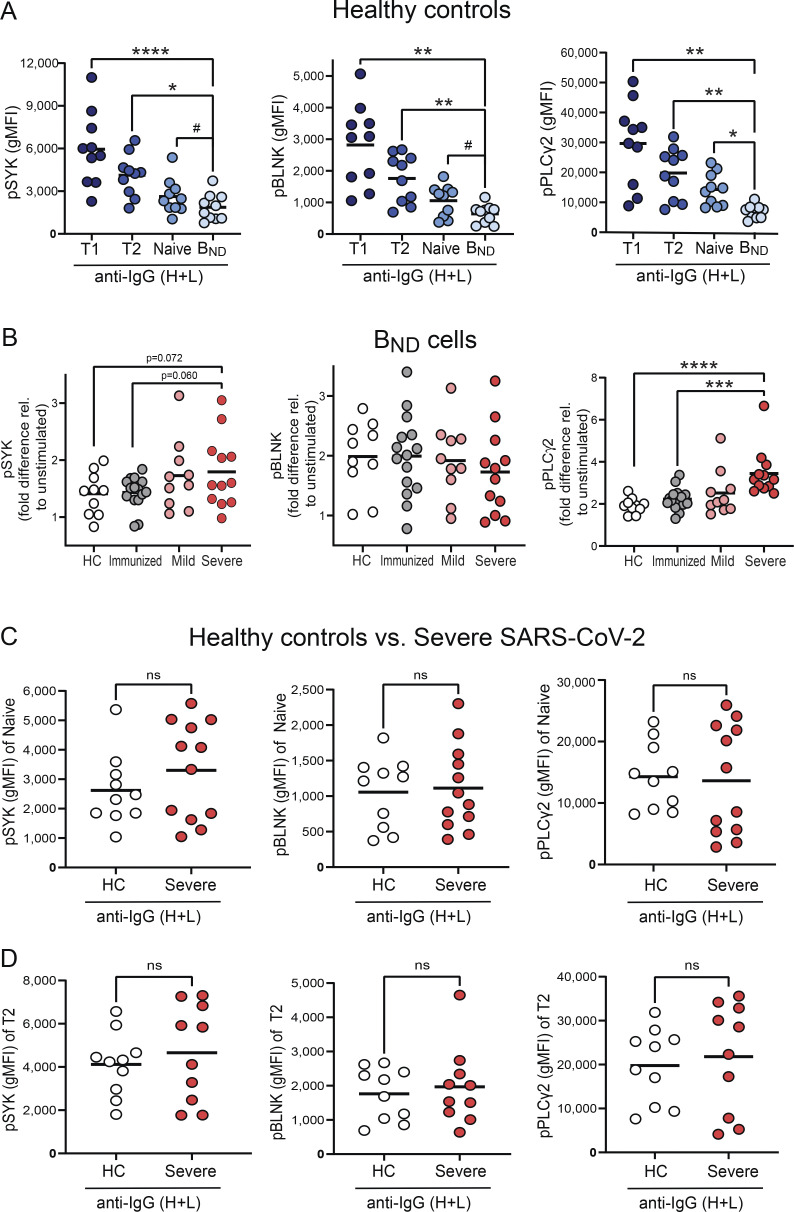
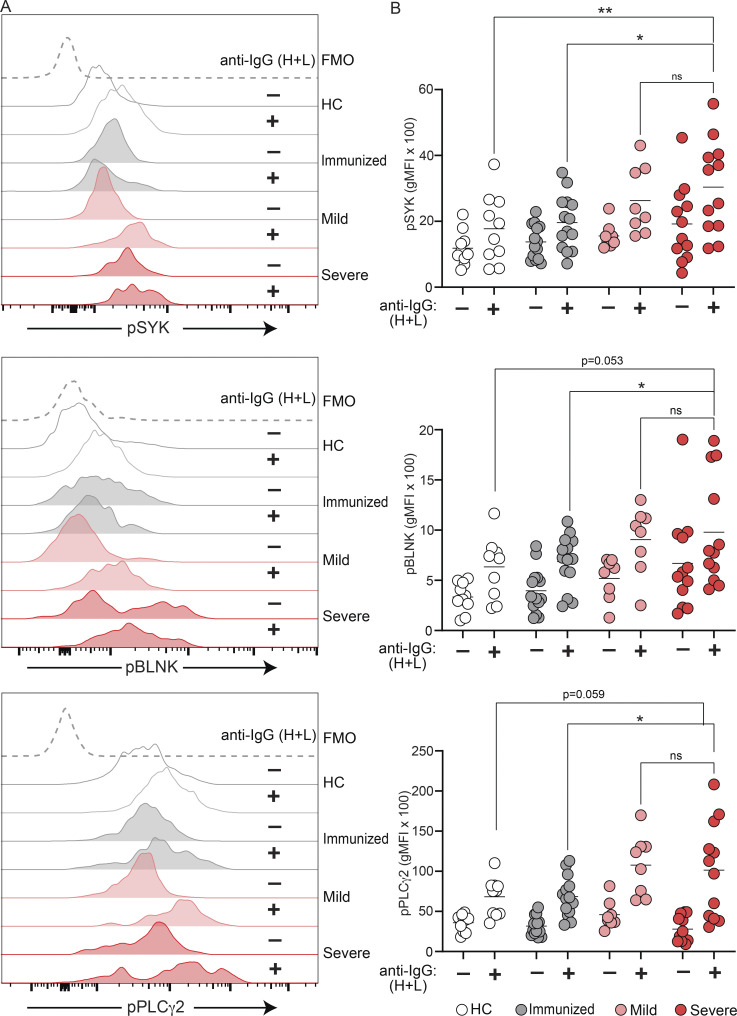
Our data, thus far, demonstrate that BND cells in severe SARS-CoV-2 infection are phenotypically activated and have lost expression of the CD22 and CD72 inhibitory receptors; features that would be consistent with a concomitant loss of anergy in BND cells with severe SARS-CoV-2 infection. We next evaluated whether BND cells in severe SARS-CoV-2 infection also displayed a functional loss of anergy as determined by an ability to transduce signals emanating from the BCR and in contrast to BND cells from healthy individuals. To address this, PBMCs from healthy controls, immunized subjects, or subjects with either mild or severe SARS-CoV-2 infection were stimulated with anti-human Ig to induce BCR crosslinking of all B cell subsets, and the BND cells were subsequently assessed for levels of phospho-SYK, phospho-BLNK, and phospho-PLCγ2 signaling molecules, previously characterized as downstream BCR effector molecules (Packard and Cambier, 2013). Preliminary experiments using PBMCs from healthy controls verified that BCR crosslinking was specific to B cells (Fig. S3 A) and the kinetics of response were rapid (Fig. S3 B). As expected (Duty et al., 2009; Smith et al., 2019; Szodoray et al., 2016), BCR crosslinking of BND cells from healthy controls resulted in minimal phosphorylation of SYK, BLNK, and PLCγ2, which was lower compared to BCR-stimulated Naive, T2, or T1 B cells (Fig. S4 A). Thus, as previously shown, BND cells from healthy humans are functionally anergic with muted responses to BCR stimulation. In contrast, BCR crosslinking of BND cells from individuals with either mild or severe SARS-CoV-2 infection led to significantly increased expression levels of pSYK, pBLNK, and pPLCγ2 compared with BND cells from healthy controls or those immunized against SARS-CoV-2 (Fig. 4, A and B). When considered as fold difference between unstimulated and BCR stimulated populations, pSYK and pPLCγ2 were elevated in BND cells from severely infected individuals compared with healthy controls and immunized individuals (Fig. S4 B). These data demonstrate that BND cells from individuals with mild or severe SARS-CoV-2 infection are restored in the ability to signal via the BCR, a feature consistent with the release from an anergic state.
Figure S3.
BCR signaling is specific to CD19+ B cells and phosphorylation proximal to the BCR occurs rapidly. (A) Expression (geometric mean fluorescent intensity) of pSYK Y348, pBLNK Y84, and pPLCγ2 Y759 in CD3+ T cells or CD19+ B cells from healthy controls (n = 6) after 5-min incubation with (+) or without (−) anti-IgG (H + L) F(ab’)2. (B) Expression of pSYK Y348, pBLNK Y84, and pPLCγ2 Y759 in CD19+ B cells from healthy controls (n = 1, repeated three times) after 2- or 5-min incubation with anti-IgG (H + L) F(ab’)2. Statistics: one-way ANOVA; *, P < 0.05; **, P < 0.01; ***, P < 0.001; ****, P < 0.0001.
Figure S4.
BND cells have reduced BCR signaling in healthy controls and Naive/T2 B cells from healthy controls and severe SARS-CoV-2 infection have comparable levels of BCR signaling. (A) Expression (geometric mean fluorescent intensity) of pSYK Y348, pBLNK Y84, and pPLCγ2 Y759 in Transitional T1, T2, Naive, or BND cells from healthy controls (n = 10) after 5-min incubation with anti-IgG (H + L) F(ab’)2. (B) Fold difference between expression level of pSYK, pBLNK, and pPLCγ2 from unstimulated BND cells and stimulation with anti-IgG (H + L) F(ab’)2 for 5 min in each patient population from healthy controls (n = 10), those immunized against SARS-CoV-2 (n = 15) or those with mild (n = 10) or severe SARS-CoV-2 infection (n = 12). (C and D) Expression (geometric mean fluorescent intensity) of pSYK Y348, pBLNK Y84, and pPLCγ2 Y759 in Naive B cells (C) or T2 cells (D) from healthy controls (n = 10) and severe SARS-CoV-2 infection (n = 10) after 5-min incubation with anti-IgG (H + L) F(ab’)2. Statistics: one-way ANOVA or unpaired t test; #, P = 0.06; *, P < 0.05; **, P < 0.01; ***, P < 0.001; ****, P < 0.0001.
Figure 4.
SARS-CoV-2 infection is associated with increased BCR signaling ability by BND cells. (A) Representative histogram expression (geometric mean fluorescent intensity) of pSYK Y348, pBLNK Y84, or pPLCγ2 Y759 in BND cells with (+) or without (−) 10 μg/ml anti-IgG (H + L) F(ab’)2 treatment for 5 min from healthy controls (white histograms), those immunized against SARS-CoV-2 (grey histograms), mild (pink histograms), or severe SARS-CoV-2 (red histograms). The control histogram (dashed line) is a BND FMO from healthy controls. (B) Summary quantification of phosphorylated protein expression in each patient population of healthy controls (n = 10), those immunized against SARS-CoV-2 (n = 14), mild (n = 8) or severe (n = 12) SARS-CoV-2 infection (+) or without (−) treatment. Statistics: one-way ANOVA; *, P < 0.05; **, P > 0.01.
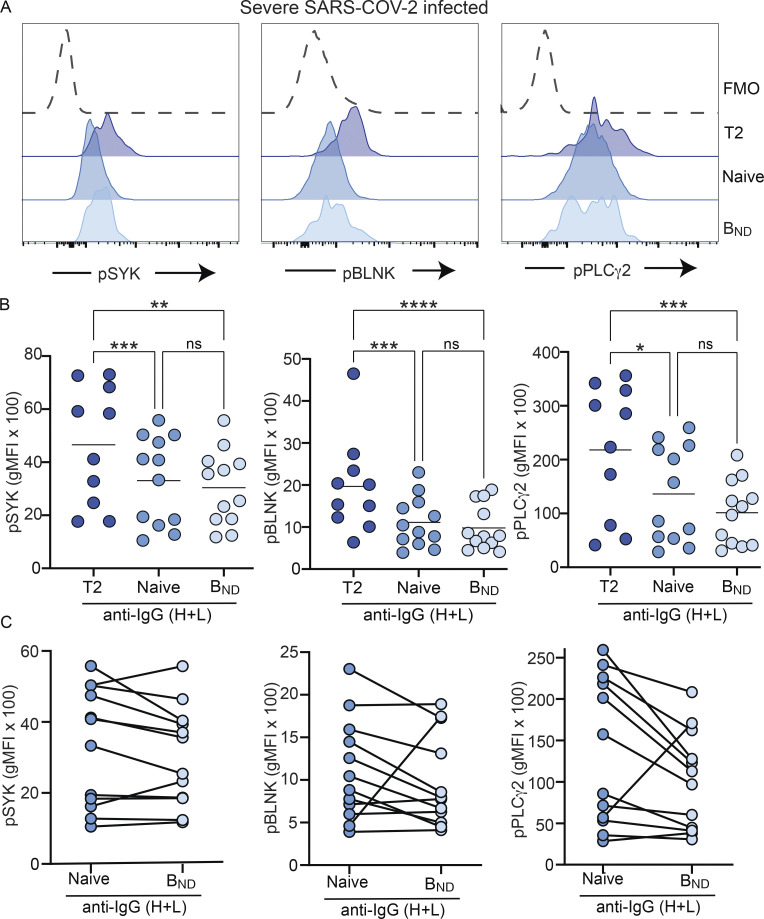
To assess whether all B cell populations from individuals with severe SARS-CoV-2 infection displayed elevated BCR signaling ability, we compared the levels of pSYK, pBLNK, and pPLCγ2 in BND cells after BCR crosslinking relative to those attained by T2 and Naive B cells. T2 cells from severe SARS-CoV-2 infection had the highest level of expression of phosphorylated signaling molecules (Fig. 5, A and B), in keeping with their reported enhanced response to antigen and BCR signaling, compared with T1 and Naive B cells (Petro et al., 2002; Simon et al., 2016). Notably, there were no significant differences in the expression of pSYK, pBLNK, and pPLCγ2 in BND cells compared with Naive B cells from severe SARS-CoV-2 infection (Fig. 5). Thus, these data indicate that with severe SARS-CoV-2 infection, the BCR signaling capacity of BND cells has been normalized to the level of an IgM-expressing Naive B cell. Importantly, the levels of pSYK, pBLNK, and pPLCγ2 reached after BCR crosslinking by T2 and Naive B cells from severe SARS-CoV-2 individuals were indistinguishable from the levels attained by BCR-stimulated T2 and Naive B cells from healthy controls (Fig. S4, C and D). Thus, overall, these data demonstrate that the population of BND cells during severe SARS-CoV-2 infection has largely restored BCR signaling and is consistent with having lost functional anergy.
Figure 5.
BND cells from individuals with severe SARS-CoV-2 infection have a BCR signaling capacity similar to Naive B cells. (A) Expression (geometric mean fluorescent intensity) of pSYK Y348, pBLNK Y84, or pPLCγ2 Y759 in BND cells (light blue) as compared with transitional T2 (royal blue), and Naive B cells (medium blue) from severe SARS-CoV-2 infection (n = 12) after 10 μg/ml anti-IgG (H + L) F(ab’)2 treatment for 5 min shown as representative histogram. The control histogram (dashed line) is a BND FMO from healthy controls. (B) Quantification of pSYK, pBLNK, and pPLCγ2 after BCR stimulation in T2, Naive, or BND cells. (C) Pairwise matching of Naive and BND cells from severe SARS-CoV-2 infection (n = 12). Statistics: one-way ANOVA or paired t test; *, P < 0.05; **, P < 0.01; ***, P < 0.001; ****, P < 0.0001.
Elevated autoreactive antibodies during severe SARS-CoV-2 infection
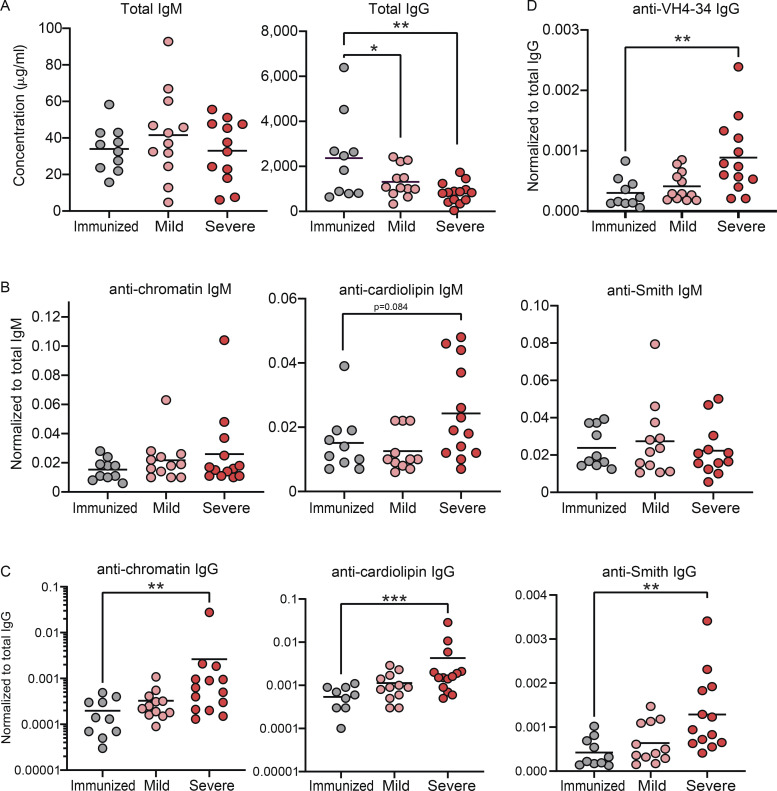
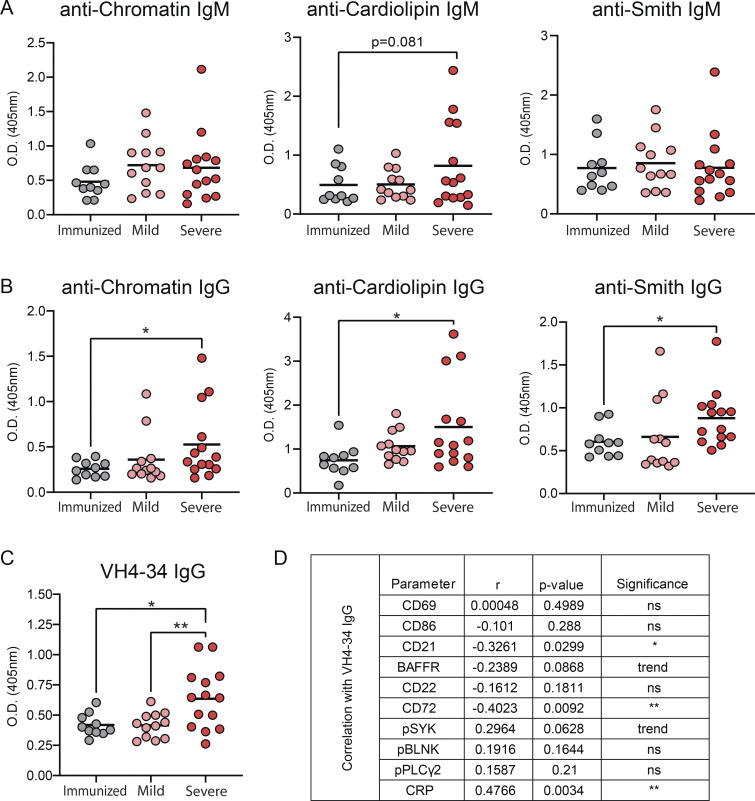
Elevated levels of autoreactive antibodies are a feature of SARS-CoV-2 infection (Bastard et al., 2020; Xiao et al., 2020; Wang et al., 2021; Chang et al., 2021); thus, we measured our cohorts for total IgM and IgG titers as well as autoreactive antibodies to specific autoantigens by ELISA. These results revealed that while there were no differences in total IgM levels between immunized, mild, and severely infected individuals, immunized individuals harbored significantly increased titers of total IgG compared with mild and severely infected individuals (Fig. 6 A). Notably, normalizing autoantibody titers to total Ig levels demonstrated that severely infected individuals harbored significantly increased IgG, but not IgM, autoantibody titers against chromatin, cardiolipin, and Smith autoantigens relative to either immunized or mild convalescent individuals (Fig. 6, B and C). Furthermore, the absolute IgG, but not IgM, autoantibody titers were also significantly increased in severely infected individuals relative to those measured in immunized and mild convalescent individuals (Fig. S5, A and B).
Figure 6.
SARS-CoV-2 infected individuals have higher titers of autoreactive antibodies than immunized controls. (A) Total levels of IgM or IgG were quantified in plasma from subjects immunized against SARS-CoV-2 (n = 10) or those mildly (n = 12) or severely infected with SARS-CoV-2 (n = 14). (B and C) Titers of autoreactive antibodies with specificity to autoantigens chromatin, cardiolipin, and Smith antigen were measured in plasma from subjects immunized against SARS-CoV-2 (n = 10), or those mildly (n = 12) or severely infected with SARS-CoV-2 (n = 14), then normalized to total IgM (B) or total IgG (C). (D) Titers of VH4-34 antibodies were measure in plasma then normalized to total IgG. Statistics: One-way ANOVA; *, P < 0.05; **, P < 0.01; ***, P < 0.001.
Figure S5.
Immunoglobulin plasma levels and VH4-34 IgG correlation with BND cells. (A and B) Absolute titers of IgM (A) or IgG (B) autoantibodies in plasma with reactivity against chromatin, cardiolipin, and Smith antigen from subjects immunized against SARS-CoV-2 (n = 10) or subjects with mild (n = 12) or severe SARS-CoV-2 infection (n = 14). (C) Absolute titers of VH4-34 IgG in plasma from subjects immunized against SARS-CoV-2 (n = 10) or subjects with mild (n = 12) or severe SARS-CoV-2 infection (n = 14). (D) Correlation of absolute titers of VH4-34 IgG with phenotypical or functional measurements of BND cells from those immunized against SARS-CoV-2 (n = 10), or subjects with mild (n = 11) or severe SARS-CoV-2 infection (n = 13). Statistics: one-way ANOVA or Pearson’s correlation; *, P < 0.05; **, P < 0.01; ***, P < 0.001.
Human B cells that express a germline VH4-34 Ig heavy chain (with diverse IgL chains) have been characterized as autoreactive with BCRs displaying specificity for nuclear antigens, dsDNA, chromatin, apoptotic cells, cardiolipin, CD45, and glycoproteins expressed on red blood cells (Cappione et al., 2004; Smith et al., 1995; Richardson et al., 2013). Indeed, VH4-34–encoded serum autoantibodies are found at elevated levels in SLE (Bhat et al., 2002; Cappione et al., 2004). The 9G4 monoclonal antibody is specific for a VH4-34 idiotype (Isenberg et al., 1993), and therefore can be used to identify VH4-34–expressing autoreactive human B cells that are found within an IgD+ IgM−/lo population in healthy individuals (Cappione et al., 2005; Bhat et al., 2015). Using 9G4, we measured the levels of VH4-34–encoded IgG in plasma from immunized individuals and those with mild or severe SARS-CoV-2 infection. These results demonstrated significantly higher titers of plasma 9G4-reactive IgG antibodies from severe SARS-CoV-2 infection either as normalized to total IgG (Fig. 6 D) or as absolute titers (Fig. S5 C). Moreover, the elevated levels of VH4-34 IgG antibodies correlated significantly with reduced levels of CD21 and the CD72 inhibitory receptor (Fig. S5 D). These findings further support the notion that severe SARS-CoV-2 infection results in a loss of anergy in the BND cell population.
Systemic inflammation correlates with altered BND cells phenotype and function during severe SARS-CoV-2 infection
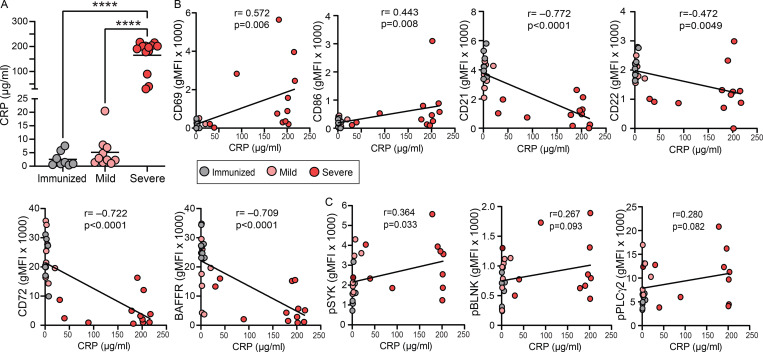
Given the in vitro evidence that inflammatory stimuli can release BND cells from anergy (Duty et al., 2009; Szodoray et al., 2016; Quách et al., 2011), and viral infections often correlate with autoantibody production (Koma et al., 2018; Vo et al., 2020; Rivera-Correa and Rodriguez, 2018; Tanay, 2017), we measured systemic levels of C-reactive protein (CRP) after immunization or with mild or severe SARS-CoV-2 infection and correlated these levels with BND cell phenotype or BND cell BCR signaling ability. As has been previously reported, CRP (Smilowitz et al., 2021), an indicator of overall inflammatory state, was significantly elevated in the plasma of subjects with severe SARS-CoV-2 infection when compared to levels in immunized subjects or those recovered from mild infection (Fig. 7 A). CRP levels tended to be modestly elevated in mild SARS-CoV-2 infection when compared with immunized subjects (Fig. 7 A). Higher levels of CRP were also significantly correlated with the presence of VH4-34 IgG antibodies in severely infected SARS-CoV-2 (Fig. S5 D). Importantly, there were significant correlations between CRP levels and alteration of BND cell phenotype and/or function. Specifically, increased levels of CRP were positively correlated with the upregulation of expression of activation markers CD69 and CD86 on BND cells (Fig. 7 B). Increased levels of CRP were also negatively correlated with the downregulation of CD21, BAFFR, and inhibitory markers CD22 and CD72 on BND cells (Fig. 7 B). Furthermore, increased levels of CRP significantly correlated with increased expression of pSYK in BND cells (Fig. 7 C). A trend toward a positive correlation between CRP and pBLNK or pPLCγ2 expression in BND cells was also observed (Fig. 7 C). These data reveal that a significant correlation exists between overall systemic inflammation and alterations in BND phenotype and function with the viral infection.
Figure 7.
CRP levels during severe SARS-CoV-2 infection correlate with altered BND phenotype and function. (A) Quantification of CRP (µg/ml) in plasma from those immunized (n = 8) against SARS-CoV-2, mild (n = 10), or severe SARS-CoV-2 infection (n = 13). (B and C) Correlation of levels of CRP (µg/ml) in plasma with phenotypic markers on BND cells (geometric mean fluorescent intensity; B) or with (C) expression of pSYK Y348, pBLNK Y84, or pPLCγ2 Y759 in BND cells with 10 μg/ml anti-IgG (H + L) F(ab’)2 treatment for 5 min from those immunized against SARS-CoV-2 (n = 8), mild (n = 8), or severe SARS-CoV-2 infection (n = 10). Statistics: one-way ANOVA or Pearson correlation; ****, P < 0.0001.
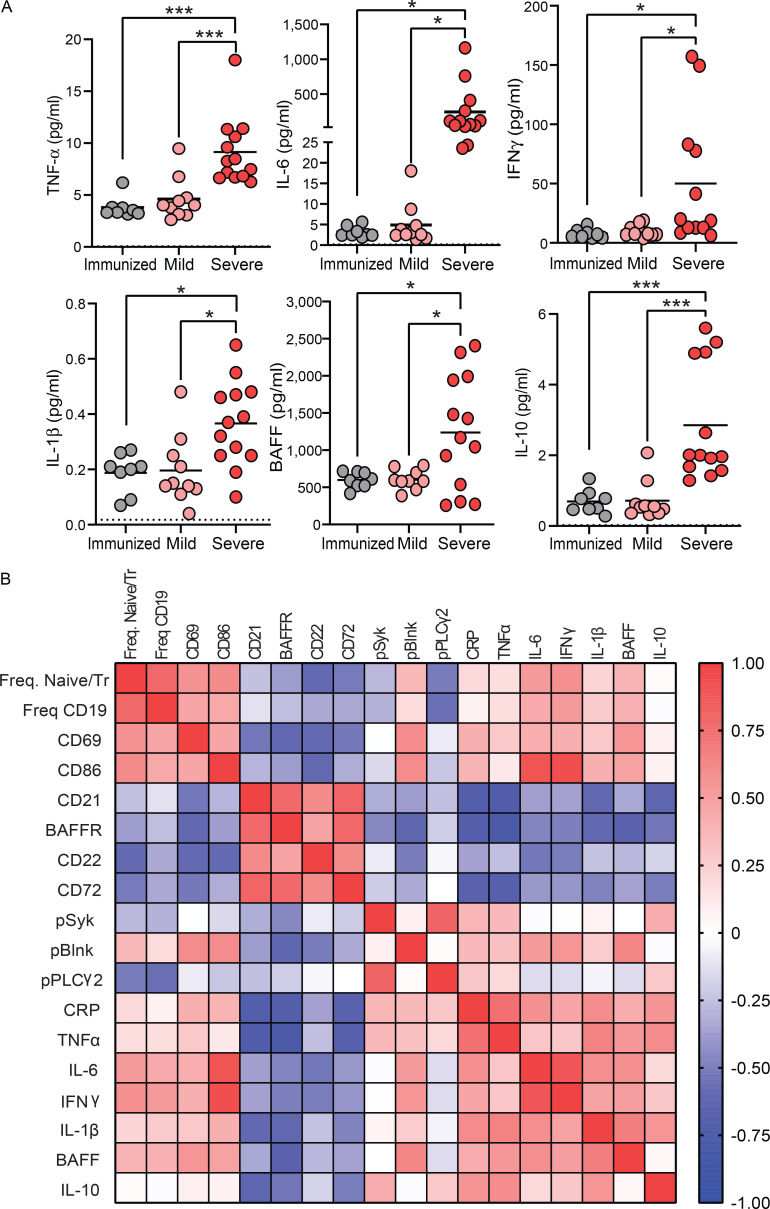
To further assess systemic inflammation in study subjects, levels of several proinflammatory cytokines were measured in plasma. These results revealed that individuals with severe SARS-CoV-2 infection had significantly higher levels of all proinflammatory cytokines measured, including TNF-α, IL-6, IFNγ, and IL-1β when compared with the levels in mild infection or immunized subjects (Fig. 8 A), confirming an altered inflammatory state with severe infection. Additionally, the levels of the BAFF survival cytokine were elevated with severe infection (Fig. 8 A), suggesting that BND cells may not need to compete with IgM-expressing naive or transitional cells for this survival cytokine if excess levels are available and in consideration of the lower levels of BAFFR on BND cells during SARS-CoV-2 infection (Fig. 2, A and B). Levels of IL-10 were also significantly elevated in severe infection (Fig. 8 A). Using the above cytokine levels, a correlation matrix was generated to evaluate the level of systemic inflammation in the context of BND cells. A distinct relationship between systemic inflammation and changes in BND phenotype or BND response to BCR signaling was observed (Fig. 8 B), suggesting a direct relationship between specific markers of inflammation and changes in phenotype and function of BND during viral infection.
Figure 8.
Elevated systemic inflammation during severe SARS-CoV-2 infection and correlation with BND phenotype and function. (A) Cytokines TNF-α, IL-6, IFNγ, IL-1β, BAFF, and IL-10 (pg/ml) were measured in plasma from those immunized against SARS-CoV-2 (n = 8), or those with mild (n = 10) or severe SARS-CoV-2 infection (n = 13). (B) A correlation matrix was generated using the values from those immunized against SARS-CoV-2 (n = 8), or subjects with mild (n = 8) or severe SARS-CoV-2 infection (n = 10) of the following parameters: frequency of BND cells as a percent of Naive/Transitional (CD27−IgD+) or as a percent of B cells (CD19+), expression (geometric mean fluorescent intensity) of CD69, CD86, CD21, BAFFR, CD22, and CD72 on BND cells, or pSYK Y348, pBLNK Y84, and pPLCγ2 Y759 expression in BND cells after 5 min incubation with anti-IgG (H + L) F(ab’)2 correlated with plasma levels of CRP (ng/ml), TNF-α, IL-6, IFNγ, IL-1β, BAFF, and IL-10 (pg/ml). Statistics: one-way ANOVA; *, P < 0.05; ***, P < 0.001.
Discussion
In this report, we have interrogated the phenotype and functional ability of BND cells during SARS-CoV-2 infection and find that the B cells within this normally anergic autoreactive B cell population are activated, display significantly reduced inhibitory receptor expression, and have acquired the ability to signal via the B cell antigen receptor. Importantly, both cell activation and BCR signaling by BND cells correlate significantly and positively with markers of inflammation in SARS-CoV-2 infection. Thus, these data provide compelling evidence that peripheral immunological tolerance is relaxed within the BND cell population during SARS-CoV-2 infection, likely a result of inflammatory cytokine production during severe SARS-CoV-2 infection.
While the majority of individuals infected with SARS-CoV-2 do not suffer from severe COVID-19 disease (Salzberger et al., 2021), a considerable subset of individuals develop a severe infection that is accompanied by robust proinflammatory cytokine production (Ragab et al., 2020; Yang et al., 2021). Autoantibody production has long been appreciated to be a consequence of inflammatory settings that not only include bacterial (Ramos et al., 2005; Isenberg et al., 1987; Jafarzadeh et al., 2013) and viral infections (Duca et al., 2017; Ruggeri et al., 2008; Kerr and Boyd, 1996; Bartholomaeus et al., 1988; Tanay, 2017) but also tissue injury (Davies et al., 2007; Burbelo et al., 2010). Thus, it is not surprising that autoantibody production in severe SARS-CoV-2 infection has been reported (Bastard et al., 2020; Chang et al., 2021; Wang et al., 2021; Xiao et al., 2020; Su et al., 2022), raising concern that autoantibodies may contribute to disease pathology, as previously reported for viral infections with Hepatitis B (Barzilai et al., 2007), the original SARS-CoV-1 (Lin et al., 2005; Yang et al., 2005), and the Dengue viruses (Lin et al., 2006). A pathogenic role for broad immune activation, and specifically extrafollicular B cell activation, was reported in severe SARS-CoV-2 infection in ICU patients, demonstrating an increase in serum levels of 9G4-idiotype autoantibodies (Woodruff et al., 2020), a finding confirmed in this study. Whether autoreactive BND cells, which we show are functionally active after SARS-CoV-2 infection, are the source of serum autoantibody and whether BND-derived autoantibodies contribute to pathology observed in severe COVID-19 is not yet clear, but is an area of active investigation.
The high frequency of autoreactive B cells in the periphery of healthy humans (Wardemann et al., 2003) argues that there is a beneficial purpose for these autoreactive B cells, rather than an inherent defect in central B cell tolerance, even at the expense of possibly developing autoimmunity. Weakly autoreactive B cells that are allowed to escape bone marrow selection to exist in the periphery may provide evolutionary protection against pathogens that use molecular mimicry since weak autoreactive antibodies often cross-react against pathogenic epitopes (Rosenspire and Chen, 2015). Indeed, we and others have demonstrated that autoreactive antibodies can neutralize multiple tiers of HIV-1 virus (Agazio et al., 2020; Schroeder et al., 2017; Verkoczy and Diaz, 2014). Given that autoreactive B cells may overcome anergy in the presence of strong inflammation and TLR ligands, such as is found with active viral infection, BND cells could be a reservoir of uniquely poised anti-viral B cells. Future studies will be needed to determine if the autoreactive specificities found within this cell population provide protection against viral infection, and possibly neutralizing cross-reactivity against SARS-CoV-2.
Our data do not exclude the formal possibility that during severe SARS-CoV-2 infection, our analysis of BND cells included antigen- (e.g., viral) specific naive (IgD+CD27−) B cells that have recently encountered cognate antigen and downregulated surface IgM, thus resembling IgD+CD27−IgM−/lo BND cells. However, we consider this highly unlikely for several reasons. First, the frequency of BND cells found with severe SARS-CoV-2 infection is not expanded but instead is comparable in size with BND cells in healthy controls and immunized individuals. Also, mature naive B cells are CD27− but are induced to express CD27 upon activation (Agematsu et al., 2000) and thus would be expected to be CD27+ and precluded from our BND cell analysis. Furthermore, recently BCR-triggered naive B cells would also be expected to be desensitized after BCR stimulation and refractory to subsequent signaling (Vilen et al., 1999), unlike the BND cells from severe SARS-CoV-2 infection in this study. Finally, we and others (Woodruff et al., 2020), found elevated levels of VH4-34–encoded autoantibodies in individuals with severe SARS-CoV-2 infection. The source of these autoantibodies, VH4-34–expressing B cells, which predominantly express autoreactive specificities (Richardson et al., 2013) with features of anergy (reduced calcium flux upon BCR stimulation and exclusion from germinal centers; Cappione et al., 2005) and reside within an IgD+IgM−/lo cell subset (Cappione et al., 2005; Bhat et al., 2015), would comprise cells in the BND population.
One limitation of this study is the older average age of subjects with severe SARS-CoV-2 infection compared with healthy and immunized controls. An additional limitation of this study is the sample size in each cohort. A larger sample size of severe SARS-CoV-2 infected subjects with a broader distribution and spectrum of disease severity would allow us to better interpret how systemic inflammation mediates alterations in BND cells. Despite these limitations, the current study demonstrates a strong correlation between systemic inflammation and alterations in BND phenotype and function with increases in autoantibody levels. The exact mechanism by which inflammatory cytokines modulate BND cell phenotype and function is an area of current investigation. A working hypothesis is that inflammatory cytokines could upregulate expression of TLRs, thereby lowering the threshold of BND responsiveness to self-antigen in the presence of the virus, eliminating the need for T cell help (provision of the secondary signal).
Whether the changes in BND phenotype and function associated with SARS-CoV-2 infection in addition to autoantibody production are durable or transient is not yet clear. Previous findings would suggest that autoantibody production associated with acute inflammation is transient rather than long-lasting (Chang et al., 2021). Our data would imply that as inflammation resolves, so too does the relaxation of peripheral tolerance in BND cells. However, reports of patients with ongoing symptoms termed “long haulers” (Tan et al., 2021; Ramakrishnan et al., 2021) would indicate that at least in a subset of people disease resolution is kinetically slower. Likewise, it has been observed that antinuclear antibodies were detectable in 43.6% of patients post–SARS-CoV-2 infection, and those with higher titers of ANA exhibited increased frequency of neurocognitive defects (Seessle et al., 2021), suggesting a link between autoantibody production and persistent symptoms (Su et al., 2022). Regardless, the characterization of BND cell phenotype and response to BCR signaling in COVID-19 long haulers would address whether this B cell subset continues to break anergy after viral resolution.
Intriguingly, it is unknown if subjects who generate autoreactive antibodies have subclinical autoimmunity and are therefore predisposed to severe SARS-CoV-2 infection or whether severe SARS-CoV-2 infection triggers aspects of de novo autoimmunity (Knight et al., 2021). Anecdotally, viral infection is thought to promote autoimmune diseases, as has been suggested for Epstein-Barr virus, Hepatitis B virus, and Cytomegalovirus (Barzilai et al., 2007). Furthermore, Zika virus infection has been associated with the development of Guillain-Barré Syndrome, an autoimmune disease of the nervous system (Duca et al., 2017), and Chikungunya virus is associated with persistent arthritis (Tanay, 2017). Longitudinal studies examining changes in the BND immunoglobulin repertoire over time may provide insight as to how infection alters the propensity of this autoreactive population to contribute to virally induced autoimmunity.
In summary, our study provides compelling evidence that human peripheral B cell tolerance is relaxed in a B cell subset, BND cells, during severe SARS-CoV-2 infection, and that this release from anergic restraint significantly correlates with inflammation. Importantly, these findings also imply that peripheral immunological B cell tolerance may not be a static barrier but, instead, physiologically regulated. Perturbation of this regulation may contribute to autoimmunity in releasing anergic autoreactive B cells. It remains to be determined whether purposeful relaxation of peripheral tolerance and release of the BND cell autoreactive subset provides antibody-mediated protection to combat viral infection through cross-reactivity.
Materials and methods
Study participants and human PBMCs
For people immunized against SARS-CoV-2 by Pfizer BNT162b2-mRNA or Moderna mRNA-1273, participants provided the dates of the primary inoculation and the booster. For people mildly infected (convalescent) with SARS-CoV-2, participants were included in this study if they had a positive viral qPCR test or the presence of anti–SARS-CoV-2 antibodies in the absence of vaccination (samples were collected before vaccination was available to the general public) and did not need hospitalization. For the above subjects, whole blood was drawn by staff at the University of Colorado Clinical and Translation Research Centers (CTRC), part of the Colorado Clinical and Translation Sciences Institute (CCTSI), in sodium heparin tubes (BD) and centrifuged at 1,700 rpm for 5 min to collect plasma. Plasma was stored at −80°C until use. Cells were then diluted in 1× PBS (Life Technologies), suspended over a Ficoll–Paque gradient (Cytiva) and centrifuged at 1,700 rpm for 30 min to isolate PBMCs from the buffy coat. PBMCs were resuspended in 90% FBS (Gemini) with 10% DMSO (ATCC) and stored in liquid nitrogen until use. For subjects with severe SARS-CoV-2 infection at National Jewish Health (NJH) and the University of Colorado Hospital (UCH), participants were enrolled from two academic teaching hospitals in the Denver metropolitan area, were 18 yr of age or older, and were mechanically ventilated for acute respiratory distress syndrome, as defined by the Berlin Criteria, due to SARS-CoV-2 confirmed by PCR of a nasal swab. Patients with a history of solid organ or bone marrow transplants, chronic lung disease, hemoptysis, increased risk for bleeding, pregnancy, or who were immunosuppressed were excluded from this study. Whole blood was collected from central venous catheters in cell preparation tubes with sodium citrate (BD Biosciences) and processed per the manufacturer’s instructions. Cells were cryopreserved at −80° in 90% FBS + DMEM and 10% DMSO or 90% FBS with 10% DMSO. Plasma was preserved at −80° until use. For healthy control samples, plateletpheresis leukoreduction filter (LRS chambers) was purchased from Vitalant Blood Center. Cells were suspended over a Ficoll–Paque gradient and centrifuged at 2,400 rpm for 20 min to isolate PBMCs. PBMCs were resuspended in 90% FBS with 10% DMSO and stored in liquid nitrogen until use. Given that plasma could not be isolated from LRS chambers for healthy controls, the immunized subjects were used as a comparator for mild or severe SARS-CoV-2 subjects when the plasma was examined.
Ex vivo phenotyping by flow cytometry
PBMCs were thawed in warm media containing RPMI Medium 1640 (Gibco) with 25 mM Hepes (Corning), centrifuged at 1,500 rpm for 5 min at room temperature, washed with media, centrifuged again, resuspended in 1× PBS, and enumerated by hemocytometer. For the ex vivo surface stain, PBMCs were incubated on ice for 20 min with Live/Dead Blue for UV (Invitrogen) viability dye and the following antibodies (clone in parentheses) in 1× PBS: CD3 (OKT3), CD19 (SJ25C1), CD27 (M-T271), IgD (IA6-2), CD24 (ML5), CD38 (HB7), CD10 (Hl10a), IgM (MHM-88), CD22 (HIB22), CD72 (REA231), CD21 (Bu32), CD86 (IT2.2), CD69 (FN50), and BAFFR (11C1). Cells were then washed in 1× PBS, centrifuged at 1,500 rpm for 5 min, fixed in 4% PFA (Fisher) for 15 min at room temperature, washed again, and resuspended in FACS buffer containing 1% BSA (Fisher) + 0.05% Sodium Azide (Aldrich) in 1× PBS.
All flow cytometry data were acquired on the Cytek Aurora, and the data were analyzed using FlowJo software (v 10.7.1). PBMCs were used for single color reference controls, except where the use of Ultra Comp eBeads (Invitrogen) was necessary. Within the lymphocyte single-cell viable gates, BND cells were identified as CD3− CD19+ CD27− IgD+ CD24low/− CD38low/− CD10− IgM−, as was originally described for these cells (Duty et al., 2009), Naive B cells were defined as CD3− CD19+ CD27− IgD+ CD24low/− CD38low/− CD10− IgM+, T1 B cells were defined as CD3− CD19+ CD27− IgD+ CD24+++ CD38+++, and T2 B cells were defined as CD3− CD19+ CD27− IgD+ CD24++ CD38++ (Simon et al., 2016; Palanichamy et al., 2009).
BCR signaling assessment by phospho flow cytometry
PBMCs were thawed as described above, then incubated for 45 min at 37°C + 5% CO2 to reduce basal phosphorylation levels while in the presence of the following antibodies (clone) in warm serum-free media: CD3 (OKT3), CD19 (SJ25C1), CD27 (M-T271), CD24 (ML5), CD38 (HB7), CD10 (Hl10a), and viability dye. Cells were then centrifuged at 1,500 rpm for 5 min, resuspended in warm RPMI with 5% FBS, and stimulated with either 10 μg/ml rabbit anti-human IgG (H + L) F(ab’)2 (Southern Biotech) or 75 μM pervanadate (used as an experimental positive control) for 5 min in a 37°C water bath. After a quick spin (2,400 g for 30 s), cells were resuspended in 100 μl per million cells Cytofix/Cytoperm (BD) and incubated for 20 min on ice. Cells were washed in 1× Perm/Wash (BD), then incubated in the presence of this buffer for intracellular staining for 30 min on ice with the following antibodies (clone in parentheses): pSyk Y348 (I120-722), pBlnk Y84 (REA240), pPLCγ2 Y759 (K86–689.37), IgD (IA6-2), and IgM (MHM-88). Cells were washed with 1× Perm/Wash and resuspended in FACS buffer containing 1% BSA (Fisher) + 0.05% sodium azide (Aldrich) in 1× PBS. Data were acquired on the Cytek Aurora and cell subsets defined as described above.
Measurement of total IgM/IgG and autoreactive antibodies in plasma
For the detection of autoreactive antibodies, 96-well Nunc-Immuno MaxiSorp plates (Thermo Fisher Scientific) were coated overnight at 4°C with either 15 μg/ml of sonicated calf thymus DNA (Sigma-Aldrich) in buffer (1× PBS, 1 mM EDTA, and 0.05% NaN3), 1 μg/ml Smith antigen (Arotec Diagnostics) in buffer (1× PBS, 15 mM Na2CO3, 35 mM NaHCO3, and 0.02% NaN3), 50 μg/ml cardiolipin (Sigma-Aldrich) in 100% molecular grade ethanol (Thermo Fisher Scientific), as was previously described (Schroeder et al., 2017), or coated for 2 h at 37°C with 0.5 μg/ml 9G4 antibody (kind gift of Dr. John Cambier, University of Colorado School of Medicine, Aurora, CO) in buffer (1× PBS) in a total volume of 50 μl per well. For measurement of total IgM and IgG, plates were coated with either 10 μg/ml of goat anti-human IgM or goat anti-human IgG capture antibody (Southern Biotech) overnight at 4°C in 1× PBS. Plates were then washed three times in wash buffer (1× PBS with 0.5% Tween-20), blocked for 1–2 h at 37°C in buffer (1× PBS, 1 mM EDTA, 0.05% NaN3, and 1% BSA or 1× PBS with 1% BSA for cardiolipin), and washed three times. For chromatin, Smith, or cardiolipin reactivity, each plasma sample was plated starting at 1:8 in a threefold serial dilution across six dilutions in a total volume of 50 μl per well and incubated for 2 h at 37°C. For 9G4 reactivity, each plasma sample was plated starting at 1:200 in a threefold serial dilution across six dilutions in a total volume of 50 μl per well and incubated overnight at 4°C. For total IgM, plasma samples were plated starting at 1:100 in a fivefold serial dilution across six points in a total volume of 100 μl per well and incubated for 2 h at 37°C. A standard curve of IgM (Thermo Fisher Scientific) starting at 1 pg/ml was used to quantify the total levels of IgM in each plasma sample. For total IgG, plasma samples were plated starting at 1:200 in a fivefold serial dilution across six points in a total volume of 100 μl per well and incubated for 2 h at 37°C. A standard curve of IgG (Southern Biotech) starting at 1 pg/ml was used to quantify the total levels of IgG in each plasma sample. Plates were then washed three times and incubated with goat anti-human IgM or goat anti-human IgG (for 9G4, goat anti-human IgG multispecies cross-absorbed was used) conjugated to alkaline phosphatase (Southern Biotech) in 1× PBS for 1 h at 37°C. Plates were then washed and developed with 1 mg/ml of 4-nitrophenyl phosphate disodium salt hexahydrate (Alkaline Phosphatase Substrate; Sigma-Aldrich), diluted in developing buffer (1 M diethanolamine, 8.4 mM MgCl2, and 0.02% NaN3 in water) for a total of 100 μl per well, and incubated at 37°C for 10–30 min. Absorbance values (O.D.) were read at 405 nm on the VersaMax ELI SA reader (MDS Analytical Technologies). The dilutions were log transformed to generate a curve, and the linear part of the curve was used to select a dilution at which the relative O.D. values for each group were compared. For chromatin, Smith, or cardiolipin reactivity, O.D. values were compared at 1/128 dilution; for 9G4 reactivity, O.D. values were compared at 1/16,200 dilution; for total IgM, O.D. values were compared at 1/2,500; and for total IgG, O.D. values were compared at 1/12,500.
Measurement of cytokines in plasma
For the measurement of analytes, plasma was thawed on ice, the levels of IL-1β, IL-6, IL-10, IFNγ, TNFα, and BAFF were measured by the U-PLEX Assay, and levels of CRP were measured using the V-PLEX Assay according to manufacturer’s instructions (Meso Scale Discovery). Both assays were quantified on the QuickPlex SQ 120 Instrument (Meso Scale Discovery).
Statistics
Data were analyzed using Prism Graph-Pad Software (v 9.2.0). One-way ANOVA or unpaired t test was used as indicated in figure legends to determine the significance of differences between healthy controls, immunized samples, and mild or severe infection. For the comparison of cell types within a group (e.g., BND cells compared to naive cells within the immunized group) one-way ANOVA or paired t tests were used as indicated in the figure legends. For the correlation of CRP levels with the expression of surface markers or phospho proteins of BND cells, a Pearson correlation was used as indicated in the figure legends. Significance was defined as P < 0.05. If a trend to significance of P < 0.09 was observed, then it was noted on the figure. Every dot on a scatter dot plot within a group represents one human donor in that group.
Study approval
The use of human plasma and PBMCs in this study was approved by the Colorado Multiple Institutional Review Board (COMIRB) at the University of Colorado School of Medicine and NJH and performed under the Declaration of Helsinki. Participants provided informed consent, and informed consent was obtained from a legally authorized representative (NHJ) or by an approved waiver of consent (UCH).
Online supplemental material
Fig. S1 shows the proportion of B cells in PBMCs for each cohort. Fig. S2 displays the phenotypic characterization of BND cells in healthy controls, immunized subjects, or mild SARS-CoV-2 infected subjects. Fig. S3 shows BCR signaling is specific to CD19+ B cells and occurs rapidly. Fig. S4 displays BCR signaling ability in BND cells, T1, T2, or Naive B cells from healthy controls, the fold difference in pSYK, pBLK, and pPLCγ2 in BND cells from subjects used in this study, and the comparison of BCR signaling between healthy controls and severe SARS-CoV-2 infection for Naive and T2 B cells. Fig. S5 shows the absolute titers of IgM and IgG autoantibodies. Table S1 presents the demographic data of subjects whose samples were used in this study.
Supplementary Material
presents the demographics of subjects used in this study.
Acknowledgments
We acknowledge the ImmunoMicro Flow Cytometry Shared Resource Laboratory at the University of Colorado Anschutz Medical Campus (RRID:SCR_021321). We appreciate Christine Griesmer, Ayal Levi, Jazalle McClendon, and Shannon McManus for their efforts in enrolling patients with severe SARS-CoV-2 and processing the biological specimens. We appreciate the assistance of Olivia Verburg with blood draws. We also acknowledge the members of the Torres lab and Pelanda lab for helpful discussions. We appreciate helpful discussions with Sophie Hillion Weber from the University of Brest. Finally, we appreciate those who donated blood for this study to be conducted.
This work was supported by the National Institute of Health grants R01 AI136534 (to R.M. Torres), AI124474 (to R. Pelanda), and AI131639 (to R. Pelanda). Whole blood collection of immunized subjects and mild SARS-Cov-2 infected was done through the CU Anschutz CTRC/CCTSI and supported by NIH/NCATS Colorado CTSA grant number UL1 TR002535.
Author contributions: M.J. Castleman and R.M. Torres designed the study, interpreted the work, and wrote the manuscript. M.J. Castleman recruited immunized and mild SARS-CoV-2 subjects, performed experiments, and analyzed the data. M.M. Stumpf and N.R. Therrien performed experiments. M.J. Smith and R. Pelanda provided expertise and samples, and helped interpret results. K.E. Lesteberg, B.E. Palmer, J.P. Maloney, K.J. Mould, W.J. Janssen, and J.D. Beckham provided mild or severe SARS-CoV-2 samples. All authors reviewed the manuscript.
References
- Adachi, T., Wakabayashi C., Nakayama T., Yakura H., and Tsubata T.. 2000. CD72 negatively regulates signaling through the antigen receptor of B cells. J. Immunol. 164:1223–1229. 10.4049/jimmunol.164.3.1223 [DOI] [PubMed] [Google Scholar]
- Agazio, A., Cimons J., Shotts K.M., Guo K., Santiago M.L., Pelanda R., and Torres R.M.. 2020. Histone H2A-reactive B cells are functionally anergic in healthy mice with potential to provide humoral protection against HIV-1. Front. Immunol. 11:1565. 10.3389/fimmu.2020.01565 [DOI] [PMC free article] [PubMed] [Google Scholar]
- Agematsu, K., Hokibara S., Nagumo H., and Komiyama A.. 2000. CD27: a memory B-cell marker. Immunol. Today. 21:204–206. 10.1016/s0167-5699(00)01605-4 [DOI] [PubMed] [Google Scholar]
- Bartholomaeus, W.N., O’donoghue H., Foti D., Lawson C.M., Shellam G.R., and Reed W.D.. 1988. Multiple autoantibodies following cytomegalovirus infection: Virus distribution and specificity of autoantibodies. Immunology. 64:397–405. [PMC free article] [PubMed] [Google Scholar]
- Barzilai, O., Ram M., and Shoenfeld Y.. 2007. Viral infection can induce the production of autoantibodies. Curr. Opin. Rheumatol. 19:636–643. 10.1097/BOR.0b013e3282f0ad25 [DOI] [PubMed] [Google Scholar]
- Bastard, P., Rosen L.B., Zhang Q., Michailidis E., Hoffmann H.H., Zhang Y., Dorgham K., Philippot Q., Rosain J., Beziat V., et al. 2020. Autoantibodies against type I IFNs in patients with life-threatening COVID-19. Science. 370:eabd4585. 10.1126/science.abd4585 [DOI] [PMC free article] [PubMed] [Google Scholar]
- Benschop, R.J., Aviszus K., Zhang X., Manser T., Cambier J.C., and Wysocki L.J.. 2001. Activation and anergy in bone marrow B cells of a novel immunoglobulin transgenic mouse that is both hapten specific and autoreactive. Immunity. 14:33–43. 10.1016/s1074-7613(01)00087-5 [DOI] [PubMed] [Google Scholar]
- Bhat, N.M., Kshirsagar M.A., Bieber M.M., and Teng N.N.H.. 2015. IgG subclasses and isotypes of VH4-34 encoded antibodies. Immunol. Invest. 44:400–410. 10.3109/08820139.2015.1015682 [DOI] [PubMed] [Google Scholar]
- Bhat, N.M., Lee L.M., van Vollenhoven R.F., Teng N.N.H., and Bieber M.M.. 2002. VH4-34 encoded antibody in systemic lupus erythematosus: Effect of isotype. J. Rheumatol. 29:2114–2121. [PubMed] [Google Scholar]
- Burbelo, P.D., Seam N., Groot S., Ching K.H., Han B.L., Meduri G.U., Iadarola M.J., and Suffredini A.F.. 2010. Rapid induction of autoantibodies during ARDS and septic shock. J. Transl. Med. 8:97. 10.1186/1479-5876-8-97 [DOI] [PMC free article] [PubMed] [Google Scholar]
- Cambier, J.C., Gauld S.B., Merrell K.T., and Vilen B.J.. 2007. B-cell anergy: From transgenic models to naturally occurring anergic B cells? Nat. Rev. Immunol. 7:633–643. 10.1038/nri2133 [DOI] [PMC free article] [PubMed] [Google Scholar]
- Cappione, A., 3rd, Anolik J.H., Pugh-Bernard A., Barnard J., Dutcher P., Silverman G., and Sanz I.. 2005. Germinal center exclusion of autoreactive B cells is defective in human systemic lupus erythematosus. J. Clin. Invest. 115:3205–3216. 10.1172/JCI24179 [DOI] [PMC free article] [PubMed] [Google Scholar]
- Cappione, A.J., Pugh-Bernard A.E., Anolik J.H., and Sanz I.. 2004. Lupus IgG VH4.34 antibodies bind to a 220-kDa glycoform of CD45/B220 on the surface of human B lymphocytes. J. Immunol. 172:4298–4307. 10.4049/jimmunol.172.7.4298 [DOI] [PubMed] [Google Scholar]
- Chang, N.H., Mckenzie T., Bonventi G., Landolt-Marticorena C., Fortin P.R., Gladman D., Urowitz M., and Wither J.E.. 2008. Expanded population of activated antigen-engaged cells within the naive B cell compartment of patients with systemic lupus erythematosus. J. Immunol. 180:1276–1284. 10.4049/jimmunol.180.2.1276 [DOI] [PubMed] [Google Scholar]
- Chang, S.E., Feng A., Meng W., Apostolidis S.A., Mack E., Artandi M., Barman L., Bennett K., Chakraborty S., Chang I., et al. 2021. New-onset IgG autoantibodies in hospitalized patients with COVID-19. Nat. Commun. 12:5417. 10.1038/s41467-021-25509-3 [DOI] [PMC free article] [PubMed] [Google Scholar]
- Davies, A.L., Hayes K.C., and Dekaban G.A.. 2007. Clinical correlates of elevated serum concentrations of cytokines and autoantibodies in patients with spinal cord injury. Arch. Phys. Med. Rehabil. 88:1384–1393. 10.1016/j.apmr.2007.08.004 [DOI] [PubMed] [Google Scholar]
- Del Valle, D.M., Kim-Schulze S., Huang H.H., Beckmann N.D., Nirenberg S., Wang B., Lavin Y., Swartz T.H., Madduri D., Stock A., et al. 2020. An inflammatory cytokine signature predicts COVID-19 severity and survival. Nat. Med. 26:1636–1643. 10.1038/s41591-020-1051-9 [DOI] [PMC free article] [PubMed] [Google Scholar]
- Duca, L.M., Beckham J.D., Tyler K.L., and Pastula D.M.. 2017. Zika virus disease and associated neurologic complications. Curr. Infect. Dis. Rep. 19:4. 10.1007/s11908-017-0557-x [DOI] [PubMed] [Google Scholar]
- Duty, J.A., Szodoray P., Zheng N.Y., Koelsch K.A., Zhang Q., Swiatkowski M., Mathias M., Garman L., Helms C., Nakken B., et al. 2009. Functional anergy in a subpopulation of naive B cells from healthy humans that express autoreactive immunoglobulin receptors. J. Exp. Med. 206:139–151. 10.1084/jem.20080611 [DOI] [PMC free article] [PubMed] [Google Scholar]
- Franks, S.E., and Cambier J.C.. 2018. Putting on the brakes: Regulatory kinases and phosphatases maintaining B cell anergy. Front. Immunol. 9:665. 10.3389/fimmu.2018.00665 [DOI] [PMC free article] [PubMed] [Google Scholar]
- Gauld, S.B., Benschop R.J., Merrell K.T., and Cambier J.C.. 2005. Maintenance of B cell anergy requires constant antigen receptor occupancy and signaling. Nat. Immunol. 6:1160–1167. 10.1038/ni1256 [DOI] [PubMed] [Google Scholar]
- Goodnow, C.C., Crosbie J., Adelstein S., Lavoie T.B., Smith-Gill S.J., Brink R.A., Pritchard-Briscoe H., Wotherspoon J.S., Loblay R.H., Raphael K., et al. 1988. Altered immunoglobulin expression and functional silencing of self-reactive B lymphocytes in transgenic mice. Nature. 334:676–682. 10.1038/334676a0 [DOI] [PubMed] [Google Scholar]
- Gross, A.J., Lyandres J.R., Panigrahi A.K., Prak E.T.L., and DeFranco A.L.. 2009. Developmental acquisition of the Lyn-CD22-SHP-1 inhibitory pathway promotes B cell tolerance. J. Immunol. 182:5382–5392. 10.4049/jimmunol.0803941 [DOI] [PMC free article] [PubMed] [Google Scholar]
- Isenberg, D., Spellerberg M., Williams W., Griffiths M., and Stevenson F.. 1993. Identification of the 9G4 idiotope in systemic lupus erythematosus. Br. J. Rheumatol. 32:876–882. 10.1093/rheumatology/32.10.876 [DOI] [PubMed] [Google Scholar]
- Isenberg, D.A., Maddison P., Swana G., Skinner R.P., Swana M., Jones M., Addison I., Dudeney C., Shall S., ElRoiey A., and Shoenfeld Y.. 1987. Profile of autoantibodies in the serum of patients with tuberculosis, klebsiella and other gram-negative infections. Clin. Exp. Immunol. 67:516–523. [PMC free article] [PubMed] [Google Scholar]
- Isnardi, I., Ng Y.S., Menard L., Meyers G., Saadoun D., Srdanovic I., Samuels J., Berman J., Buckner J.H., Cunningham-Rundles C., and Meffre E.. 2010. Complement receptor 2/CD21- human naive B cells contain mostly autoreactive unresponsive clones. Blood. 115:5026–5036. 10.1182/blood-2009-09-243071 [DOI] [PMC free article] [PubMed] [Google Scholar]
- Jafarzadeh, A., Nemati M., Rezayati M.T., Nabizadeh M., and Ebrahimi M.. 2013. Higher serum levels of rheumatoid factor and anti-nuclear antibodies in helicobacter pylori-infected peptic ulcer patients. Oman Med. J. 28:264–269. 10.5001/omj.2013.74 [DOI] [PMC free article] [PubMed] [Google Scholar]
- Kerr, J.R., and Boyd N.. 1996. Autoantibodies following parvovirus B19 infection. J. Infect. 32:41–47. 10.1016/s0163-4453(96)80008-9 [DOI] [PubMed] [Google Scholar]
- Knight, J.S., Caricchio R., Casanova J.L., Combes A.J., Diamond B., Fox S.E., Hanauer D.A., James J.A., Kanthi Y., Ladd V., et al. 2021. The intersection of COVID-19 and autoimmunity. J. Clin. Invest. 131:e154886. 10.1172/JCI154886 [DOI] [PMC free article] [PubMed] [Google Scholar]
- Koma, T., Veljkovic V., Anderson D.E., Wang L.F., Rossi S.L., Shan C., Shi P.Y., Beasley D.W., Bukreyeva N., Smith J.N., et al. 2018. Zika virus infection elicits auto-antibodies to C1q. Sci. Rep. 8:1882. 10.1038/s41598-018-20185-8 [DOI] [PMC free article] [PubMed] [Google Scholar]
- Lang, J., Ota T., Kelly M., Strauch P., Freed B.M., Torres R.M., Nemazee D., and Pelanda R.. 2016. Receptor editing and genetic variability in human autoreactive B cells. J. Exp. Med. 213:93–108. 10.1084/jem.20151039 [DOI] [PMC free article] [PubMed] [Google Scholar]
- Lesley, R., Xu Y., Kalled S.L., Hess D.M., Schwab S.R., Shu H.B., and Cyster J.G.. 2004. Reduced competitiveness of autoantigen-engaged B cells due to increased dependence on BAFF. Immunity. 20:441–453. 10.1016/s1074-7613(04)00079-2 [DOI] [PubMed] [Google Scholar]
- Lin, C.F., Wan S.W., Cheng H.J., Lei H.Y., and Lin Y.S.. 2006. Autoimmune pathogenesis in dengue virus infection. Viral Immunol. 19:127–132. 10.1089/vim.2006.19.127 [DOI] [PubMed] [Google Scholar]
- Lin, Y.S., Lin C.F., Fang Y.T., Kuo Y.M., Liao P.C., Yeh T.M., Hwa K.Y., Shieh C.C.K., Yen J.H., Wang H.J., et al. 2005. Antibody to severe acute respiratory syndrome (SARS)-associated coronavirus spike protein domain 2 cross-reacts with lung epithelial cells and causes cytotoxicity. Clin. Exp. Immunol. 141:500–508. 10.1111/j.1365-2249.2005.02864.x [DOI] [PMC free article] [PubMed] [Google Scholar]
- Meffre, E. 2011. The establishment of early B cell tolerance in humans: Lessons from primary immunodeficiency diseases. Ann. N. Y Acad. Sci. 1246:1–10. 10.1111/j.1749-6632.2011.06347.x [DOI] [PMC free article] [PubMed] [Google Scholar]
- Meffre, E., and O’Connor K.C.. 2019. Impaired B-cell tolerance checkpoints promote the development of autoimmune diseases and pathogenic autoantibodies. Immunol. Rev. 292:90–101. 10.1111/imr.12821 [DOI] [PMC free article] [PubMed] [Google Scholar]
- Merrell, K.T., Benschop R.J., Gauld S.B., Aviszus K., Decote-Ricardo D., Wysocki L.J., and Cambier J.C.. 2006. Identification of anergic B cells within a wild-type repertoire. Immunity. 25:953–962. 10.1016/j.immuni.2006.10.017 [DOI] [PubMed] [Google Scholar]
- Nemazee, D. 2017. Mechanisms of central tolerance for B cells. Nat. Rev. Immunol. 17:281–294. 10.1038/nri.2017.19 [DOI] [PMC free article] [PubMed] [Google Scholar]
- Packard, T.A., and Cambier J.C.. 2013. B lymphocyte antigen receptor signaling: Initiation, amplification, and regulation. F1000Prime Rep. 5:40. 10.12703/P5-40 [DOI] [PMC free article] [PubMed] [Google Scholar]
- Palanichamy, A., Barnard J., Zheng B., Owen T., Quach T., Wei C., Looney R.J., Sanz I., and Anolik J.H.. 2009. Novel human transitional B cell populations revealed by B cell depletion therapy. J. Immunol. 182:5982–5993. 10.4049/jimmunol.0801859 [DOI] [PMC free article] [PubMed] [Google Scholar]
- Pelanda, R., and Torres R.M.. 2012. Central B-cell tolerance: Where selection begins. Cold Spring Harb Perspect. Biol. 4:a007146. 10.1101/cshperspect.a007146 [DOI] [PMC free article] [PubMed] [Google Scholar]
- Petro, J.B., Gerstein R.M., Lowe J., Carter R.S., Shinners N., and Khan W.N.. 2002. Transitional type 1 and 2 B lymphocyte subsets are differentially responsive to antigen receptor signaling. J. Biol. Chem. 277:48009–48019. 10.1074/jbc.M200305200 [DOI] [PubMed] [Google Scholar]
- Quách, T.D., Manjarrez-Orduño N., Adlowitz D.G., Silver L., Yang H., Wei C., Milner E.C.B., and Sanz I.. 2011. Anergic responses characterize a large fraction of human autoreactive naive B cells expressing low levels of surface IgM. J. Immunol. 186:4640–4648. 10.4049/jimmunol.1001946 [DOI] [PMC free article] [PubMed] [Google Scholar]
- Ragab, D., Salah Eldin H., Taeimah M., Khattab R., and Salem R.. 2020. The COVID-19 cytokine storm; what we know so far. Front. Immunol. 11:1446. 10.3389/fimmu.2020.01446 [DOI] [PMC free article] [PubMed] [Google Scholar]
- Ramakrishnan, R.K., Kashour T., Hamid Q., Halwani R., and Tleyjeh I.M.. 2021. Unraveling the mystery surrounding post-acute sequelae of COVID-19. Front. Immunol. 12:686029. 10.3389/fimmu.2021.686029 [DOI] [PMC free article] [PubMed] [Google Scholar]
- Ramos, O.P., Silva E.E.C., Falcão D.P., and de Medeiros B.M. M.. 2005. Production of autoantibodies associated with polyclonal activation in Yersinia enterocolitica O: 8-infected mice. Microbiol. Immunol. 49:129–137. 10.1111/j.1348-0421.2005.tb03712.x [DOI] [PubMed] [Google Scholar]
- Rathmell, J.C., Fournier S., Weintraub B.C., Allison J.P., and Goodnow C.C.. 1998. Repression of B7.2 on self-reactive B cells is essential to prevent proliferation and allow Fas-mediated deletion by CD4(+) T cells. J. Exp. Med. 188:651–659. 10.1084/jem.188.4.651 [DOI] [PMC free article] [PubMed] [Google Scholar]
- Richardson, C., Chida A.S., Adlowitz D., Silver L., Fox E., Jenks S.A., Palmer E., Wang Y., Heimburg-Molinaro J., Li Q.Z., et al. 2013. Molecular basis of 9G4 B cell autoreactivity in human systemic lupus erythematosus. J. Immunol. 191:4926–4939. 10.4049/jimmunol.1202263 [DOI] [PMC free article] [PubMed] [Google Scholar]
- Rivera-Correa, J., and Rodriguez A.. 2018. Divergent roles of antiself antibodies during infection. Trends Immunol. 39:515–522. 10.1016/j.it.2018.04.003 [DOI] [PMC free article] [PubMed] [Google Scholar]
- Rosenspire, A.J., and Chen K.. 2015. Anergic B cells: Precarious on-call warriors at the nexus of autoimmunity and false-flagged pathogens. Front. Immunol. 6:580. 10.3389/fimmu.2015.00580 [DOI] [PMC free article] [PubMed] [Google Scholar]
- Ruggeri, C., La Masa A.T., Rudi S., Squadrito G., Di Pasquale G., Maimone S., Caccamo G., Pellegrino S., Raimondo G., and Magazzu G.. 2008. Celiac disease and non-organ-specific autoantibodies in patients with chronic hepatitis C virus infection. Dig. Dis. Sci. 53:2151–2155. 10.1007/s10620-007-0146-1 [DOI] [PubMed] [Google Scholar]
- Saadoun, D., Terrier B., Bannock J., Vazquez T., Massad C., Kang I., Joly F., Rosenzwajg M., Sene D., Benech P., et al. 2013. Expansion of autoreactive unresponsive CD21-/low B cells in Sjogren’s syndrome-associated lymphoproliferation. Arthritis Rheum. 65:1085–1096. 10.1002/art.37828 [DOI] [PMC free article] [PubMed] [Google Scholar]
- Salzberger, B., Buder F., Lampl B., Ehrenstein B., Hitzenbichler F., Holzmann T., Schmidt B., and Hanses F.. 2021. Epidemiology of SARS-CoV-2. Infection. 49:233–239. 10.1007/s15010-020-01531-3 [DOI] [PMC free article] [PubMed] [Google Scholar]
- Sanz, I., Wei C., Jenks S.A., Cashman K.S., Tipton C., Woodruff M.C., Hom J., and Lee F.E.-H.. 2019. Challenges and opportunities for consistent classification of human B cell and plasma cell populations. Front. Immunol. 10:2458. 10.3389/fimmu.2019.02458 [DOI] [PMC free article] [PubMed] [Google Scholar]
- Schroeder, K.M.S., Agazio A., Strauch P.J., Jones S.T., Thompson S.B., Harper M.S., Pelanda R., Santiago M.L., and Torres R.M.. 2017. Breaching peripheral tolerance promotes the production of HIV-1-neutralizing antibodies. J. Exp. Med. 214:2283–2302. 10.1084/jem.20161190 [DOI] [PMC free article] [PubMed] [Google Scholar]
- Seessle, J., Waterboer T., Hippchen T., Simon J., Kirchner M., Lim A., Muller B., and Merle U.. 2021. Persistent symptoms in adult patients one year after COVID-19: A prospective cohort study. Clin. Infect. Dis. 10.1093/cid/ciab611 [DOI] [PMC free article] [PubMed] [Google Scholar]
- Simon, Q., Pers J.O., Cornec D., Le Pottier L., Mageed R.A., and Hillion S.. 2016. In-depth characterization of CD24(high)CD38(high) transitional human B cells reveals different regulatory profiles. J. Allergy Clin. Immunol. 137:1577–1584.e10. 10.1016/j.jaci.2015.09.014 [DOI] [PubMed] [Google Scholar]
- Smilowitz, N.R., Kunichoff D., Garshick M., Shah B., Pillinger M., Hochman J.S., and Berger J.S.. 2021. C-reactive protein and clinical outcomes in patients with COVID-19. Eur. Heart J. 42:2270–2279. 10.1093/eurheartj/ehaa1103 [DOI] [PMC free article] [PubMed] [Google Scholar]
- Smith, G., Spellerberg M., Boulton F., Roelcke D., and Stevenson F.. 1995. The immunoglobulin VH gene, VH4-21, specifically encodes autoanti-red cell antibodies against the I or i antigens. Vox Sang. 68:231–235. 10.1111/j.1423-0410.1995.tb02578.x [DOI] [PubMed] [Google Scholar]
- Smith, K.G., Tarlinton D.M., Doody G.M., Hibbs M.L., and Fearon D.T.. 1998. Inhibition of the B cell by CD22: A requirement for Lyn. J. Exp. Med. 187:807–811. 10.1084/jem.187.5.807 [DOI] [PMC free article] [PubMed] [Google Scholar]
- Smith, M.J., Ford B.R., Rihanek M., Coleman B.M., Getahun A., Sarapura V.D., Gottlieb P.A., and Cambier J.C.. 2019. Elevated PTEN expression maintains anergy in human B cells and reveals unexpectedly high repertoire autoreactivity. JCI Insight. 4:123384. 10.1172/jci.insight.123384 [DOI] [PMC free article] [PubMed] [Google Scholar]
- Smith, M.J., Packard T.A., O’neill S.K., Henry Dunand C.J., Huang M., Fitzgerald-Miller L., Stowell D., Hinman R.M., Wilson P.C., Gottlieb P.A., and Cambier J.C.. 2015. Loss of anergic B cells in prediabetic and new-onset type 1 diabetic patients. Diabetes. 64:1703–1712. 10.2337/db13-1798 [DOI] [PMC free article] [PubMed] [Google Scholar]
- Smith, M.J., Rihanek M., Coleman B.M., Gottlieb P.A., Sarapura V.D., and Cambier J.C.. 2018. Activation of thyroid antigen-reactive B cells in recent onset autoimmune thyroid disease patients. J. Autoimmun. 89:82–89. 10.1016/j.jaut.2017.12.001 [DOI] [PMC free article] [PubMed] [Google Scholar]
- Su, Y., Yuan D., Chen D.G., Ng R.H., Wang K., Choi J., Li S., Hong S., Zhang R., Xie J., et al. 2022. Multiple early factors anticipate post-acute COVID-19 sequelae. Cell. 185:881–895.e20. 10.1016/j.cell.2022.01.014 [DOI] [PMC free article] [PubMed] [Google Scholar]
- Szodoray, P., Stanford S.M., Molberg Ø., Munthe L.A., Bottini N., and Nakken B.. 2016. T-helper signals restore B-cell receptor signaling in autoreactive anergic B cells by upregulating CD45 phosphatase activity. J. Allergy Clin. Immunol. 138:839–851.e8. 10.1016/j.jaci.2016.01.035 [DOI] [PubMed] [Google Scholar]
- Tan, L.Y., Komarasamy T.V., and Rmt Balasubramaniam V.. 2021. Hyperinflammatory immune response and COVID-19: A double edged sword. Front. Immunol. 12:742941. 10.3389/fimmu.2021.742941 [DOI] [PMC free article] [PubMed] [Google Scholar]
- Tanay, A. 2017. Chikungunya virus and autoimmunity. Curr. Opin. Rheumatol. 29:389–393. 10.1097/BOR.0000000000000396 [DOI] [PubMed] [Google Scholar]
- Verkoczy, L., and Diaz M.. 2014. Autoreactivity in HIV-1 broadly neutralizing antibodies: Implications for their function and induction by vaccination. Curr. Opin. HIV AIDS. 9:224–234. 10.1097/COH.0000000000000049 [DOI] [PMC free article] [PubMed] [Google Scholar]
- Vilen, B.J., Nakamura T., and Cambier J.C.. 1999. Antigen-stimulated dissociation of BCR mIg from Ig-alpha/Ig-beta: Implications for receptor desensitization. Immunity. 10:239–248. 10.1016/s1074-7613(00)80024-2 [DOI] [PMC free article] [PubMed] [Google Scholar]
- Vo, H.T.M., Duong V., Ly S., Li Q.Z., Dussart P., and Cantaert T.. 2020. Autoantibody profiling in plasma of dengue virus-infected individuals. Pathogens. 9:1060. 10.3390/pathogens9121060 [DOI] [PMC free article] [PubMed] [Google Scholar]
- Wang, E.Y., Mao T., Klein J., Dai Y., Huck J.D., Jaycox J.R., Liu F., Zhou T., Israelow B., Wong P., et al. 2021. Diverse functional autoantibodies in patients with COVID-19. Nature. 595:283–288. 10.1038/s41586-021-03631-y [DOI] [PubMed] [Google Scholar]
- Wardemann, H., Hammersen J., and Nussenzweig M.C.. 2004. Human autoantibody silencing by immunoglobulin light chains. J. Exp. Med. 200:191–199. 10.1084/jem.20040818 [DOI] [PMC free article] [PubMed] [Google Scholar]
- Wardemann, H., Yurasov S., Schaefer A., Young J.W., Meffre E., and Nussenzweig M.C.. 2003. Predominant autoantibody production by early human B cell precursors. Science. 301:1374–1377. 10.1126/science.1086907 [DOI] [PubMed] [Google Scholar]
- Woodruff, M.C., Ramonell R.P., Nguyen D.C., Cashman K.S., Saini A.S., Haddad N.S., Ley A.M., Kyu S., Howell J.C., Ozturk T., et al. 2020. Extrafollicular B cell responses correlate with neutralizing antibodies and morbidity in COVID-19. Nat. Immunol. 21:1506–1516. 10.1038/s41590-020-00814-z [DOI] [PMC free article] [PubMed] [Google Scholar]
- Xiao, M., Zhang Y., Zhang S., Qin X., Xia P., Cao W., Jiang W., Chen H., Ding X., Zhao H., et al. 2020. Antiphospholipid antibodies in critically ill patients with COVID-19. Arthritis Rheumatol. 72:1998–2004. 10.1002/art.41425 [DOI] [PMC free article] [PubMed] [Google Scholar]
- Yang, L., Xie X., Tu Z., Fu J., Xu D., and Zhou Y.. 2021. The signal pathways and treatment of cytokine storm in COVID-19. Signal Transduct. Target Ther. 6:255. 10.1038/s41392-021-00679-0 [DOI] [PMC free article] [PubMed] [Google Scholar]
- Yang, Y.H., Huang Y.H., Chuang Y.H., Peng C.M., Wang L.C., Lin Y.T., and Chiang B.L.. 2005. Autoantibodies against human epithelial cells and endothelial cells after severe acute respiratory syndrome (SARS)-associated coronavirus infection. J. Med. Virol. 77:1–7. 10.1002/jmv.20407 [DOI] [PMC free article] [PubMed] [Google Scholar]
- Yarkoni, Y., Getahun A., and Cambier J.C.. 2010. Molecular underpinning of B-cell anergy. Immunol. Rev. 237:249–263. 10.1111/j.1600-065X.2010.00936.x [DOI] [PMC free article] [PubMed] [Google Scholar]
Associated Data
This section collects any data citations, data availability statements, or supplementary materials included in this article.
Supplementary Materials
presents the demographics of subjects used in this study.


