

Abstract
Cells display complex intracellular organization through compartmentalization of metabolic processes into organelles, yet neither the resolution of these structures in the native tissue context nor their functional consequences are well understood. Here, we resolved the 3-dimensional organelle structural organization in large (>2.8×105μm3) volumes of intact liver tissue (15 partial or full hepatocytes per condition) in high resolution (8nm isotropic pixel size) by utilizing enhanced Focused Ion Beam Scanning Electron Microscopy (FIB-SEM)1,2 imaging, followed by deep-learning-based automated image segmentation and 3D reconstruction. We also performed a comparative analysis of subcellular structures in liver tissue of lean and obese animals and found substantial alterations, particularly in hepatic endoplasmic reticulum (ER), which undergoes massive structural re-organization characterized by marked disorganization of stacks of ER sheets3 and predominance of ER tubules. Finally, we demonstrated the functional importance of these structural changes upon experimental recovery of the subcellular organization and its impact on cellular and systemic metabolism. We conclude that hepatic subcellular organization and ER’s architecture is highly dynamic, integrated with the metabolic state, and critical for adaptive homeostasis and tissue health.
Organs and tissues exhibit distinct features of structural organization at various scales to meet functional demands and adapt to challenges to maintain homeostasis and viability4. At the subcellular level, metabolically specialized cells also present distinct morphological and spatial organization of organelles5,6, which likely plays a role in compartmentalizing and partitioning of metabolic processes, to increase functional diversity and provide metabolic flexibility. Therefore, the intracellular architecture of organelles is directly related to the cell’s specialized function and it is critical to explore intracellular structural properties in their native tissue environment to understand structure-function relationship in health and disease. For example, cells that secrete high amounts of proteins such as pancreatic acinar or plasma cells are filled with rough ER in the form of stacked sheets5, whereas steroid/lipid hormone secreting Leydig cells have a vast network of smooth tubular ER6. Cells in these classes, generally execute one predominant function such as protein or lipid synthesis and exhibit a more static or stable homogenous structural state of the ER to support that particular function, whereas other cell types exhibit more diverse subcellular organization. A major challenge is the extreme difficulty in resolving organelle structure and organization in the native tissue context in vivo, especially for organelles with complex architecture such as endoplasmic reticulum (ER). This is in part due to technical limitation to study at high spatial resolution in large volumes of tissue with the existing and commonly used microscopy approaches and analytical platforms. Most of the studies on organelle architecture and cellular organization have been performed in model organisms such as yeast or cultured cells and provided valuable information7–11. However, specialized cells of mammals in their native tissue environment present a more complex organization that may not be fully and accurately captured in these systems.
Segmentation of hepatic organelles
In order to establish structure-function relationship between organelle architecture and metabolic function in homeostasis and disease, we chose to study hepatocytes in their native liver tissue environment. These cells are charged with pleiotropic metabolic functions and present highly heterogenous organelle structures to, presumably, support their multifunctionality. To capture the full resolution of in vivo hepatocyte subcellular structures in liver and explore a comparative analysis of normal and obese tissue, we took advantage of enhanced FIB-SEM imaging, a technique that uses scanning electron microscopy to scan the surface of a volume, followed by milling of the surface with a focused ion beam. Recent advances in FIB-SEM imaging technology1,2 substantially expanded the imaging volume while maintaining isotropic nanometer resolution, thus allowing us to image large intact volumes of liver at a voxel size of 8 nm in x, y, and z dimensions. Using this approach, we obtained a volume of 277119 μm3 comprising 5638 consecutive images for the liver derived from a lean mouse, (Fig. 1a, c, Supplementary Video 1) and a volume of 375743 μm3 comprising 7896 consecutive images for the liver derived from an obese mouse (Fig. 1b, d, Supplementary Video 2).
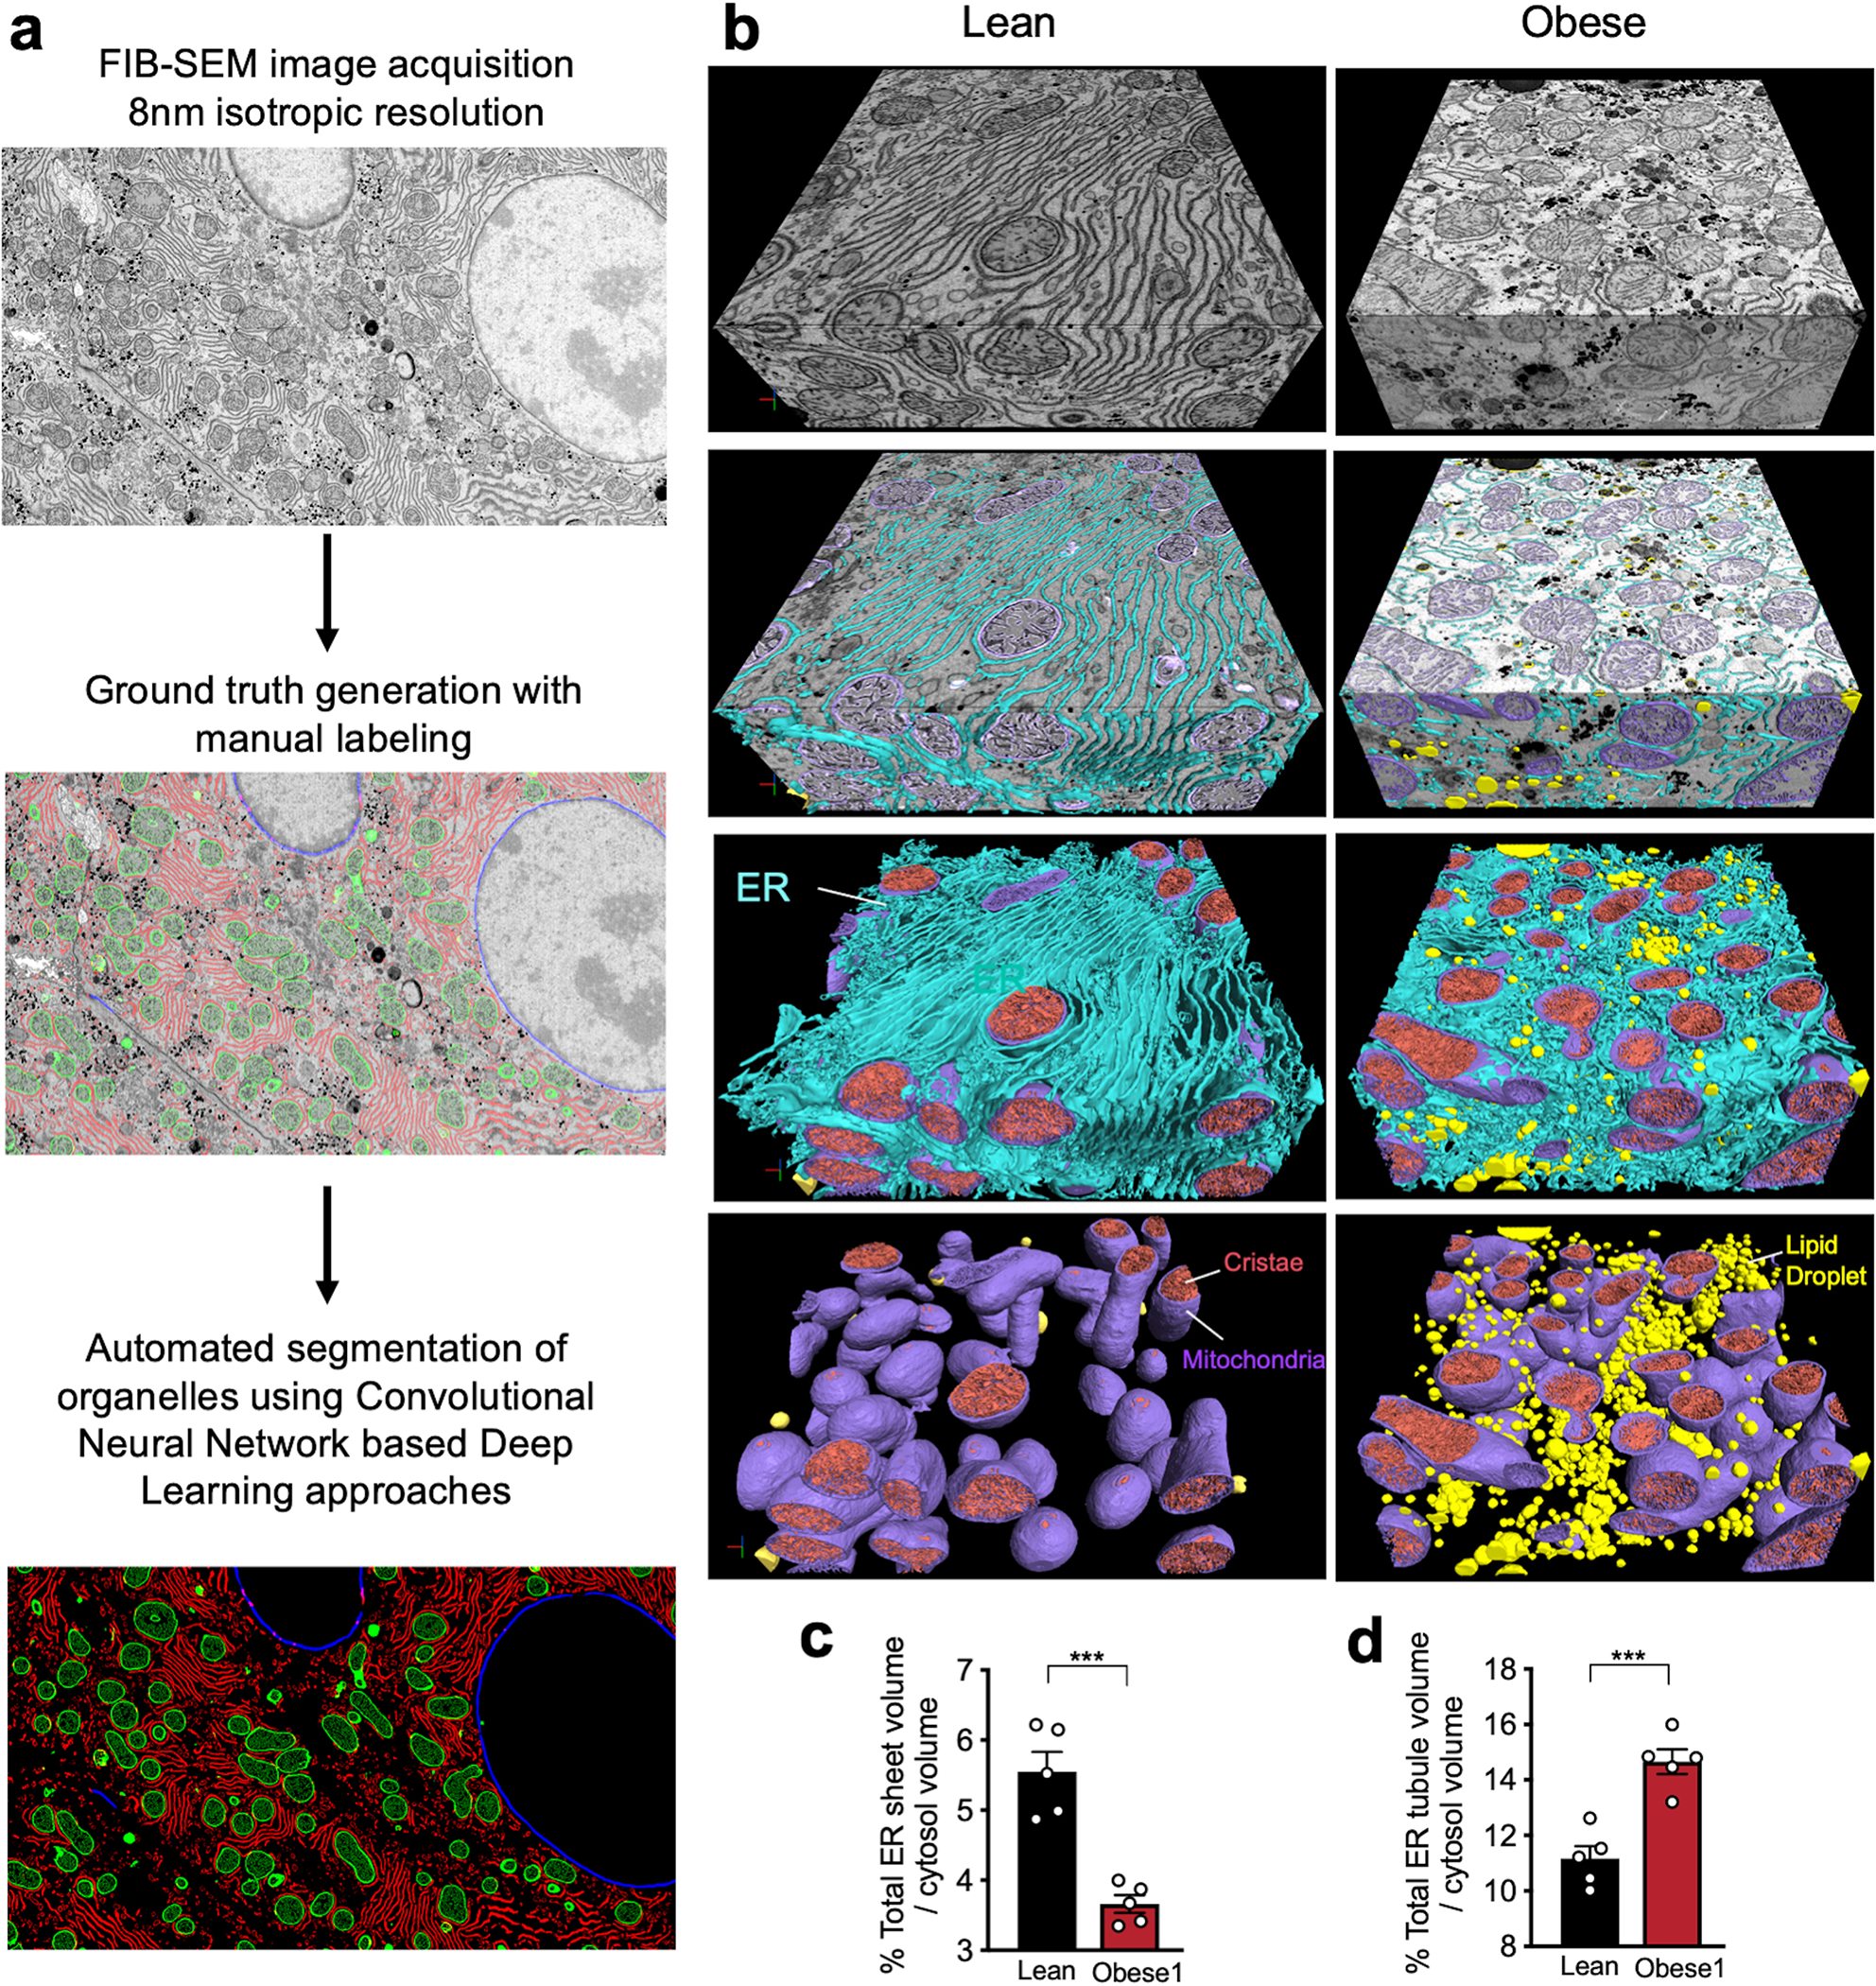
Fig. 1 |. FIB-SEM imaging and automated deep-learning-based segmentation of organelles from intact liver tissue derived from lean and obese mice.
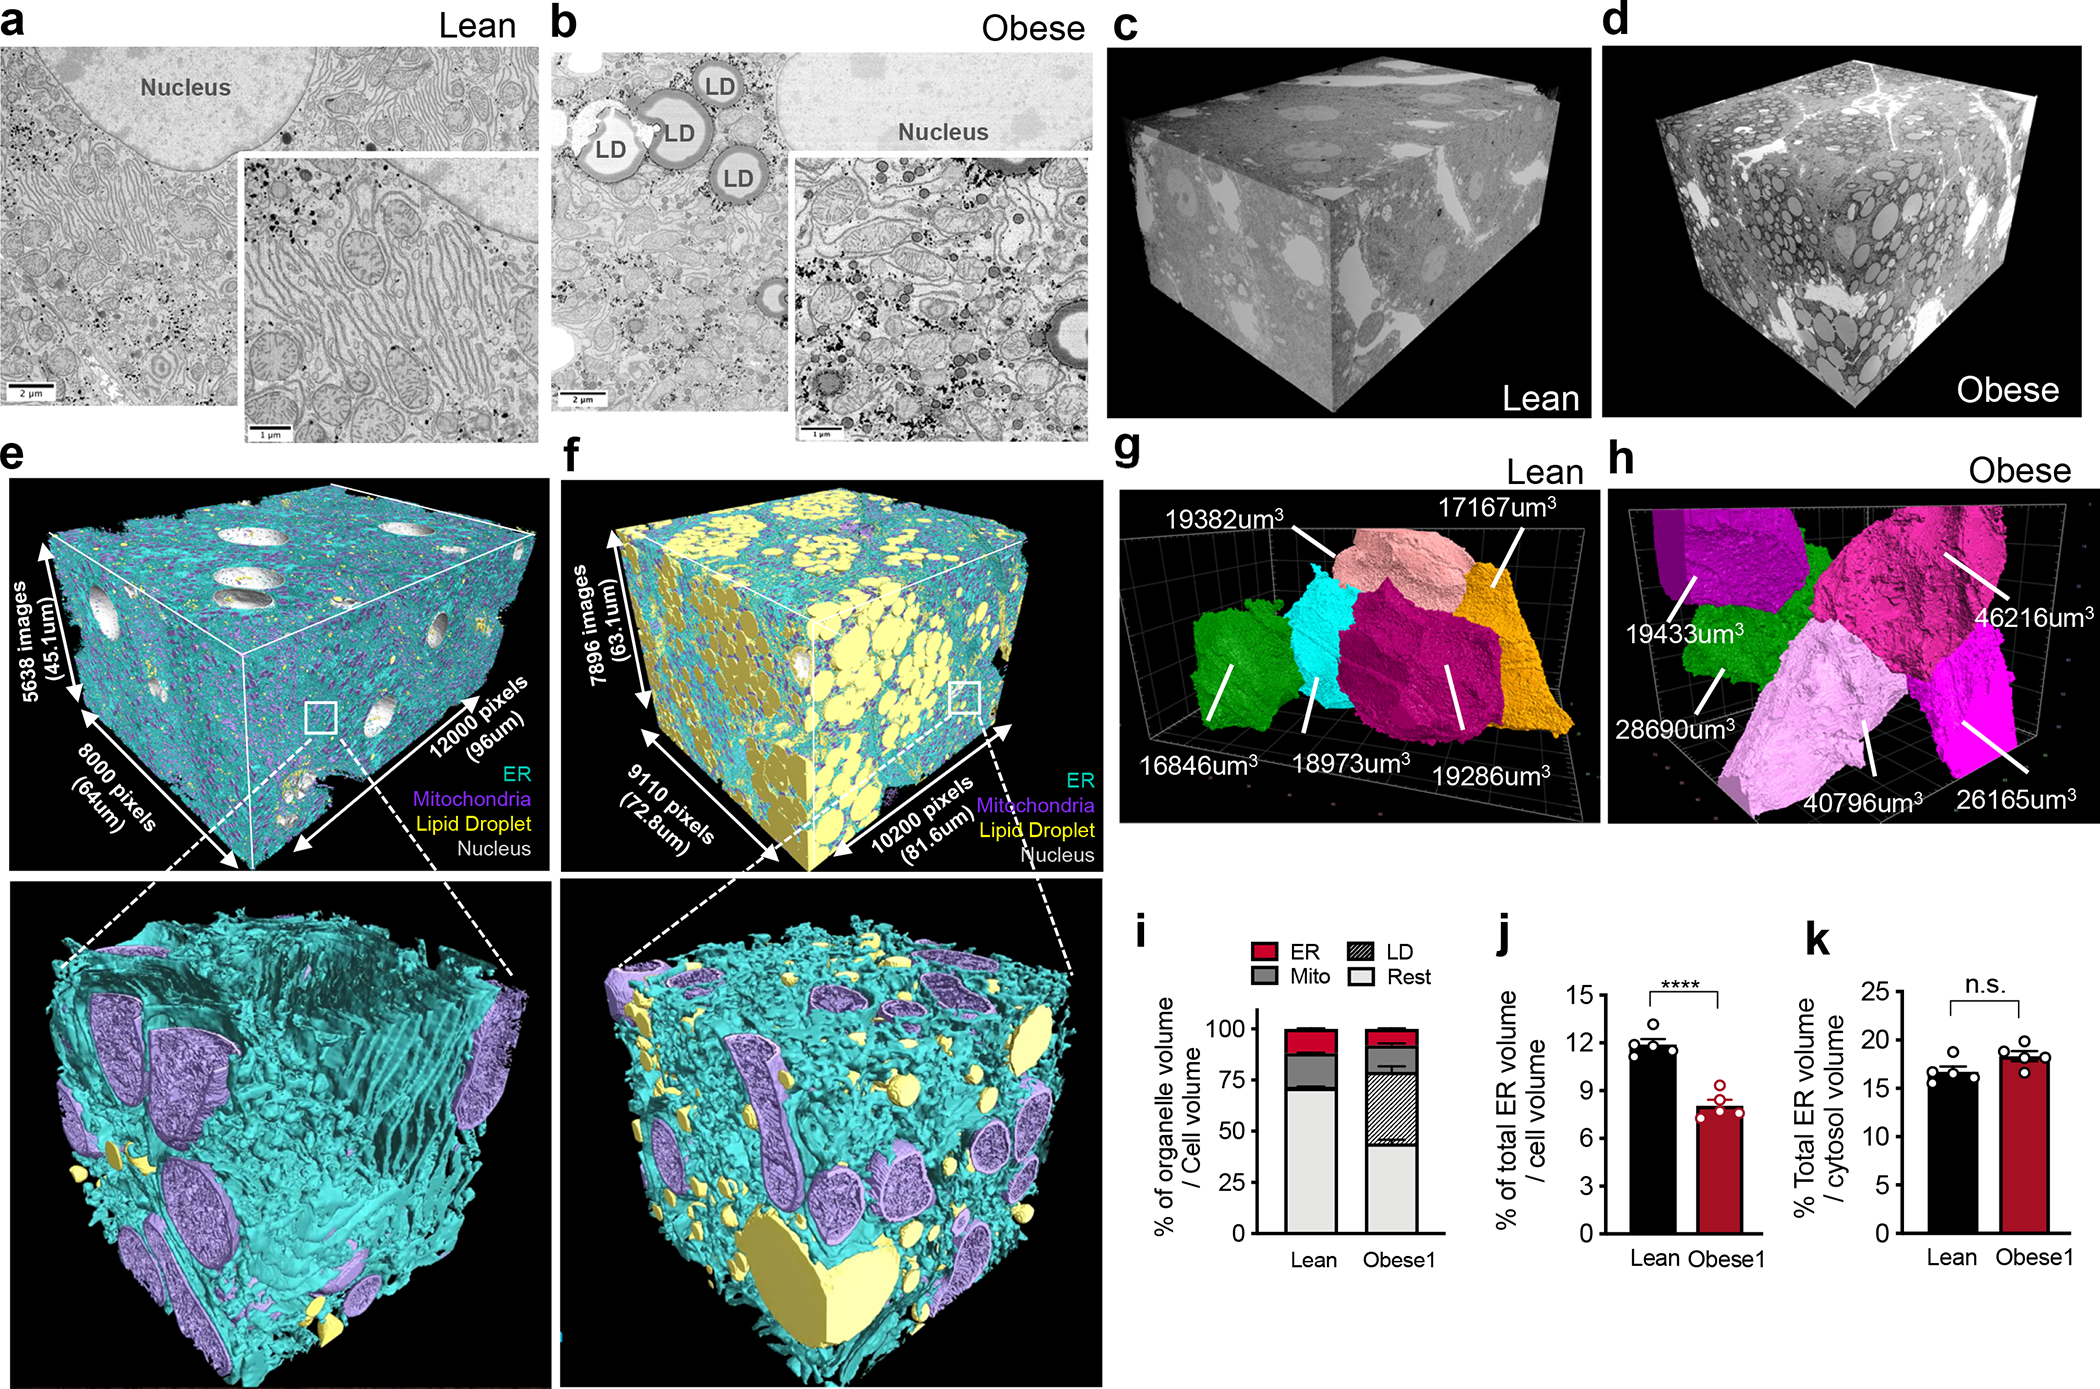
a, b, Single section SEM of liver from lean and obese mice liver in fed state at 8 nm pixel size. c, d, 3D reconstruction of FIB-SEM images derived from liver volumes from (c) lean and (d) obese mice (Supplementary Videos 1, 2). e, f, Convolutional neural network based automated segmentation of liver volumes derived from lean (e) and obese (f) mice. The dimensions of the volumes are depicted in the figure. ER (endoplasmic reticulum, blue), Mito (mitochondria, purple) LD (lipid droplet, yellow), Nucleus (gray). Inset images show 500×500×500 voxel magnified volume from the whole datasets (Supplementary Videos 3, 4). g, h, Reconstruction of 5 full or partial hepatocyte volumes present in the liver volume imaged by FIB-SEM. The volumes of the cells are depicted in the figure. All the reconstructions were performed in Arivis Vision 4D software. i, Percent of organelle volume normalized by total cell volume; n=5 cells for lean and obese mice. j, Percent of total ER volume normalized by cell volume in 5 different cells derived from lean and obese mice (***p<0.0001). k, Percent of total ER volume area normalized by cytosol volume (here cytosol was considered as the cell volume minus the volume occupied by lipid droplets, mitochondria, and ER). n=5 for each group. All data (Fig. 1i–k) are presented as mean values +/− SEM. Unpaired t-test was used for all the statistical analyses.
An additional major challenge of using this method is the identification, segmentation and quantification of each sub-cellular structure within the cell they belong as it is not possible to achieve this task in a high-throughput manner with manual annotation. To overcome this challenge, we took advantage of machine learning based approaches and utilized convolutional neural networks to automatically segment organelles (ER, mitochondria, cristae, lipid droplets, peroxisomes, and Golgi), plasma membrane and the nuclear membrane in a volume of 540 billion voxels in lean and 730 billion voxels in obese liver (Fig. 1e, f, Supplementary Videos 3, 4, Supplementary Table 1), following the pipeline in Extended Data Fig. 1a, b. The success rate of segmentation for all classes was determined by the evaluation of the voxel and object-level precision, recall and f1-score (Supplementary Table 2 and 3). To exclude the non-cell volume occupied by blood vessels and sinusoids, we quantified morphological characteristics of the segmented organelles in the 5 largest cell volumes in each dataset as shown in Fig. 1g, h. A whole hepatocyte volume from the lean tissue was around 19×103μm3, whereas obese cell was 40×103μm3. We observed that the lipid droplet content was less than 1% in the cells from lean mouse and increased to 30 to 34% in the obese cells. The mitochondria volume corresponded to 16% in lean and 13%–16% in obese cells (Fig. 1i). The total ER volume corresponded to ~12% of total cell volume in the lean hepatocytes and decreased to ~8% in the hepatocytes from obese mice (Fig. 1j). However, when we normalized the total ER volume present in the cells per cytosolic volume only, we verified that lean and obese cells present comparable ER volumes (Fig. 1k). These results indicate that obesity does not alter the amount of total ER volume per se, and the apparent decreased volume ratio can be attributed by the increase in cell size due to lipid droplet accumulation.
Obesity induces ER structural remodeling
When comparing lean and obese samples, we noticed striking differences in the organization and composition of the ER membranes in the cells. This led us to focus our analysis to the ER in greater detail. Morphologically, ER comprises a continuous network of interconnected membranes subdivided into the perinuclear ER, which wraps the nucleus and peripheral ER, seen as a network of tubular shaped membranes devoid of ribosomes (smooth ER) along with stacked flat sheets formed by two flat membrane bilayer characterized by the presence of ribosomes (rough ER)12–15. As shown in Fig. 2a, b, Supplementary Videos 5–6, through our imaging and reconstruction, we obtained an unprecedented resolution of ER sheets and tubules which have not been possible to examine in 3D in native large tissue volumes. Using this approach, we observed a predominance of well-organized parallel sheets of ER in cells from lean tissue and a dramatic reduction and disorganization of these structures in obese liver, along with an enrichment of tubules (Fig. 2c, d, Supplementary Videos 7–8). In order to quantify the transitions of ER subdomains in these conditions, we re-segmented the ER volume separating the ER sheets from tubules. For that, we manually labeled around 20 consecutive binary ER mask images, generated ground truth and utilized a U-Net neural-network-based approach to separate ER into these 2 subdomains (Fig. 2e, f). As shown in Fig. 2g and Extended Data Fig. 1c, the percent of ER sheets per total cell and cytosolic volume is significantly decreased in obese hepatocytes while the ER tubules are significantly increased per cytosolic volume (Extended Data Fig. 1d). In liver tissue derived from lean mouse in the fed state, the ER sheets corresponded to 30–35% of total ER volume (Fig. 2h). The ER sheet/tubule volumetric ratio corresponded to 49–55% (Fig. 2i), reflecting these cells’ synthetic and anabolic state. In obesity however, we detected a significant reduction of ER sheets that corresponded to ~18 to 20% of the total ER volume (Fig. 2h) and a markedly decreased sheet/tubule volumetric ratio of 25% (Fig. 2i).
Fig. 2 |. Large tissue FIB-SEM imaging reveals hepatic ER sheet / tubule ratio is decreased in obesity.
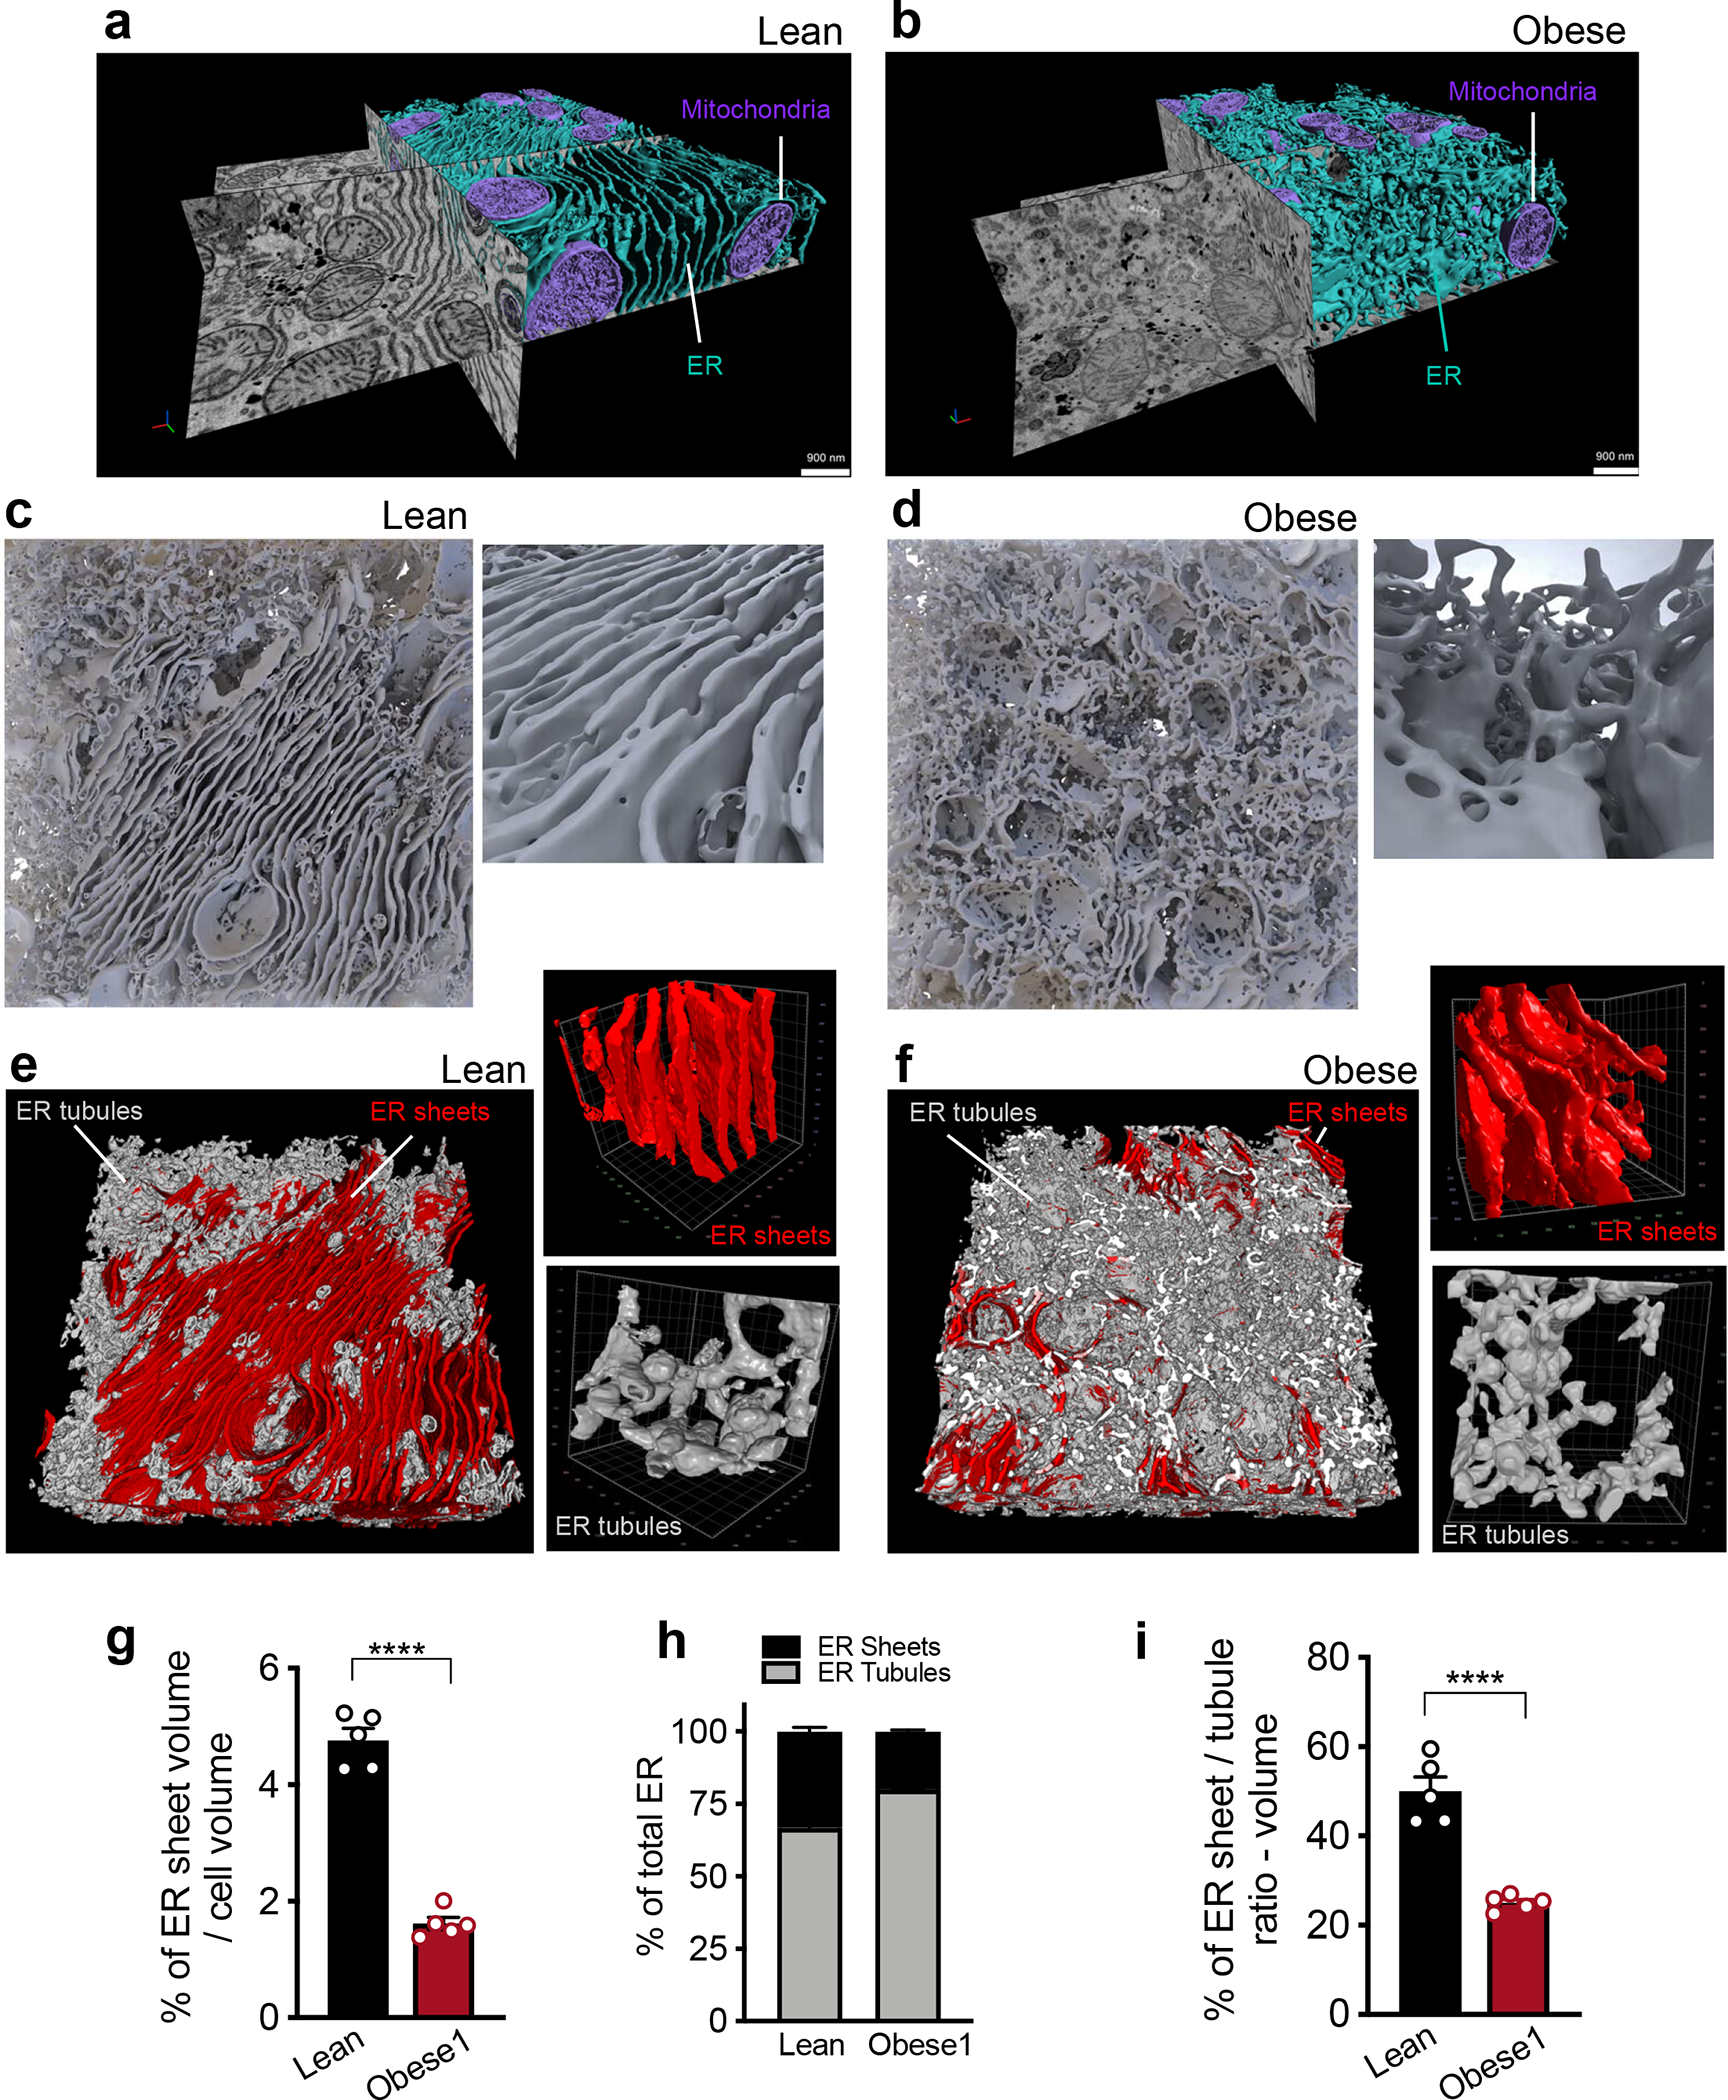
a, b, Partial reconstruction of segmented ER and mitochondria from raw FIB-SEM data derived from hepatocytes of (a) lean and (b) obese mice (Supplementary Videos 5, 6). c, d, 3D reconstruction of segmented ER morphology from lean (c) and obese (d) liver (1000×1000×400 voxels – 8×8×3.2μm3). 3D reconstruction images were generated using Houdini (SideFX) software. Inset shows the ER sheets and tubules in higher magnification (Supplementary Videos 7–9). e, f, Sub-segmentation and 3D reconstruction of ER sheets (red) and tubules (gray) from lean (e) and obese (f) mice. Magnifications show 100×100×100 voxel representation of ER sheets and tubules separately. g, Percent ER sheet volume normalized by cell volume. n=5 cells for the 2 datasets (****p<0.0001). h, Percent of ER sheets (black) and tubules (gray) relative to total ER from lean and obese cells. n=5 cells in each group. i, Ratio of ER sheets to tubule volume (****p<0.0001). n=5 cells in each group. All data (Fig. 2g–i) are presented as mean values +/− SEM. Unpaired t-test was used for all the statistical analyses.
In addition to the decreased abundance of ER sheets, we also observed that the organization and parallelism of the sheets were disturbed in obesity (Fig. 2e, f insets). To quantify the parallel organization of ER sheets in a higher number of biological replicates, we performed TEM images from livers, where the whole hepatocyte mid-cross-sectional area was captured (~20 full hepatocytes, 4 mice per condition). We manually annotated the ER sheets, generated binary ER masks and applied an algorithm to segment the ER traces that are found in parallel-arrayed organization (Extended Data Fig. 2a) and validated this system in reference cells (Extended Data Fig. 2b and 2c). Based on this algorithm, we confirmed that obesity led to a reduction in parallel-stacked organization of ER sheets per total ER (Extended Data Fig. 2d–j). These data demonstrate that the transition from a physiological to pathological state in obesity is associated with drastic changes in hepatic ER architecture characterized by disorganization and loss of ER sheets and a predominance of ER tubules.
In liver, ER sheets are often studded with ribosomes forming the rough ER, while the ER tubules are mostly devoid of ribosomes3. Given the striking decrease in parallel organized stacks of ER sheets in obese livers, we evaluated the abundance of rough and smooth ER by performing differential centrifugation analysis. To validate the efficiency of the fractionation, we performed immunoblotting for classical markers of different subcellular compartments (Extended Data Fig. 3a) and imaged the recovered ER fractions by TEM (Extended Data Fig. 3b, c). The amount of rough ER normalized by tissue weight was significantly reduced in obese livers (Extended Data Fig. 3d) while the amount of smooth ER was higher (Extended Data Fig. 3e). Accordingly, the ratio of rough to smooth ER was significantly lower in obese livers (Extended Data Fig. 3f).
The different ER subdomains such as rough ER sheets or smooth ER tubules, are shown to be enriched with distinct proteins16. Translocon complex and membrane bound polysomes preferentially localize to ER sheets3,16. Accordingly, endogenous staining of Sec61β, a key component of the translocon complex, showed its segregation to the ER sheets in lean primary hepatocytes, shown as “patches” (Extended Data Fig. 3g). In contrast, the expression of Sec61β was largely decreased and diffused throughout the whole ER in hepatocytes from obese animals (Extended Data Fig. 3g). A similar decrease was also detected in liver sections from obese mice compared with lean controls (Extended Data Fig. 3h). Sec61α, Sec61β and the translocon-associated protein TRAPα expression were also significantly decreased in lysates from obese mice (Extended Data Fig. 4a). Notably, the expression levels of Sec61α, Sec61β and TRAPα in the rough ER fraction isolated from livers were not different between experimental groups, indicating that the decreased total levels of these proteins may reflect primarily the loss of ER sheets rather than a decrease in the translocon complex per rough ER unit (Extended Data Fig. 4b). Interestingly, we found that the expression levels of the ER chaperone GRP78 were differently regulated between the RER and SER. While in the lean hepatocytes GRP78 was preferentially found in the rough ER, in the obese state this protein was equally distributed or even higher in the smooth ER (Extended Data Fig. 4c). Thus, one clear consequence of the loss of ER sheets in hepatocytes from obese mice is the disruption of proper representation and localization of its resident proteins.
The shape of the ER sheets and tubules is determined by several factors including the relative abundance of ER membrane shaping proteins. In mammalian cells, the structure of the tubular ER is determined by the Reticulons and REEPs14,15,17. The proteins involved in the formation of ER sheets are less understood and fewer in number. It’s known that the intraluminal space formed between the two ER membranes is established by the presence of a protein called Cytoskeleton-Linking Membrane Protein 63, Climp-63 (or CKAP4)13,18,19. Other proteins, such as RRBP1 (p180), are also shown to influence or stabilize ER sheets, yet the impact of p180 on ER sheet formation in mammalian cells is unclear13,20. The relative ratio of ER sheets and tubules is a consequence of a tug of war between ER shaping proteins. In cultured cells, overexpression of Reticulon-homology-domain containing proteins drive ER tubule formation and decrease the abundance of ER sheets, whereas overexpression of Climp-63 leads to enrichment of ER sheets13,17.
In order to determine whether the loss of ER sheets in obese livers is related to alterations in the expression of the ER shaping proteins, we evaluated their expression profile in total liver lysates and isolated ER microsomes from lean and obese mice. The purity of the ER fractionation is shown in Extended Data Fig. 5a. Although no significant differences were observed in Climp-63 expression in total lysates (Fig. 3a), this protein was significantly decreased in the total ER fraction from obese mice (Fig. 3b), whereas p180 protein was reduced in both total lysates and ER microsomes (Fig. 3a, b). As expected, the expression of Climp-63 and p180 were enriched in the rough ER of liver tissue (Extended Data Fig. 5b, c). In contrast, the expression levels of proteins involved in tubular ER formation, such as Reticulon4b (Rtn4b) and Reep5, were increased in obesity in both the total lysates and total ER fraction (Fig. 3a, b). These proteins were preferentially found in the smooth ER fractions (Extended Data Fig. 5b, c). All the antibodies used for these experiments were validated using either positive (overexpression) or negative (deletion) controls (Extended Data Fig. 5d–f). Thus, the altered regulation of the abundance of ER shaping proteins promoted by obesity is likely a mechanism by which obesity shifts the balance of ER sheet/tubule ratio.
Fig. 3 |. ER shaping proteins are regulated with obesity and exogenous expression of ER shaping proteins regulates metabolic function of hepatocytes.
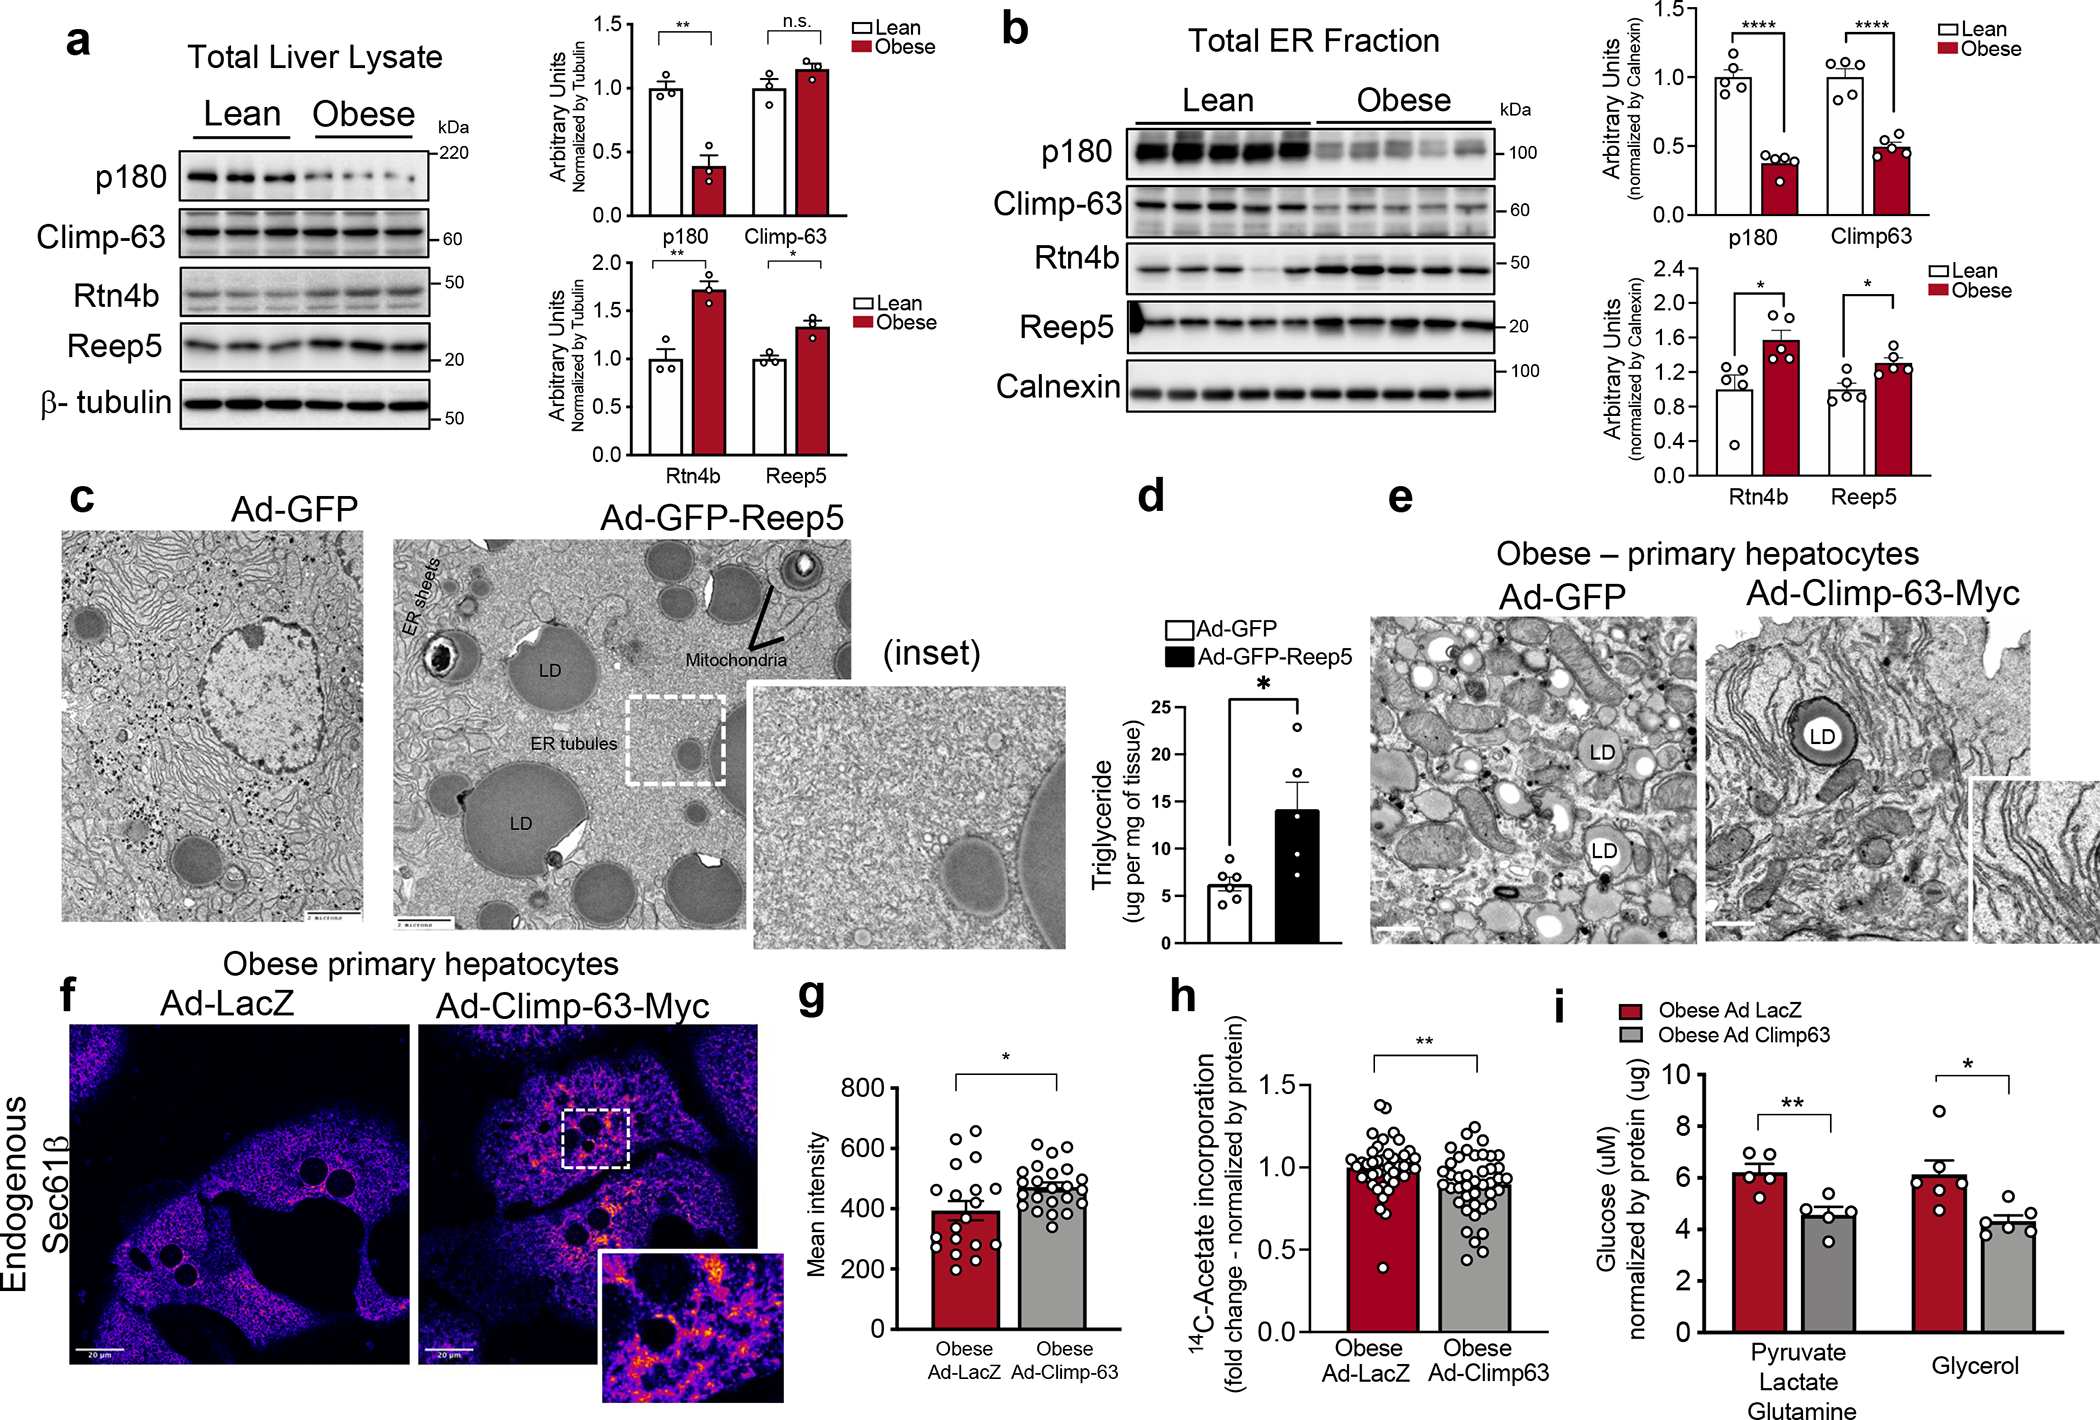
a, Left panel: Immunoblot analysis of indicated proteins in total liver lysates. Right panel: Quantification of the immunoblots. n=3 for lean and obese (*p<0.03, **p<0.005). b, Left panel: Immunoblot analysis of indicated proteins from ER fraction isolated from livers of lean and obese mice. Right panel: Quantification of the immunoblots. n=5 for lean and obese (*p<0.021, ****p<0.0001). c, Representative TEM images from liver sections of lean mice expressing either Ad-GFP control or Ad-Reep5. Ad: Adenovirus. Inset shows the ER organization in more detail. d, Triglyceride content of livers from lean mice expressing either Ad-GFP control (n=6 mice) or Ad-GFP-Reep5 construct (n=5 mice) (*p=0.016). e, Representative TEM from primary hepatocytes derived from obese mice exogenously expressing GFP (left) and Climp-63-Myc (right). f, Confocal images of immunofluorescence staining for endogenous Sec61β in primary hepatocytes from obese mice expressing Ad-LacZ (left) and Ad-Climp-63-Myc (right). g, Quantification of fluorescence signal. n=19 fields for Ad-LacZ and n=23 fields for Ad-Climp-63 (*p=0.0241), representative of 3 experiments. h, De novo lipogenesis assay in primary hepatocytes isolated from obese mice, expressing Ad-LacZ (control) or Ad-Climp-63. 14C-labeled acetate incorporation into the newly synthesized lipids was measured and normalized by total protein (**p=0.0089). n=42 measurements (from 5 mice per group), combined from 5 independent experiments. i, Gluconeogenesis assay in primary hepatocytes isolated from obese mice, expressing Ad-LacZ or Ad-Climp-63 (*p=0.0109, **p=0.0058). Cells were treated with the indicated gluconeogenic substrates in the presence of 100nM glucagon for 3 hours. n=5 biological replicates for pyruvate, lactate and glutamine and n=6 biological replicates for glycerol condition. All data (Fig. 3a–c, g–i) are presented as mean values +/− SEM. Unpaired t-test was used for all the statistical analyses.
ER morphology affects metabolic function
Given the findings described above, we asked whether manipulating ER shape in order to alter the ER sheet/tubule ratio would impact ER function and metabolic output in hepatocytes in lean and obese mice in vitro and in vivo. We designed different strategies to interrogate this paradigm. First, we tested whether inducing an enrichment of ER tubules in lean healthy hepatocytes would result in metabolic alterations characteristic of the obese phenotype. Several proteins are shown to drive ER tubules and redundance exists among them. The common feature of these proteins is the presence of the reticulon homology domain, that when inserted in the membrane promotes curvature, generating the tubules. We first tested the exogenous expression of Reep5 (DP1) in livers from lean mice. TEM analysis of this model showed a marked enrichment of ER tubules, without eliminating parallel organized ER sheets (Fig. 3c). Metabolically, this approach led to increased liver lipid droplet accumulation (Extended Data Fig. 6a), higher hepatic triglyceride content (Fig. 3d) and increased levels of SCD1, a key enzyme for de novo lipogenesis (Extended Data Fig. 6b). Interestingly, the lipid droplets were presented in areas surrounded by the enriched ER tubules (Fig. 3c). In this model, we did not detect loss of ER sheets as observed in obesity and no changes were evident in glucose homeostasis in the lean mice (Extended Data Fig. 6c). To further substantiate these data, we expressed the full length RTN4A protein or its reticulon homology domain (Rtn-HD), in the livers of lean mice (Extended Data Fig. 6d–e). These approaches also led to increased levels of lipid droplets in liver (Extended Data Fig. 6f), higher hepatic triglycerides and increased SCD1 expression (Extended Data Fig. 6g–h) compared with control livers. Thus, changing ER architecture towards tubule formation in the liver, in multiple vivo models, resulted in alterations in lipid metabolism resembling pathologies that occur in obesity.
Next, we asked whether we could employ an alternate strategy to increase the abundance of ER sheets in primary hepatocytes derived from lean and obese mice and thus rescue the major loss of this ER domain promoted by obesity. To induce the proliferation of ER sheets, we used Climp-63 overexpression as an experimental system. We first confirmed the strong proliferation of ER sheets upon Climp-63 expression in cultured cells as shown previously13 (Extended Data Fig. 7a–b). We then produced an adenovirus expressing Climp-63 to deliver this protein to primary hepatocytes isolated from lean and obese mice. Exogenous expression of Climp-63 in primary hepatocytes led to marked proliferation of ER sheets as shown by the enrichment of “patches” examined by an ER marker and by TEM (Extended Data Fig. 7c and Fig. 3e). Additionally, overexpression of Climp-63 resulted in recovery of Sec61β expression and localization to the ER sheets in obese hepatocytes, as demonstrated by a large colocalization between Sec61β and Climp63-myc signal (Fig. 3f–g and Extended Data Fig. 7d).
Rescue of ER sheets improves metabolism
We then evaluated the impact of ER re-shaping towards increased sheet formation in hepatocytes on metabolic function. As shown in Fig. 3h, increasing ER sheet/tubule ratio by Climp-63 resulted in decreased levels of de novo lipogenesis measured by 14C labeled acetate incorporation into fatty acids. Additionally, exogenous expression of Climp-63 led to decreased glucose production in primary hepatocytes from obese mice, driven by different gluconeogenic substrates (Fig. 3i). No difference between genotypes were detected in lean hepatocytes, excluding nonspecific effects (Extended Data Fig. 7e). Thus, correcting the architectural organization of the ER in hepatocytes from obese mice is sufficient to improve metabolic function and demonstrates that ER shape directly affects the hepatocyte metabolic program and impacts both glucose and lipid homeostasis. Given the promising results in vitro, we tested whether enrichment of ER sheets through Climp-63 overexpression could impact liver and systemic metabolism in vivo. For that, we delivered LacZ or Climp-63 adenoviruses to livers of 10-week-old obese mice. To evaluate the efficacy of gain-of-function Climp-63 in rescuing ER sheets in livers of obese mice in vivo, we performed FIB-SEM analysis. As shown in Fig. 4a and Extended Data Fig. 8a–k, data from 5 different full hepatocytes show that overexpression of Climp63 led to significant proliferation of ER sheets in obese liver and restoration of the ER sheets/tubule ratio (Fig. 4b, c and Extended Data Fig. 8l, m). FIB-SEM analysis also showed that the increased mitochondria associated membranes (MAMs)21 and lipid droplets in obesity were significantly reduced by Climp-63 expression (Extended Data Fig. 8n–o) and mitochondria shape was more elongated, as measured by sphericity analysis (Extended Data Fig. 8p, q). We also performed TEM in samples from these livers to explore additional features of the ER organization and detected that in addition to recovery of ER sheets, Climp-63 overexpression led to recovery of the parallel organization of the ER sheets (Fig. 4d, e). Noticeably, ER sheets promoted by Climp-63 overexpression in liver tissue were decorated with ribosomes, similar to endogenous healthy ER sheets (Fig. 4d inset). Accordingly, the ratio between rough ER and smooth ER isolated from obese livers expressing Climp-63 was significantly higher than in obese livers expressing LacZ control (Extended Data Fig. 9a). It is interesting to note that the presence of ribosomes (rough ER) in exogenously-induced ER sheet formation was not observed in Cos7 cells (Extended Data Fig. 7b), thus illustrating the critical importance of the native context to establish structure/function relationship of the ER. The recovery of ER sheets in obese livers promoted by Climp-63 overexpression also led to normalization of ATF4 and CHOP levels, markers highly elevated in obesity (Extended Data Fig. 9b) and rescued the localization of the ER chaperone GRP78 preferentially to the ER sheets similar to what we observed in lean hepatocytes (Extended Data Fig. 9c). The total levels of GRP78 were not altered (Extended Data Fig. 9d, e). Altogether, these data show that exogenous expression of Climp-63 recovered ER sheets in obese livers and led to reorganization of ribosomes, translocon complex and chaperones to the same ER subdomain. This is consistent with the rescue of ER folding capacity in obese hepatocytes expressing Climp-63, which was decreased in obesity compared to lean controls, as determined by a genetic reporter22 based on the folding and secretion of the membrane protein asialoglycoprotein receptor 1 (ASGR1)22 (Extended Data Fig. 9f–h). Thus, correcting the architectural organization of the ER in hepatocytes of obese mice is sufficient to improve hepatic ER organization and proteostasis and may impact liver function23.
Fig. 4 |. Expression of Climp-63 in livers of obese mice improves systemic metabolism.
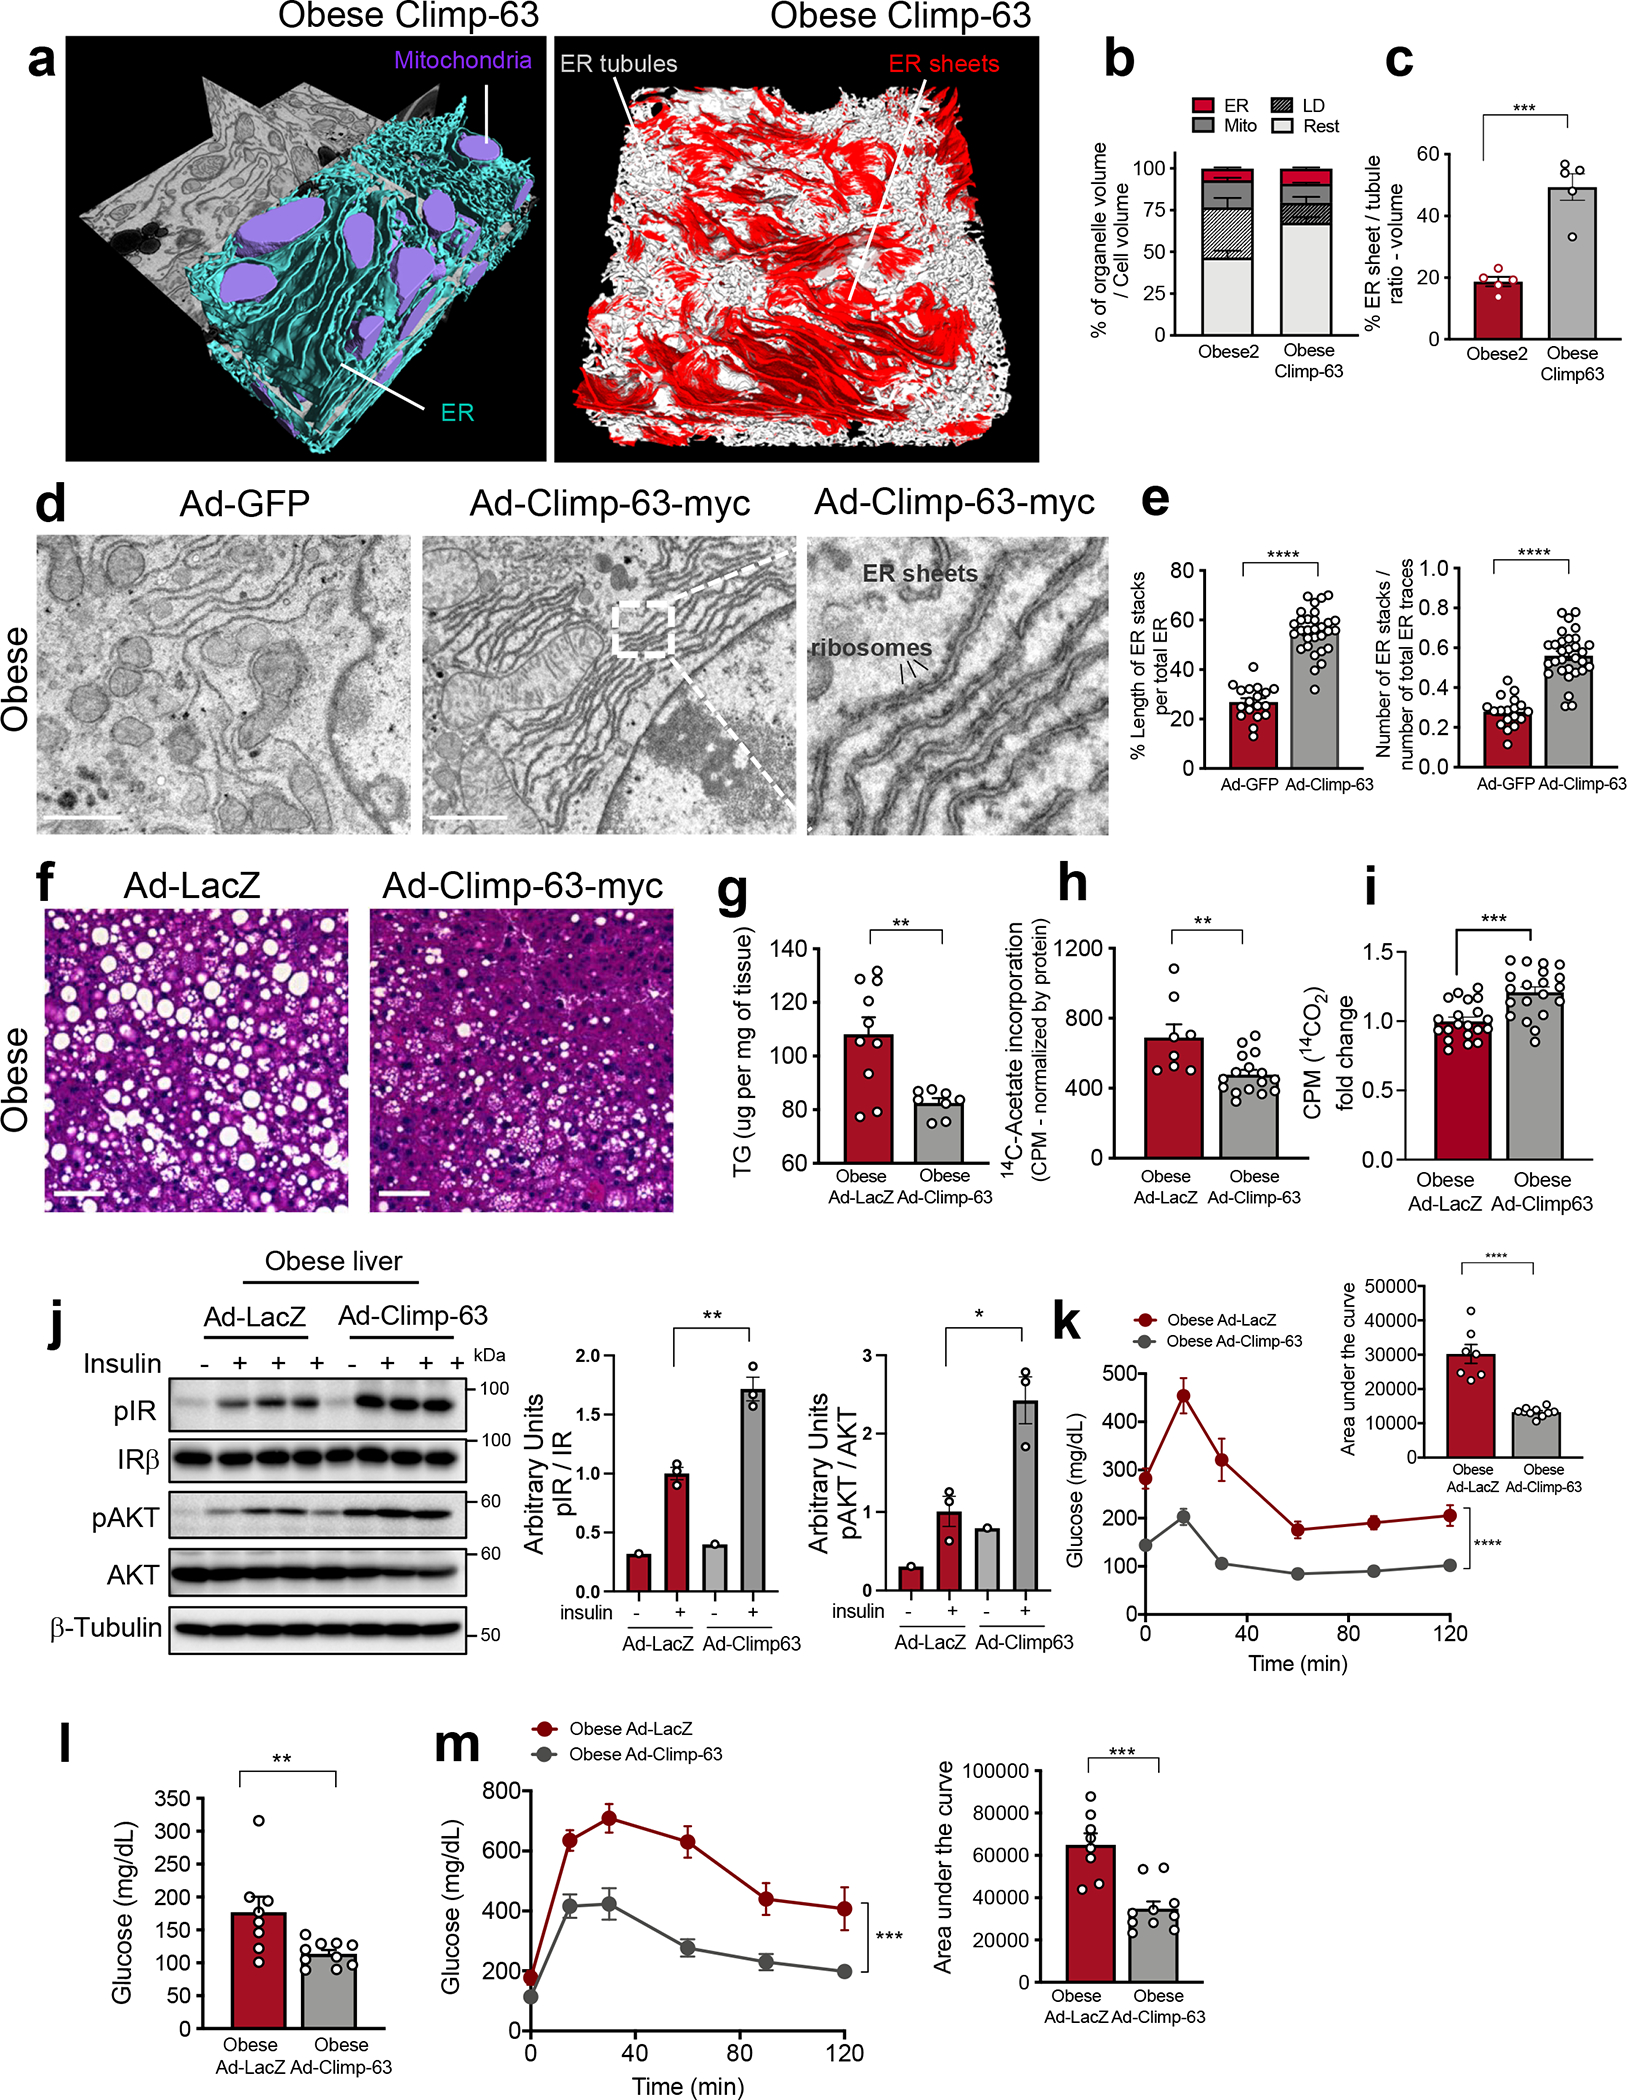
a, Segmentation of FIB-SEM from liver of obese mouse expressing Climp-63. b, Percent of organelle volume per cell; n=5 cells/group. c, Ratio of ER sheets to tubule volume in 5 cells/group (***p=0.0001). d, TEM from livers of obese mice expressing Ad-GFP (left) and Ad-Climp-63-Myc (right) Ad: Adenovirus. Scale: 1.118um. Inset: High-magnification image of ribosomes associated with ER sheets. e, Quantification of parallel stacks of ER in liver sections presented in Fig. 4d. n=18 for GFP and n=30 for Climp-63-myc TEM images of 3 mice per group (****p<0.0001). f, H&E staining of liver sections of obese mice expressing Ad-GFP (left) or Ad-Climp-63 (right). Scale bar: 65.4um. g, Liver triglyceride from Ad-LacZ (n=10) and Ad-Climp-63 (n=8) expressing obese mice (**p=0.0028). h, De novo lipogenesis assay; radioactivity normalized by mg of liver. n=8 liver lobes from 2 obese mice expressing Ad-LacZ and n=16 liver lobes from 4 obese mice expressing Ad-Climp-63 (**p=0.0037). i, 14C-palmitic acid-driven fatty acid oxidation in hepatocytes (obese) expressing Ad-LacZ (n=20) or Ad-Climp-63 (n=20). Pooled from 4 independent experiments (***p=0.0001). j, Left: Immunoblot of proteins in total liver lysates. Right: Quantification of immunoblots. n=3 for Ad-LacZ insulin+ and Ad-Climp-63 insulin+ (*p<0.017, **p=0.003). k, Insulin tolerance test in obese mice. n=7 for LacZ and n=10 for Climp-63-myc. Representative of 3 independent experiments (****p<0.0001). l, Blood glucose levels after overnight fasting. n=8 for Ad-LacZ and n=10 for Ad-Climp-63-myc (**p=0.0098). m, Left: Glucose tolerance test in obese mice expressing Ad-LacZ or Ad-Climp-63-myc. Right: area under the curve. n=8 Ad-LacZ and n=10 Ad-Climp-63-myc animals, representative of 3 independent experiments (***p=0.0002). All data (Fig. 4b,c,e,g–m) are presented as mean values +/− SEM. Unpaired t-test was used for all the statistical analyses, except for 4k-m. Two-way ANOVA was used in Fig. 4k,m.
The striking structural and functional alterations induced by Climp-63 in countering the abnormalities seen in obesity led us to examine the impact of recovery of ER sheets by gain of function of Climp-63 in cellular and systemic metabolism in detail in vivo. We first observed that Climp-63 overexpression led to a significant decrease in lipid accumulation in the livers of obese mice by both histological examination (Fig. 4f) and total hepatic triglyceride content (Fig. 4g). Because lipid content in hepatocytes is determined by a balance between lipid synthesis and lipid oxidation, we measured the effect of Climp-63 expression on these parameters. As shown in Fig. 4h, and in accordance with our observation in vitro (Fig. 3h), exogenous expression of Climp-63 led to decreased hepatocyte lipogenic capacity measured through the incorporation of 14C-labeled-acetate in de novo lipogenesis assay in vivo. Climp-63 gain of function also resulted in a dramatic decrease in the expression levels of the lipogenic enzyme SCD1, which was increased in the livers of Reep5 expressing lean mice. Interestingly, SCD1 is an ER membrane protein, the abundance of which is markedly increased in obesity. No changes were observed in expression levels of other lipogenic enzymes such as FAS and DGAT2 (Extended Data Fig. 10a). To determine the sub-ER localization of SCD1 we performed immunoblotting for this protein in RER and SER fractions from livers of lean, obese and obese overexpressing Climp-63. As shown in Extended Data Fig. 10b, SCD1 is increased similarly in RER and SER in obesity. This protein is downregulated by Climp63 overexpression in both fractions of the ER but more significantly in the smooth ER Extended Data Fig. 10c. Thus, one possible way that the manipulation of ER sheets/tubule ratio impact lipid metabolism is by directly affecting lipogenic enzymes residing in the ER.
Next, we determined the rates of fatty acid oxidation in isolated primary hepatocytes by treating the cells with 14C-labeled palmitate and collecting the released 14CO2. As shown in Fig. 4i, Climp-63 overexpression in obese hepatocytes promoted increased rates of fatty acid oxidation by mitochondria. Thus, in addition to the decreased de novo lipid synthesis, increasing ER sheets by Climp-63 results higher fatty acid oxidation in the mitochondria. These data are also consistent with the correction of the obesity-induced MAM enrichment21 and the changes in mitochondrial morphology (Extended Data Fig. 8o–q).
We next assessed the effect of exogenous expression of Climp-63 in liver tissues on insulin action and systemic glucose homeostasis. As shown in Fig. 4j, Climp-63 overexpression led to a marked increase in insulin signaling as determined by increased levels of insulin receptor (Tyr972) and AKT (Thr308) phosphorylation. Accordingly, obese mice expressing Climp-63 showed an improved insulin tolerance test compared with their controls (Fig. 4k). Climp-63 overexpression also resulted in decreased fasting blood glucose levels and a striking improvement in glucose clearance evaluated by a glucose tolerance test (Fig. 4l, m). These results are in accordance with our in vitro data showing that increased ER sheets by Climp-63 expression reduces gluconeogenic output in obese primary hepatocytes. Climp-63 overexpression in normal lean mice increases parallel organized ER sheets but does not impact metabolism, thus ruling out a non-specific suppression of glucose production (Extended Data Fig. 10d–h). Thus, correcting ER structure lifts the pressures of obesity on insulin sensitivity in the liver at multiple levels and demonstrates that ER shape directly affects hepatocyte metabolic program. However, we recognize that these conclusions are based on gain of function models and may require additional work to substantiate.
Discussion
In fact, in all systems and at all levels, structure is a critical determinant of function. In static systems, only a limited number of tasks can be achieved within the constraints of a rigid and inflexible construction. In living cells, the vast diversity and highly dynamic nature of tasks demand sub-cellular structural complexity as well as flexibility to support functional integrity and survival and to maximize the repertoire of proper and compartmentalized responses generated from biological infrastructure. Metabolic processes are also exceedingly complex and compartmentalized and demand high level of adaptive flexibility. Here, we used the ER as one of the central architectural assemblies of the cells and provide what we believe to be the most detailed characterization of the subcellular architecture in liver tissue in both health and disease context. This analysis included the precise visualization and quantification of hepatic tubular ER ultrastructure, a complex structure which has been very challenging to capture in detail in the tissue setting with other imaging approaches. Additionally, we examined structure-function relationship in the context of metabolic homeostasis in health and disease, using obesity as a model. The impact of the increased ER sheets on metabolism in obese mice may occur as a consequence of the activity and abundance of proteins/enzymes that are housed in this ER subdomain or maybe downstream of hormonal or metabolic signals that govern metabolic output. For example, we showed that rescuing ER sheets was reflected in the downregulation of the ER lipogenic enzyme SCD1, recovery of the localization of chaperone GRP78 and polysome association with ER sheets and impacted ER folding capacity and lipogenic activity. As the opportunity emerges to overcome the redundancies and regulate ER structure genetically with loss of function models, further studies may provide additional insights. Regardless, an exciting prospect of our observations is that structural regulation is a prerequisite for metabolic programming, and such a regulatory circuit could open up new avenues in understanding endocrine and metabolic homeostasis, including responses to hormonal or nutritional cues to determine the metabolic outcomes.
The data generated by this work provide the field a significant amount of information that can be further explored with different questions related to liver subcellular architecture. It’s important to highlight that this analysis involved extensive sample preparation, high resolution imaging, automated image segmentation and reconstruction. While all of which were extremely demanding processes in terms of human labor and computing power, in our view, this workflow allows precise understanding of the structure-function relationship in the native tissue context and how this could be possibly linked to metabolic function in health and disease and exploited for diverse therapeutic opportunities.
Methods
General animal care, study design and animal models:
All experimental procedures involving animals were approved by the Harvard T.H. Chan School of Public Health (HSPH) Institutional Animal Care and Use Committee. The mice were maintained from 6 to 12 weeks of age on a 12-hour-light /12-hour-dark cycle at room temperature in the Harvard T.H. Chan School of Public Health pathogen-free barrier facility with free access to water and standard laboratory chow diet (PicoLab Mouse Diet 20 #5058, LabDiet). As an animal model of obesity, we used the male leptin deficient B6.Cg-Lepob/J (ob/ob) mouse in the C57BL/6J genetic background (Stock no. 000632). As lean controls, we used aged and gender matched ob/+ hets (Jackson Labs, Stock no. 000632). For experiments in lean mice, we used male C57BL/6J mice (Jackson Labs, Stock no. 000664). These animals were purchased at 6–7 weeks of age and used for experimentation between 8–11 weeks of age. In animal experiments, all measurements were included in the analysis. Mice were randomly allocated to groups; only criteria were sex and age as explained above. The sample size and number of replicates for this study were chosen based on previous experiments performed in our lab and others22,24,25. No specific power analysis was used to estimate sample size. Imaging studies could not be done blinded due to the evident intrinsic features of the datasets. In vivo studies could not be blinded due to the adenoviral injection protocol. Experimental and control samples were processed together using the same conditions.
Adenovirus-mediated overexpression of Climp-63, Rtn4A, Rtn4-HD and Reep5:
For exogenous Climp-63 (CKAP4) expression, mouse Climp-63 tagged with Myc-DDK in the C terminal (Origene Catalog: MR215622) was cloned in an Ad5 backbone from Vector BioLabs. Full length human Rtn4A was obtained from Addgene (catalog: 61807) and the C-terminal GFP was removed and stop codon added before being cloned into adenoviral backbone. For exogenous expression of the Reticulon-homology domain (Rtn-HD) of the Reticulon 4 (Rtn4) protein, the N-terminal region of the human Rtn4 was deleted and the remaining segment (Rtn-HD) was fused with GFP. Reep5 was tagged with GFP in its N-terminal. GFP-Reep5 and GFP-RHD constructs were generated by Dr. Rapoport’s group26. The adenovirus (serotype 5, Ad5) was generated, amplified and double purified in CsCl by Vector Biolabs. The adenovirus was administered to 8 week-old ob/ob mice, at a titer of 1.1×10⁹ IFU/mouse or 10–12 week old lean B6 mice, at a titer of 1×10⁹ IFU/mouse. Metabolic studies were performed between day 7–12 after infection. The animals were sacrificed after 14 days of infection for ex vivo experiments.
Glucose and insulin tolerance tests:
For glucose tolerance test, animals were overnight fasted and subjected to an intraperitoneal (i.p.) glucose injection (Wt: 1.5 g kg−1, ob/ob: 1.0 g kg−1). Blood glucose levels were measured throughout the first 120 minutes of the glucose injection. For the insulin tolerance test, food was removed for 6 hours (from 9 am to 3 pm). Animals were subjected to an i.p. injection of insulin (Lilly, Humulin R, Wt: 0.8 U/Kg and ob/ob 1.5U/Kg). Insulin was diluted and prepared in 0.1% BSA.
Liver triglyceride measurements:
Liver tissues (~100mg) were homogenized in 1.2mL of water using a TissueLyser (Qiagen) for 5min, at 30f/s, 2 cycles at 4oC. Next, samples were vortexed and 100μL of the homogenate was transferred to a 1.5mL tube and 125μL of chloroform and 250μL of Methanol were added. Samples were vortexed briefly and incubated for 5 min. Additional 125μL of chloroform was added. Next, 125μL of water was added and samples were vortexed and centrifuged at 3000rpm for 20 min at 4oC. Approximately 150μL of the lower phase was collected in a 1.5mL tube and chloroform was evaporated in a heated vacuum oven. Lipids were then re-suspended in 300uL of ethanol. Triglyceride was measured by a Randox Tg Kit (catalog number TR213) from Randox Laboratories.
In vivo de novo lipogenesis assay:
Obese (ob/ob) mice (~10 weeks old) in the fed state were injected with 1.5U/kg insulin. After 60 minutes, mice were injected with 10μM cold acetate and 25μCi 14C-acetate (Perkin Elmer, catalog: NEC553001MC) diluted in PBS in a total of 250μL. After 60 minutes, animals were sacrificed, total liver was weighed, and 4 pieces of different lobes were collected from each animal and frozen in liquid nitrogen. Lipids were extracted as described in the Liver triglyceride measurements section above and the lower phase was carefully transferred to 4ml liquid scintillation fluid in a scintillation vial and 14C activity was measured.
In vivo insulin signaling:
Mice were anesthetized with an intraperitoneal injection of 300 mg/kg ketamine and 30 mg/kg xylazine in PBS, following a 6-hour food withdrawal between 8a.m – 2p.m. Insulin (1 IU kg−1) or PBS in 200 μl volume was infused into the portal vein. Three minutes after infusion, liver tissue was removed and frozen immediately in liquid nitrogen and kept at −80°C until processing.
In vitro de novo lipogenesis assay:
This assay was performed as previously described27. Briefly, primary hepatocytes were serum starved overnight in the presence of 0.2% BSA Fraction V, 2mM sodium pyruvate and 100 nM insulin. Next day, they were incubated with 100nM insulin, 10μM acetate and 0.5μCi 14C-acetate per well (for a 12well plate) for 2 hours at 37C. Fatty acids were extracted with chloroform/methanol as described27 and 14C counts were measured and normalized to total protein content from the corresponding well.
Fatty acid oxidation assay:
In vitro fatty acid oxidation assay was performed as previously described27. Briefly, primary hepatocytes were serum starved in the presence of Media-199 with 25 mM HEPES, 1% BSA Fraction V, and 100nM glucagon overnight. Next day, cells were treated with 250uM Na-palmitate for 2 hours. At the end of the 2-hour incubation, wells were spiked with 0.5 μCi/well of 14C-palmitic acid (Perkin Elmer, catalog: NEC075H250UC) (dried and re-suspended in 0.1N NaOH) and incubated for another 90 minutes. In the end, 14C labeled CO2 gas was captured as described27 and radioactivity was measured. As a negative control, some wells were treated with 40μM etomoxir, an inhibitor of the carnitine palmitoyl transferase-I, 30 min prior to palmitate addition, to inhibit the fatty acid oxidation.
Liver Histology:
Livers were fixed in 10% zinc formalin overnight and then transferred to 70% ethanol for prolonged storage. Tissue processing, sectioning, and staining with hematoxylin and eosin was performed by the Dana Farber/Harvard Cancer Center rodent histopathology core.
Transmission electron microscopy (TEM):
Whole liver tissue:
8–10 weeks old lean (Wt) and obese (ob/ob) mice were anesthetized with 300 mg/kg ketamine and 30 mg/kg xylazine in PBS and perfused with 10mL of saline followed by 10mL of fixative buffer containing 2.5% glutaraldehyde, 2.5% paraformaldehyde in 0.1 M sodium cacodylate buffer (pH 7.4) (Electron Microscopy Sciences, catalog no: 15949). After perfusion, small pieces (1–2 mm3) of liver were immersed in the same fixative buffer described above and then sliced at 300-micron thickness with a compresstome (Precisionary Instruments, catalog no: VF-300–0Z). The first 3 slices (~900um) were discarded to reach the full-mid-section cut. The slices were transferred into a fresh fixative solution containing 4 parts of FP stock (2.5 % PFA, 0.06 % picric acid in 0.2M Sodium Cacodylate buffer pH 7.4) and 1 part of 25 % glutaraldehyde and incubated at 4C overnight. Primary hepatocytes: Cells were fixed in a 1:1 ratio in a fixative buffer and Williams Medium. The fixative buffer contained: 4 parts of FP stock (2.5 % PFA, 0.06 % picric acid in 0.2M Sodium Cacodylate buffer pH 7.4) and 1 part of 25 % glutaraldehyde for at least 2h. The tissue slices or cell pellets were then washed in 0.1M cacodylate buffer and post-fixed with 1% Osmiumtetroxide (OsO4) / 1.5% Potassiumferrocyanide (K2FeCN6) for 1 hour, washed two times in water and one time in 50mM maleate buffer pH 5.15 (MB), incubated in 1% uranyl acetate in MB for 1hr followed by 3 washes in MB and subsequent dehydration in grades of alcohol (10min each; 50%, 70%, 90%, 2×10min 100%) followed by incubation for 1hr in propylene oxide. The samples were incubated overnight at 4C in a 1:1 mixture of propylene oxide and TAAB Epon (TAAB Laboratories Equipment Ltd, https://taab.co.uk). The following day, samples were embedded in TAAB Epon and polymerized at 65C for 48 hrs. Sectioning and imaging: ultrathin sections (about 90nm) were generated using a Reichert Ultracut-S microtome and imaged with a JEOL 1200EX electron microscope at 80kV. Images were recorded with an AMT 2K CCD camera. For the whole liver, sections were imaged in low magnification and portal triad and central vein were located. The high magnification images were collected in the intermediary zone, in between the portal and central vein.
TEM analysis (Parallel and non-parallel organization of ER):
Whole hepatocyte mid-cross-sectional areas were captured at 1500x magnification with a JEOL 80Kb electron microscope. ER was manually annotated as a single pixel wide filament and binary masks of ER were generated with Fiji. Each filament of ER was searched for a nearby neighbor ER filament at the direction perpendicular to the tangent to the curve in a range of 5–20 pixels (corresponds to 55–225 nm distance at 1500x magnification) in Matlab. If more than 50% of the two neighboring ER traces were within the range search, they were accepted as parallel organized. Parallel organized and non-parallel organized ER traces were exported as Tiff images and ratios were calculated from these images using Fiji. The code can be downloaded at https://github.com/gparlakgul
FIB-SEM sample preparation:
300μm thick tissue samples were fixed and prepared as described in TEM section. Samples were washed in ice-cold 0.15 M Na-cacodylate buffer for 5 min, 3 times and then incubated in 0.15 M Na-cacodylate solution containing 1% OsO4 and 1.5% potassium ferrocyanide for 1h at 4°C. Samples were rinsed with water 3 times and incubated for 20 min in 1% thiocarbohydrazide and rinsed again 3 × 5 min with water. Samples were incubated in 2% OsO4 for 30 min and then rinsed 3 × 5 min with water, followed by washing with 50mM maleate buffer pH 5.15 (MB) 3 times and incubated overnight at 4C in 1% uranyl acetate in MB. Next day, samples were washed and subsequently dehydrated in grades of alcohol (10min each; 50%, 70%, 90%, 2×10min 100%). Samples were embedded in increasing concentrations of Durcupan resin mixed with ethanol (30min each; 50%, 70%, 90% and 100% Durcupan) followed by incubation in 100% Durcupan for 4 hours. The samples were moved to fresh 100% Durcupan and polymerized at 65C for 24 hrs. Samples were each first mounted to the top of a 1 mm copper post which was in contact with the metal-stained sample for better charge dissipation, as previously described1. A small vertical sample post was trimmed to the Region of Interest (ROI) with a width of 100~130 μm and a depth of 90~100 μm in the direction of the ion beam for each sample. The trimming was guided by X-ray tomography data obtained by a Zeiss Versa XRM-510 and optical inspection under a microtome. A thin layer of conductive material of 10-nm gold followed by 100-nm carbon was coated on the trimmed samples using a Gatan 682 High-Resolution Ion Beam Coater. The coating parameters were 6 keV, 200 nA on both argon gas plasma sources, 10 rpm sample rotation with 45-degree tilt. For the FIB-SEM analysis we imaged a liver volume from one lean mice, two obese mice and one obese mice overexpressing Climp-63.
3D large volume FIB-SEM imaging:
Samples were imaged sequentially by three customized FIB-SEM systems, each with a Zeiss Capella FIB column mounted at 90° onto a Zeiss Merlin SEM. Details of the Enhanced FIB-SEM systems were previously described1. Each block face was imaged by a 3nA electron beam with 1.2 keV landing energy at 2 or 3 MHz. A faster SEM scanning rate was applied on samples with stronger staining contrast. The x-y pixel size was set at 8 nm. A subsequently applied focused Ga+ beam of 15nA at 30 keV strafed across the top surface and ablated away 8 nm of the surface. The newly exposed surface was then imaged again. The ablation – imaging cycle continued about once every 60 (3 MHz) to 90 (2 MHz) seconds for two weeks to complete FIB-SEM imaging of one sample. The sequence of acquired images formed a raw imaged volume, followed by post processing of image registration and alignment using a Scale Invariant Feature Transform (SIFT) based algorithm in IMOD, FiJi and MATLAB.
FIB-SEM segmentation:
The organelles, cells and nuclei have been segmented using the 3dEMtrace platform of ariadne.ai (https://ariadne.ai/). A customized convolutional neural network (CNN) architecture based on 3D U-Net was used for the deep learning-based automated segmentation methods. In brief, ground truth data was generated from the raw FIB-SEM images by manually annotating cells and organelles. CNNs have been trained using the manually generated ground truth and fine-tuned until a good quality of segmentation was reached for automated segmentation in 3D. The accuracy of the segmentation has been validated by expert inspection. In addition, the accuracy has been quantified by evaluating the voxel and object-level recall/precision and f1-score in validation sub-volumes that have not been used for CNN training. Binary Tiff masks were generated for each organelle class separately. For the cells an instance segmentation was provided in order to assign a unique identifier to each cell. Post-segmentation proofreading and correction was done using the open-source software Knossos (https://knossos.app/) and the commercially available Arivis Vision 4D software.
FIB-SEM ER sheet and tubule sub-segmentation:
The segmentation of the sub-compartments of endoplasmic reticulum (ER sheets and ER tubules) was done by using the binary ER masks: 12 images from different layers of each dataset were chosen randomly as training data. ER sheets and ER tubules were annotated manually, from a mixture of lean and obese dataset images (single classifier), as separate classes by labeling both lipid bilayer and also filling in the ER luminal space. U-Net-architecture-based machine learning approach has been utilized to train and segment the data by segmenting, for each dataset, each plane using that plane plus the previous and subsequent planes as input. The Python code can be downloaded at https://github.com/gparlakgul
FIB-SEM segmentation evaluation:
The evaluation of organelle segmentation was performed at the same resolution as the segmentation. Raw data, manual annotation data and predictions are provided as tiff stacks (8bit or 32bit, compressed, packaged in a .zip folder). For lipid droplets, mitochondria, nuclear membrane, and ER, we selected 3 test volumes of 150×150×25 voxels at random locations that have not been used for training and manually segmented the contained organelles. Voxel-based scores for all classes were calculated by comparing the manual and automated segmentation in these test volumes. Object based scores were only calculated for mitochondria and lipid droplets. This is because each mitochondrion or lipid droplet is a biological unit and there are multiple of these objects, whereas ER is actually a single continuous membrane (single object) that spans the whole cell volume. (Supplementary Table 2).
The evaluation of ER sheet & tubule segmentation was done pixel-wise. Four different locations with an area of 750×750 pixel2, that have not been used for training, were chosen randomly in each dataset. (Supplementary Table 3).
For the voxel-based evaluation, TP (True Positive), FP (False Positive), FN (False Negative) and TN (True Negative) are evaluated on a per voxel level by comparing the manually annotated test samples with the automatic segmentation. TPvx: A voxel that is labeled in both the automatic and manual segmentation of the test volume. FPvx: A voxel that is labeled in the automatic segmentation but not in the manual segmentation of the test volume. FNvx: A voxel that is not labeled in the automatic segmentation but that is labelled in the manual segmentation of the test volume. TNvx: A voxel that is not labeled in either the automatic nor the manual segmentation of the test volume.
For the Object-based evaluation:
TPObject:
An object that is labeled in both the automatic and manual segmentation of the test volume with a shift tolerance of 5 px and minimal overlap of 5 %.
FPObject:
An object that is labeled in the automatic segmentation but not in the manual segmentation of the test volume with a shift tolerance of 5 px and minimal overlap of 5 %.
FNObject:
An object that is not labeled in the automatic segmentation but that is labelled in the manual segmentation of the test volume with a shift tolerance of 5 px and minimal overlap of 5 %.
Recall, precision, and F1-score were calculated as follows:
Precision:
The fraction of relevant instances among the total retrieved instances.
Recall (sensitivity):
The fraction of relevant instances that were retrieved.
The F1-score is the harmonic mean of precision and recall.
F1 Score = 2*(Recall * Precision) / (Recall + Precision)
For ER sheet & tubule segmentation, accuracy has also been calculated, which is defined as a ratio of correctly predicted observation to the total observations.
Raw data, manual annotations and predictions are provided.
FIB-SEM data analysis and visualization:
Raw FIB-SEM data and binary Tiff stacks for each organelle class were imported to Arivis Vision 4D software as separate channels and .sis files were generated. Each individual cell and organelle were re-segmented in Vision 4D to create objects. Quantitative measures such as volume, voxel number, surface area and sphericity were calculated. Unspecific objects with less than 10 voxels were eliminated for organelle volume quantification. Cytosolic volumes were calculated by subtracting the lipid droplet, mitochondria and ER volumes from the total cell volumes. Movies were generated with Arivis Vision 4D, except Fig 3C and Fig 3D movies, which were generated in Houdini (SideFX) by Ho Man Leung (Refik Anadol Studio, CA).
MAM and mitochondria analysis in FIB-SEM datasets:
Three different sub-volumes of 2000×2000×400 voxels were chosen randomly from each dataset. The organelle segmentation in these datasets were manually corrected to reach 100% accuracy. Mitochondria outer voxel objects were generated by eroding mitochondria volumes by 1 voxel in 3D and subtracting it from the original volume. Endoplasmic reticulum (ER) objects were dilated 2 voxels (16nm). The intersection of the dilated ER object and outer mitochondria voxel was classified as ‘‘0–16nm” apart mitochondria associated membranes (MAMs). Mitochondria shape (sphericity) was calculated on the fully intact mitochondria in these sub-volumes in Arivis Vision 4D software.
Cell culture:
Hepa 1–6 cells were cultured in DMEM with 10% CCS. Cos-7 cells were cultured in DMEM with 10% FBS. All cells were cultured at 37°C in a humidified incubator that was maintained at a CO2 level of 5%. For the overexpression, Climp-63-Myc plasmid was acquired from Origene (catalog no: MR215622). Reticulon-homology-domain (GFP-Rtn-HD) plasmid was kindly provided by Tom Rapoport’s lab at Harvard Medical School. pAc-GFPC1-Sec61beta was obtained from Addgene (catalog: 15108). The plasmid was transfected into Hepa 1–6 and Cos-7 cells using lipofectamine LTX overnight in OptiMEM media and the experiments were done after 36–48h after transfection.
Primary hepatocyte isolation:
Animals were anesthetized using 300 mg/kg ketamine and 30 mg/kg xylazine in PBS. The livers were perfused with 50 mL of buffer I (11 mM Glucose; 200 μM EGTA; 1.17 mM MgSO4 heptahydrated; 1.19 mM KH2PO4; 118 mM NaCl; 4.7 mM KCl; 25 mM NaHCO3, pH 7.32) through the portal vein with an osmotic pump set to the speed of ~4 mL/min until the liver turned pale. The speed was gradually increased until ~7 mL/min afterwards. When the entire buffer I had been infused, it was substituted for 50 mL of buffer II (11 mM Glucose; 2.55 mM CaCl2; 1.17 mM MgSO4 heptahydrated; 1.19 mM KH2PO4; 118 mM NaCl; 4.7 mM KCl; 25 mM NaHCO3; BSA (fatty acid free) 7.2 mg/mL; 0.18 mg/mL of Type IV Collagenase (Worthington Biochem Catalog: LS004188), BSA and collagenase were added immediately before use. The buffers were kept at ~37oC during the entire procedure. After perfusion, the primary hepatocytes were carefully released and sedimented at 500 rpm for 2 minutes, washed two times and suspended with Williams E medium supplemented with 5 % CCS and 1 mM glutamine (Invitrogen, CA). To separate live from dead cells, the solution of hepatocytes was layered on a 30% Percoll gradient and centrifuged ~1500 rpm for 15 minutes. The healthy cells were recovered at the bottom of the tube and plated for experimentation.
Total protein extraction and Immunoblotting:
Liver tissues were homogenized in a polytron in cold lysis buffer containing 50 mM Tris-HCl (pH 7.4), 2 mM EGTA, 5 mM EDTA, 30 mM NaF, 10 mM Na3VO4, 10 mM Na4P2O7, 40 mM glycerophosphate, 1% NP-40, and 1% protease inhibitor cocktail. After 20–30 minutes incubation on ice, the homogenates were centrifuged at 9000 rpm for 15 minutes to pellet cell debris. The supernatant was removed, and protein concentrations were determined by BCA. The samples were then diluted in 6x Laemmli buffer and heated at 95oC for 5 minutes. The protein lysates were subjected to SDS-polyacrylamide gel electrophoresis, as previously described21. All the immunoblots were incubated with primary antibody overnight at 4oC, followed by incubation with secondary antibody conjugated with horseradish peroxidase (Cell Signaling Technologies) for 1–3 hour at room temperature. Individual membranes were visualized using the enhanced chemiluminescence system (Roche Diagnostics). The uncropped raw versions of the western blots generated during the current study are provided in Supplementary Figure 1.
Primary and secondary antibody list:
List of antibodies and their catalog numbers are provided in Supplementary Table 4. All primary antibodies were used at 1:1000 dilution. Secondary HRP conjugated antibodies were used at 1:5000 dilution. Alexa Fluor antibodies were used at 1:200 dilution for IF staining purposes.
Endogenous protein staining and confocal imaging:
Primary hepatocytes, Hepa1–6 or Cos-7 cells were seeded on 35 mm round glass bottom imaging dishes in Williams Medium in the presence of 5% CCS (for primary hepatocytes) and DMEM in the presence 10% CCS/FBS overnight at 37oC, 5% CO2. The following morning, cells were washed and fixed with 4% paraformaldehyde for 10 min at room temperature (RT) and washed 3x in PBS, before a 20 min permeabilization using 0.2% Triton-X100 in PBS at RT. Primary antibodies were diluted 1:200 for Sec61β antibody, Cell Signaling Technologies (14648) in PBS and the cells were incubated in this solution overnight at 4°C. Next day, cells were washed 3x with PBS, including one long wash for more than 10 min. Secondary antibody was diluted 1:1000 in PBS, and the cells were incubated with it at RT for 1h in the dark. The cells were washed 3x, including one long wash, and if needed, Hoechst was used as nuclear marker, diluted 1:5000 in PBS and incubated for 10 min at RT. Cells were imaged with a Yokogawa CSU-X1 spinning disk confocal system (Andor Technology, South Windsor, CT) with a Nikon Ti-E inverted microscope (Nikon Instruments, Melville, NY), using a 60x or 100x Plan Apo objective lens with a Zyla cMOS camera and NIS elements software was used for acquisition parameters, shutters, filter positions and focus control. Image analysis was performed using Fiji and Nikon NIS Elements software. Raw single plane Tiff images were analyzed using a Macro and mean intensity values were calculated per image. Fiji Macro can be downloaded at https://github.com/gparlakgul
Glucose production assay in primary hepatocytes:
Isolated primary hepatocytes were plated in 24 well collagen coated plates. Three hours after plating, cells were washed with warm PBS twice and incubated in 0.1% CCS containing Media 199 (Thermo Scientific cat: 11150067) and with the corresponding adenovirus (LacZ or Climp-63-myc at 30 MOI dose) overnight. Next morning, cells were washed with PBS and incubated in DMEM with no glucose, no glutamine (Gibco catalog no: A1443001) for 1 hour. Then, cells were treated with gluconeogenic substrates in DMEM (A1443001) at a final concentration of: Lactate: 4.5mM, Na-pyruvate: 0.5mM, Glutamine: 2.5mM, or with Glycerol: 20mM, all in the presence of Glucagon (100nM). 3 hours later supernatant was collected, and glucose levels were measured using the Amplex Red Glucose Oxidase Assay Kit (A22189). Plate was washed with PBS and frozen for protein measurement.
ASGR assay:
The ASGR reporter plasmid described in22 was cloned in an Adenovirus Ad5 backbone from Vector BioLabs. In this reporter, ASGR lacking its membrane-anchoring domain was fused to luciferase Cluc. Conditions adversely affecting ER folding capacity result in lower levels of secretion of the ASGR-Cluc whereas improved ER folding capacity have the opposite effect. In these assays variations such as expression level, transfection efficiency and cell densities are controlled by normalization of Cluc signal to a constitutively secreted luciferase derived from Gaussia Luciferase, Gluc. The adenovirus (serotype 5, Ad5) expressing the ASGR was generated and amplified by Vector Biolabs. For the experiments in primary hepatocytes, cells were infected with 30 MOI in 12 or 24 well plates with Ad-ASGR and Ad-LacZ or Ad-Climp-63 viruses. The next day, cells were changed to a fresh medium containing phenol-red-free Williams E supplemented with 5% CCS and 1 mM glutamine (Invitrogen, CA) and incubated for 22 to 24 hours. 10 μl of supernatant was transferred to two 96-well white plates for luciferase assays following the manufacturer’s protocol. Briefly, 50 μl of luciferase substrate (1 μM Cypridina or 10 mM CTZ in 100 mM tris buffer, pH 7.5) was added to the 10 μl medium and incubated in the dark for 5 to 10 min. The luminescence was read on SpectraMax Paradigm plate reader (Molecular Devices).
Total ER and rough and smooth ER isolation:
For the total microsome isolation: subcellular fractionation of the liver was done based on published protocols21,24. Briefly, mice were sacrificed and 1g of liver was immediately weighed and washed in cold Buffer 1 (content described below). The tissue was minced and immersed in Buffer2. The tissue was filtered in order to eliminate the blood and transferred to a glass potter in 15mL of Buffer1 and further disrupted by Dounce homogenization. The homogenate was spun down at 740g for 5 min twice in a low-speed centrifuge; the supernatant was recovered and further centrifuged for 10 min at 10,000g, 3 times. The resulting pellet (crude mitochondrial fraction) was discarded, and the supernatant was used for the collection of the ER fraction which was obtained by centrifuging the supernatant at 100.000g for 60 min. Buffer1: Mannitol 225mM, Sucrose 75mM, Tris-HCl 30mM, BSA 0.5% and EGTA 0.5mM, pH7.4. Buffer2: Mannitol 225mM, Sucrose 75mM, Tris-HCl 30mM, BSA 0.5%, pH 7.4. Buffer3: Mannitol 225mM, Sucrose 75mM, Tris-HCl 30mM, pH 7.4. For the rough and smooth ER fractionation: the fractionation protocol was based on28 with modifications. Briefly, mice were sacrificed, the liver was excised, weighted and washed in a petri dish containing ice-cold sucrose buffer. Liver was transferred to a beaker containing ice-cold fresh sucrose buffer and minced in small pieces. The buffer was removed through a mesh filter and a volume of sucrose buffer was added an equivalent to ~5 times volume to the weight of the livers. The liver pieces were then transferred to a 15mL Dounce homogenizer with a Teflon pestle and homogenized with 5 strokes. The mixture was centrifuged 2 times at 10.000g for 20 min in a slow speed centrifuge, rotor: JA-17. The pellet containing mitochondria, and other contaminants were discarded. CsCl was added to the supernatant to make a final concentration of 15mM CsCl with using 1M CsCl stock solution. The supernatant was then layered on top of 15ml of 1.3M sucrose + 15mM CsCl in a Beckman SW32 Ti centrifuge tube (Cat No: 344058). The solution was completed to 34ml.s with 0.25M sucrose buffer and centrifuged for 4 hours at 105,000g, 4oC (with Beckman SW32 rotor). The pellet will contain rough microsomes and the interface between 0.25–1.3M will contain smooth microsomes. The supernatant above the band was drawn off (soluble fraction) and saved on ice and the pellet was resuspended in 0.25 M sucrose by gentle homogenization in a glass homogenizer. Both subfractions were centrifuged in a Ti50 rotor at 225,000g for 1h (Beckman Type 70.1Ti rotor) at 4C. Final pellets were resuspended in 0.25 M sucrose. Sucrose buffer: 250mM Sucrose and 50mM Tris pH7.4 + protease inhibitor cocktail, pH adjusted to 7.2 at 4°C.
Statistics and Reproducibility:
Statistical significance was assessed using GraphPad Prism Version 7 and Microsoft Excel, using the unpaired t-test and P values are indicated in the figure legends. Two-way ANOVA was used to evaluate significance in Fig. 4k, m. All data are mean ± SEM. In vivo metabolic experiments were repeated in at least 3 independent cohorts of mice, except for the full length Rtn4A experiment, where 6 mice per condition were tested in one cohort. For in vitro studies a minimum of three biological replicates was used for each experiment.
Data availability
Raw FIB-SEM, segmentation and evaluation data are deposited to EMPIAR database29 and can be reached at https://dx.doi.org/10.6019/EMPIAR-10791. The uncropped raw versions of the western blots generated during the current study are provided in Supplementary Figure 1. Source data are provided with this paper. Supplementary videos can also be reached at https://www.youtube.com/playlist?list=PLpzquMkvsJ9UDo2SROFj1ibGxC4XkbMwO
Code availability
The source code generated and analyzed during this study can be found at https://github.com/gparlakgul
Extended Data
Extended Data Fig. 1 |. Workflow of automated deep-learning-based segmentation.
a, Workflow for automated segmentation of organelles using convolution neuronal network-based machine learning. b, Section of liver volume from lean (right) and obese (left) with ER (blue), mitochondria (purple), cristae (pink) and lipid droplet (yellow) annotation and reconstruction. c, Percent of ER sheet volume normalized by cytosol volume. n=5 per group (***p=0.0003). d, Percent of ER tubule volume normalized by cytosol volume, n=5 for each group, (***p=0.0006), (here cytosol was considered as the cell volume minus the volume occupied by lipid droplets, mitochondria, and ER). All data (Ext. Data Fig. 1c, d) are presented as mean values +/− SEM. Unpaired t-test was used for all the statistical analyses.
Extended Data Fig. 2 |. Parallel organized stacks of ER sheets are decreased in obesity.
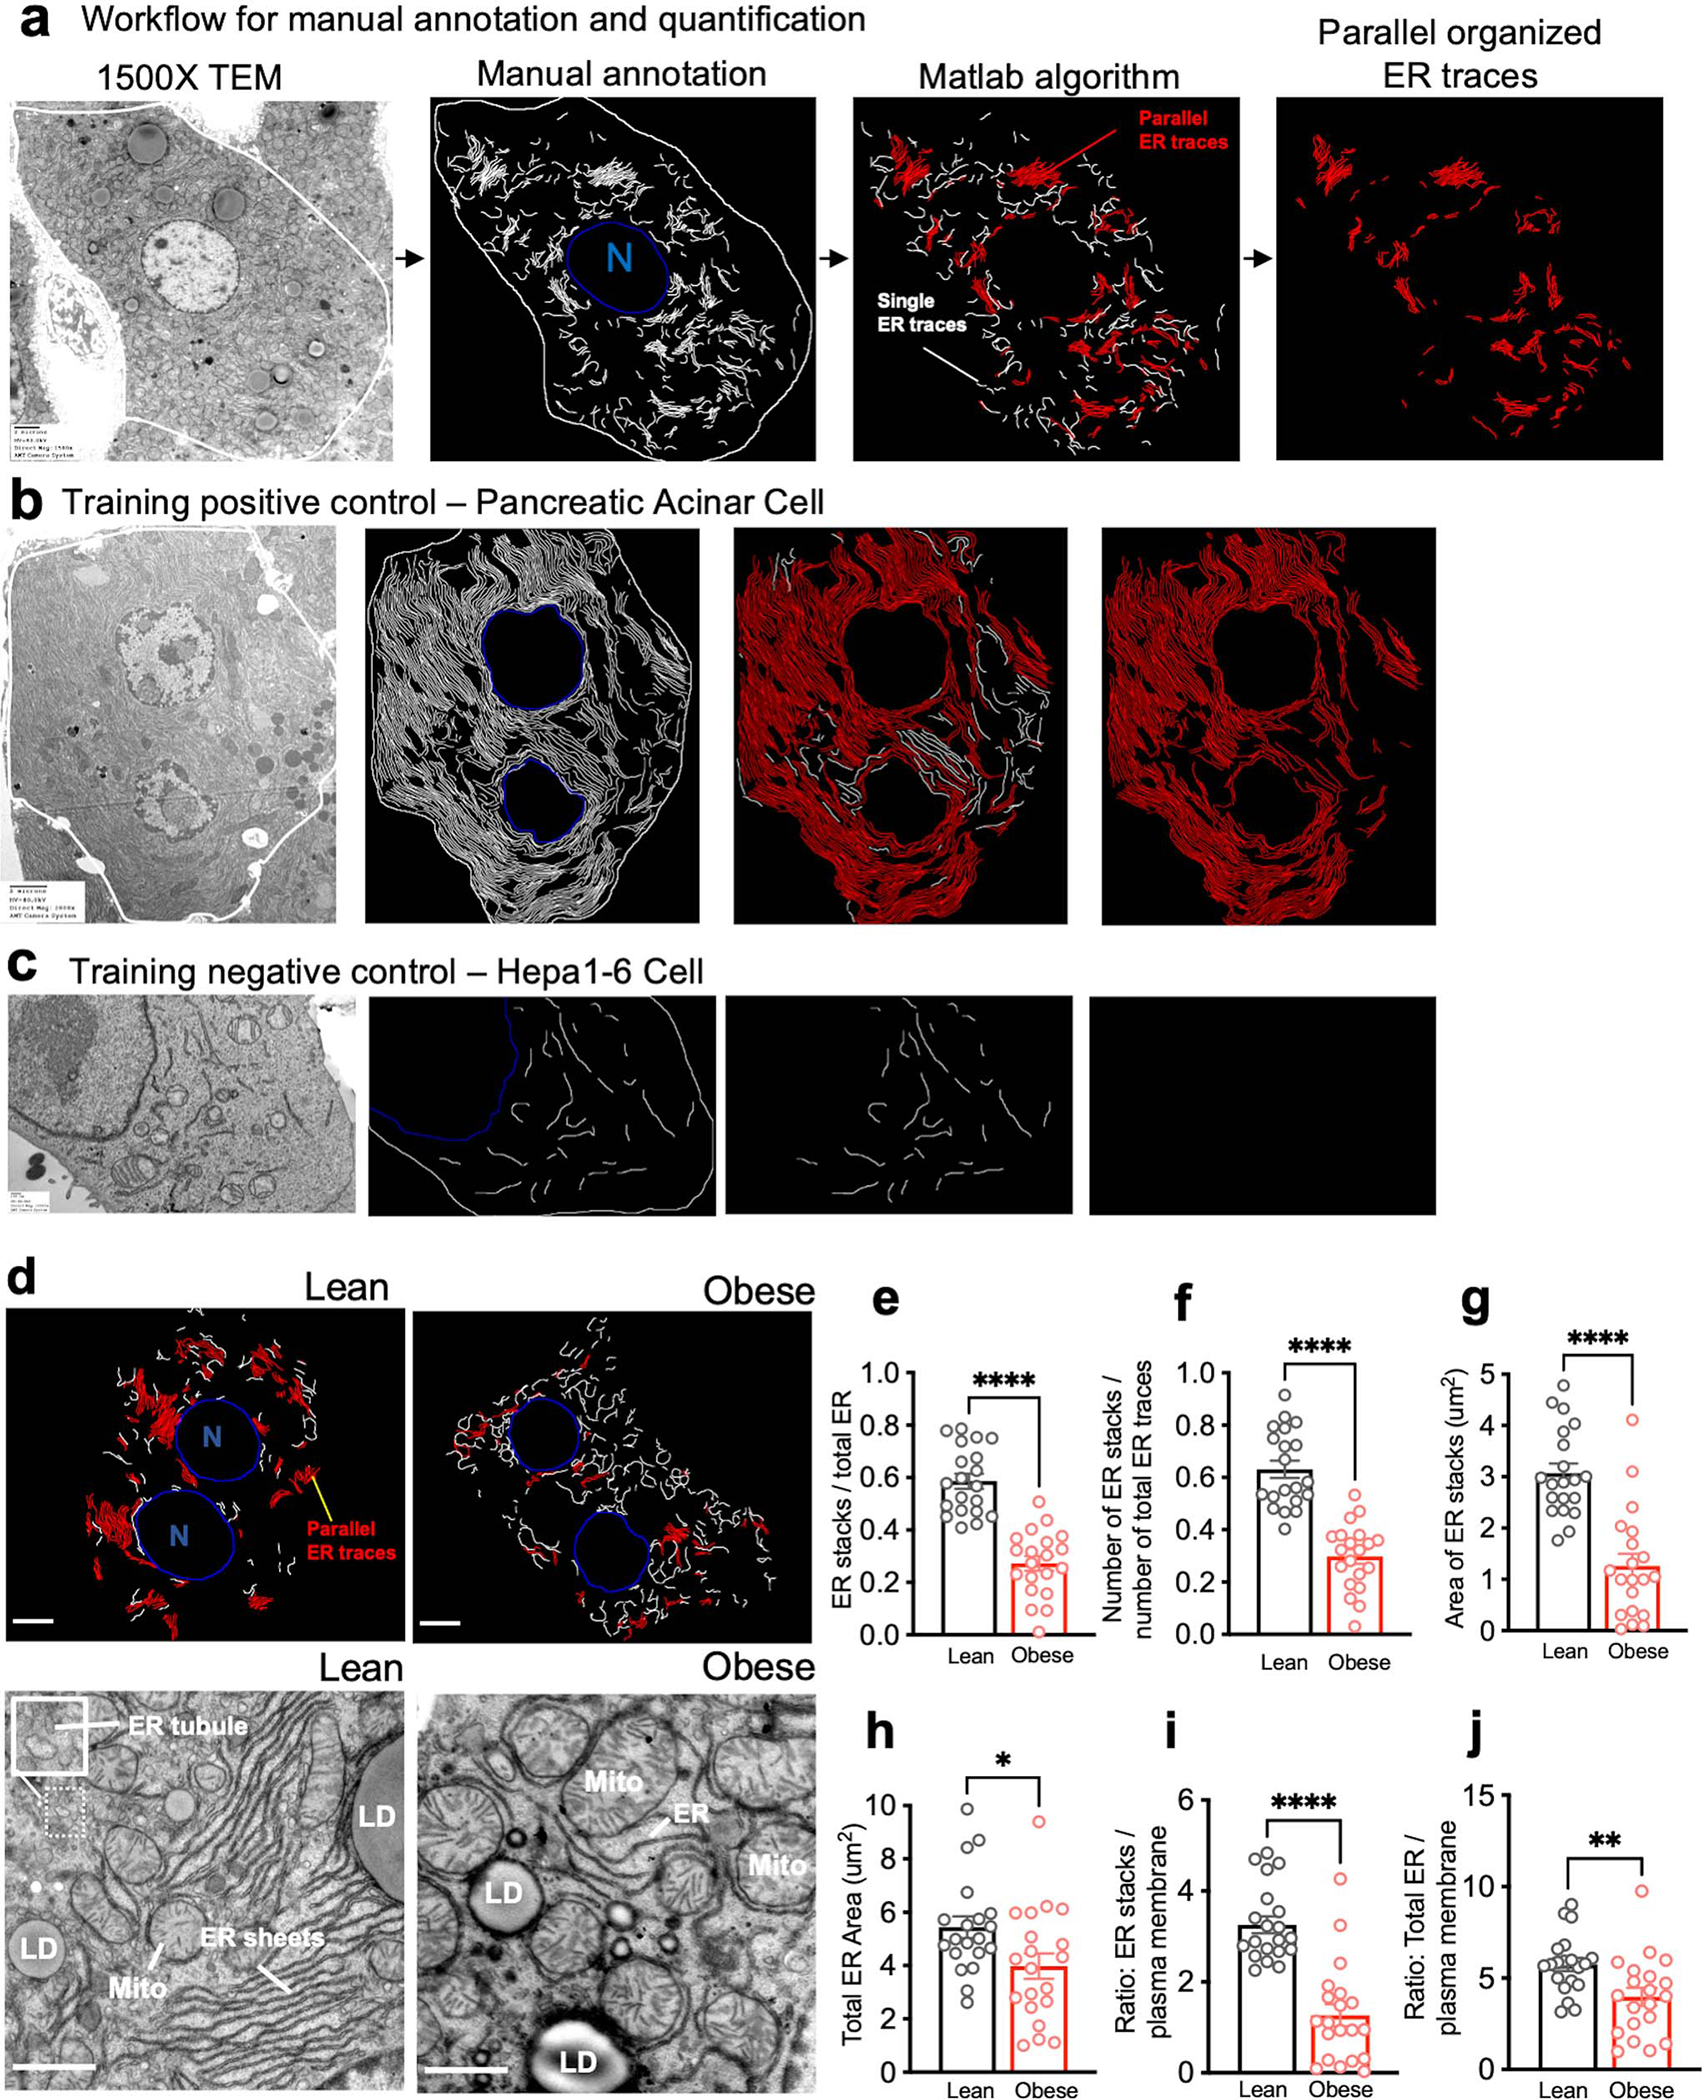
a, Workflow for manual annotation and quantification of parallel organized ER sheets. We considered two neighboring ER sheets as “parallel” if more than 50% of the two neighboring ER traces are within in 55–225 nm distance range (5–20 pixel range) from each other. b, TEM of acinar cell section was used as a positive control for training the algorithm, since this cell type is enriched in parallel ER sheets. c, TEM of Hepa 1–6 cell used as a negative control for training the algorithm, since this cell type is devoid of parallel ER sheets. d, Binary masks of manually annotated ER from the TEM images acquired in 1500x mag. White and red represent ER traces, where parallel organized ER is segmented in red, blue: nucleus (N). Bottom images are representative TEM images of liver sections derived from lean and obese mice. ER (endoplasmic reticulum), Mito (mitochondria), LD (lipid droplet). Scale bar: 2.236um. e, Quantification of the length of parallel ER stacks normalized by total ER length (****p<0.0001). f, Number of parallel ER stacks normalized by total number of ER traces (****p<0.0001). g, Quantification of the area of total parallel ER sheet traces (****p<0.0001). h, Quantification of the total ER area (*p=0.0258). i, Ratio of the area of parallel ER stacks to plasma membrane (****p<0.0001). j, Ratio of the total area of ER traces to plasma membrane (**p=0.0059). e-j, n=20 cells from 4 mice per condition. All data (Ext. Data Fig. 2e, j) are presented as mean values +/− SEM. Unpaired t-test was used for all the statistical analyses.
Extended Data Fig. 3 |. Rough ER is downregulated in obesity.
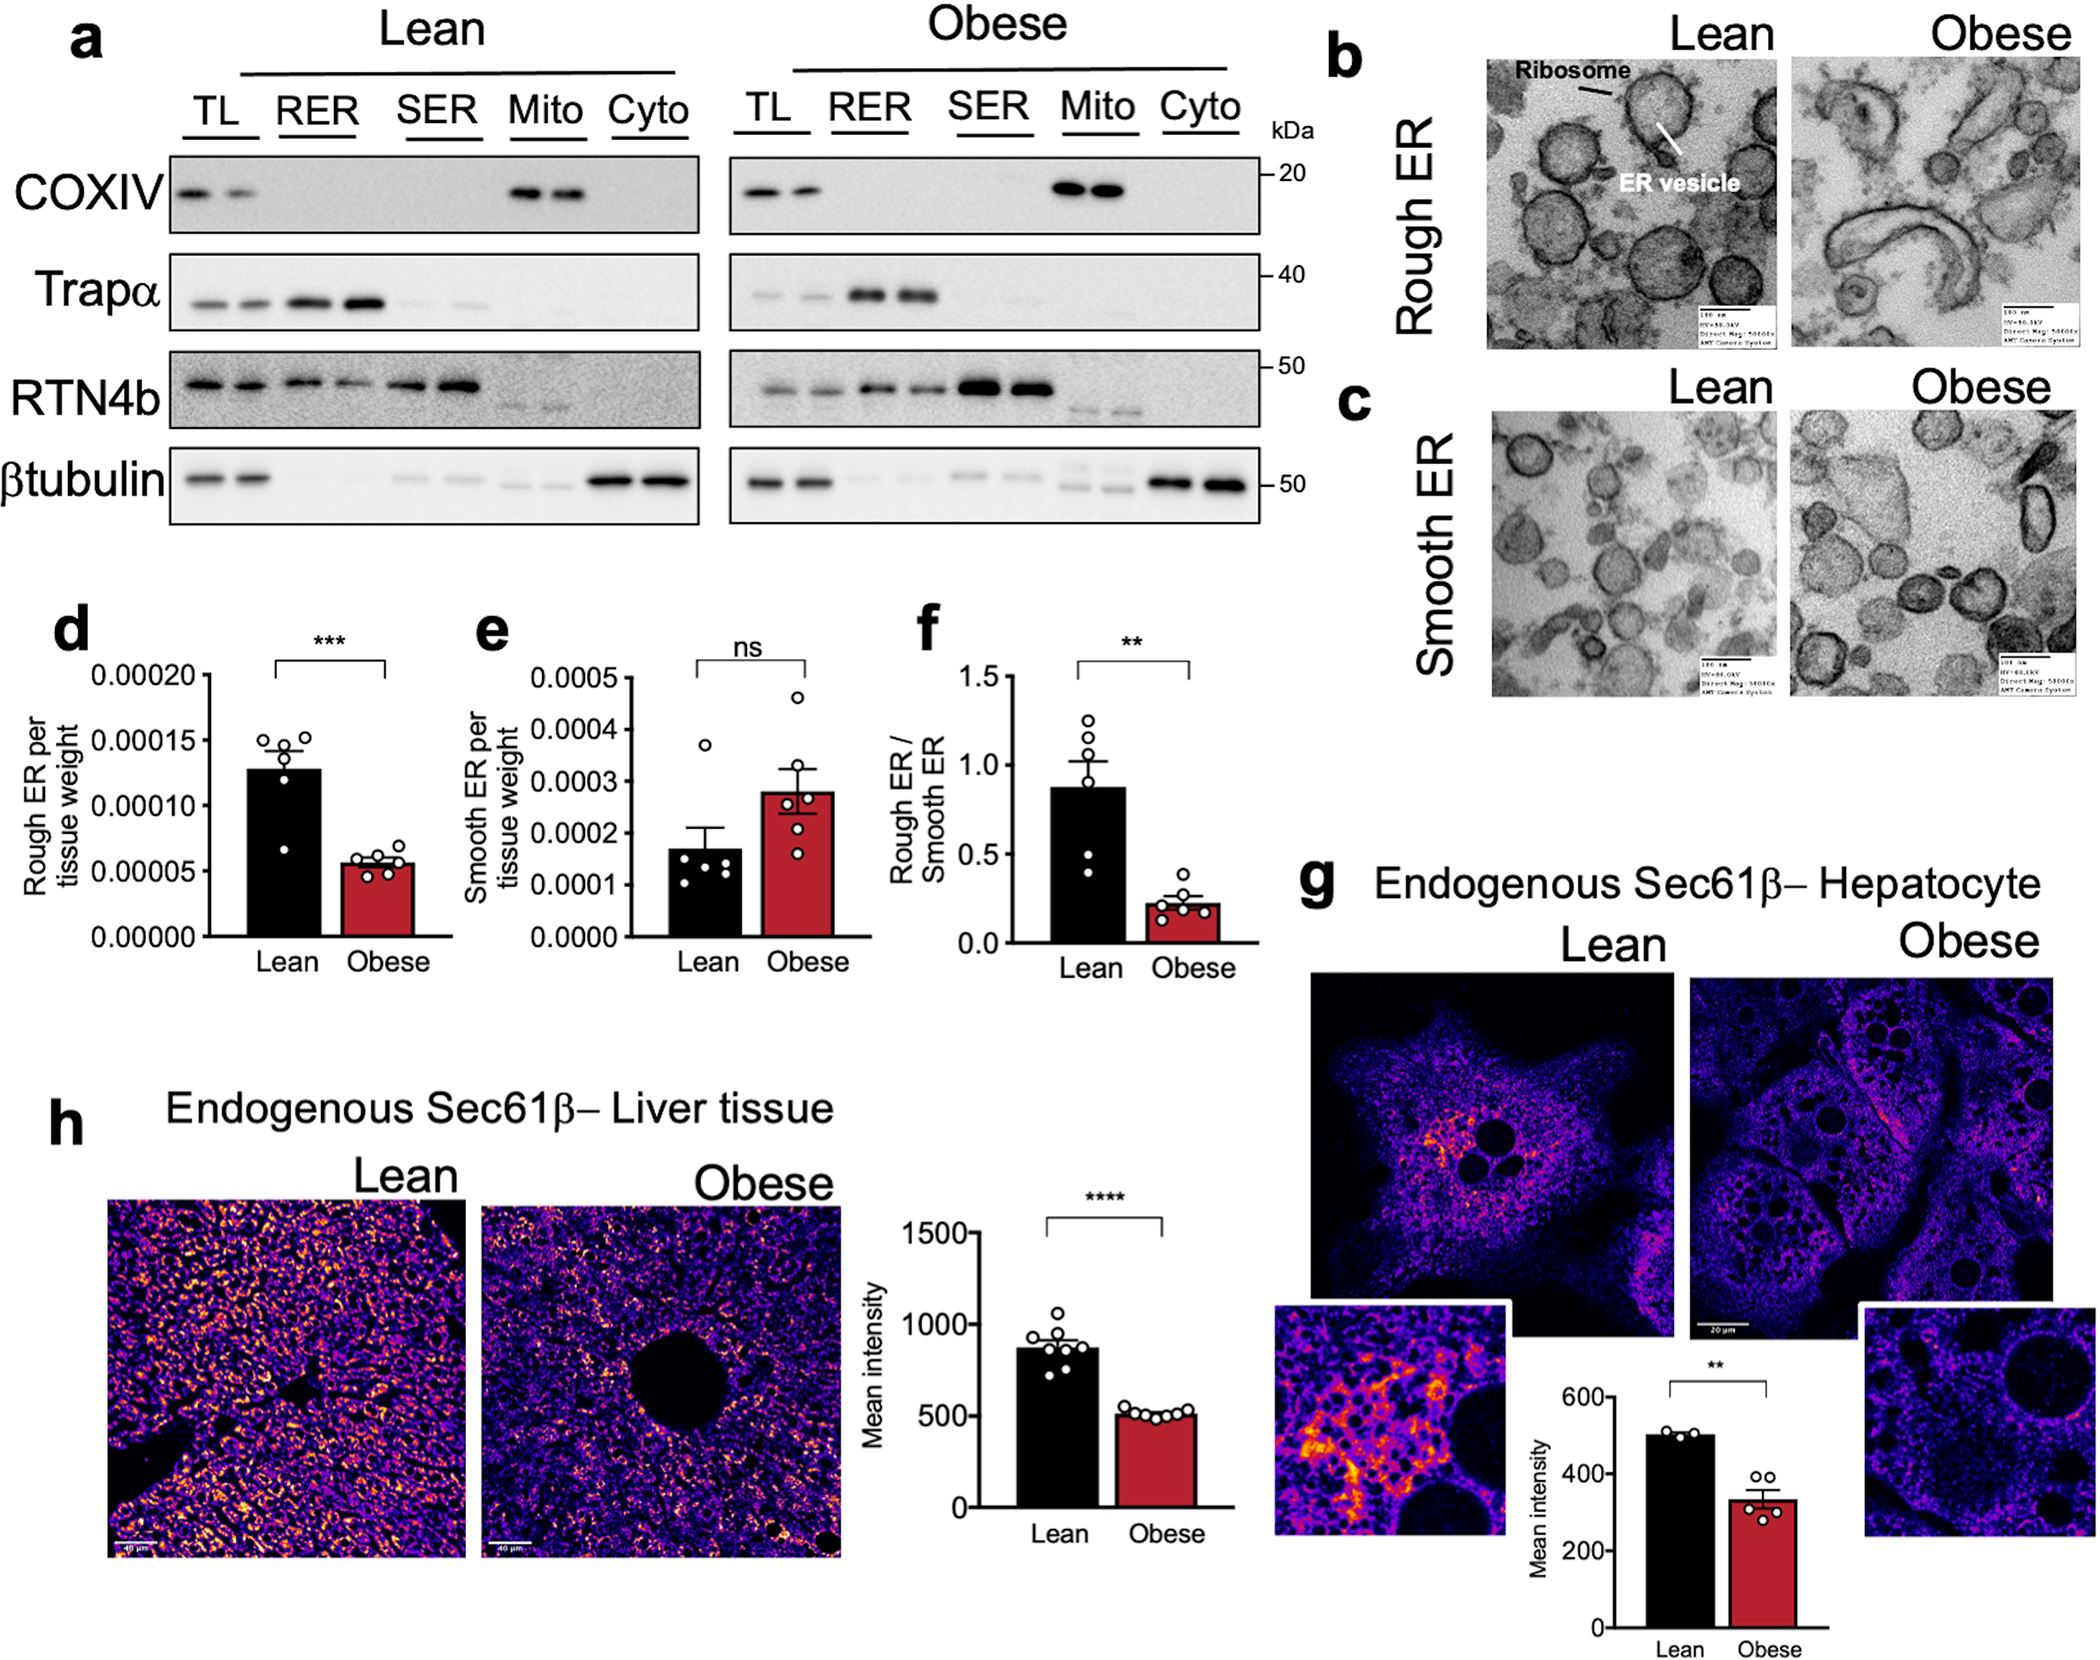
a, Immunoblot analysis of the indicated proteins and validation of the rough – smooth ER fractionation. TL: total liver lysate, RER: rough endoplasmic reticulum, SER: smooth ER, Mito: mitochondria, Cyto: cytosolic fraction. b, TEM of rough and c, smooth ER vesicles isolated from livers derived from lean and obese mice. ER recovered in the denser sucrose fraction is enriched in ribosomes in both lean and obese samples (b), while the smooth ER fraction was characterized by microsomes vesicles devoid of ribosomes (c). d, milligrams of rough (***p=0.0004) and e, smooth (p=0.0917) ER vesicles recovered by subcellular fractionation normalized by milligram of liver. f, Ratio of abundance of rough to smooth ER vesicles (**p=0.0014) in lean and obese mice. n=6 per group. g, Confocal images and quantification of immunofluorescence staining for endogenous Sec61β in primary hepatocytes from lean and obese mice. n=3 fields lean and n=5 fields obese, representative of 3 independent hepatocyte isolations (**p=0.0018). h, Confocal images of immunofluorescence staining for endogenous Sec61β in liver sections from lean and obese mice. Right panel: Quantification of fluorescence intensity of immunofluorescence staining for endogenous Sec61β in liver sections from lean and obese mice. n=8 fields for lean and 7 fields for obese mice, representative of 2 mice per group (****p=0.0001). All data (Ext. Data Fig. 3d–h) are presented as mean values +/− SEM. Unpaired t-test was used for all the statistical analyses.
Extended Data Fig. 4 |. Analysis of translocon complex and chaperone expression.
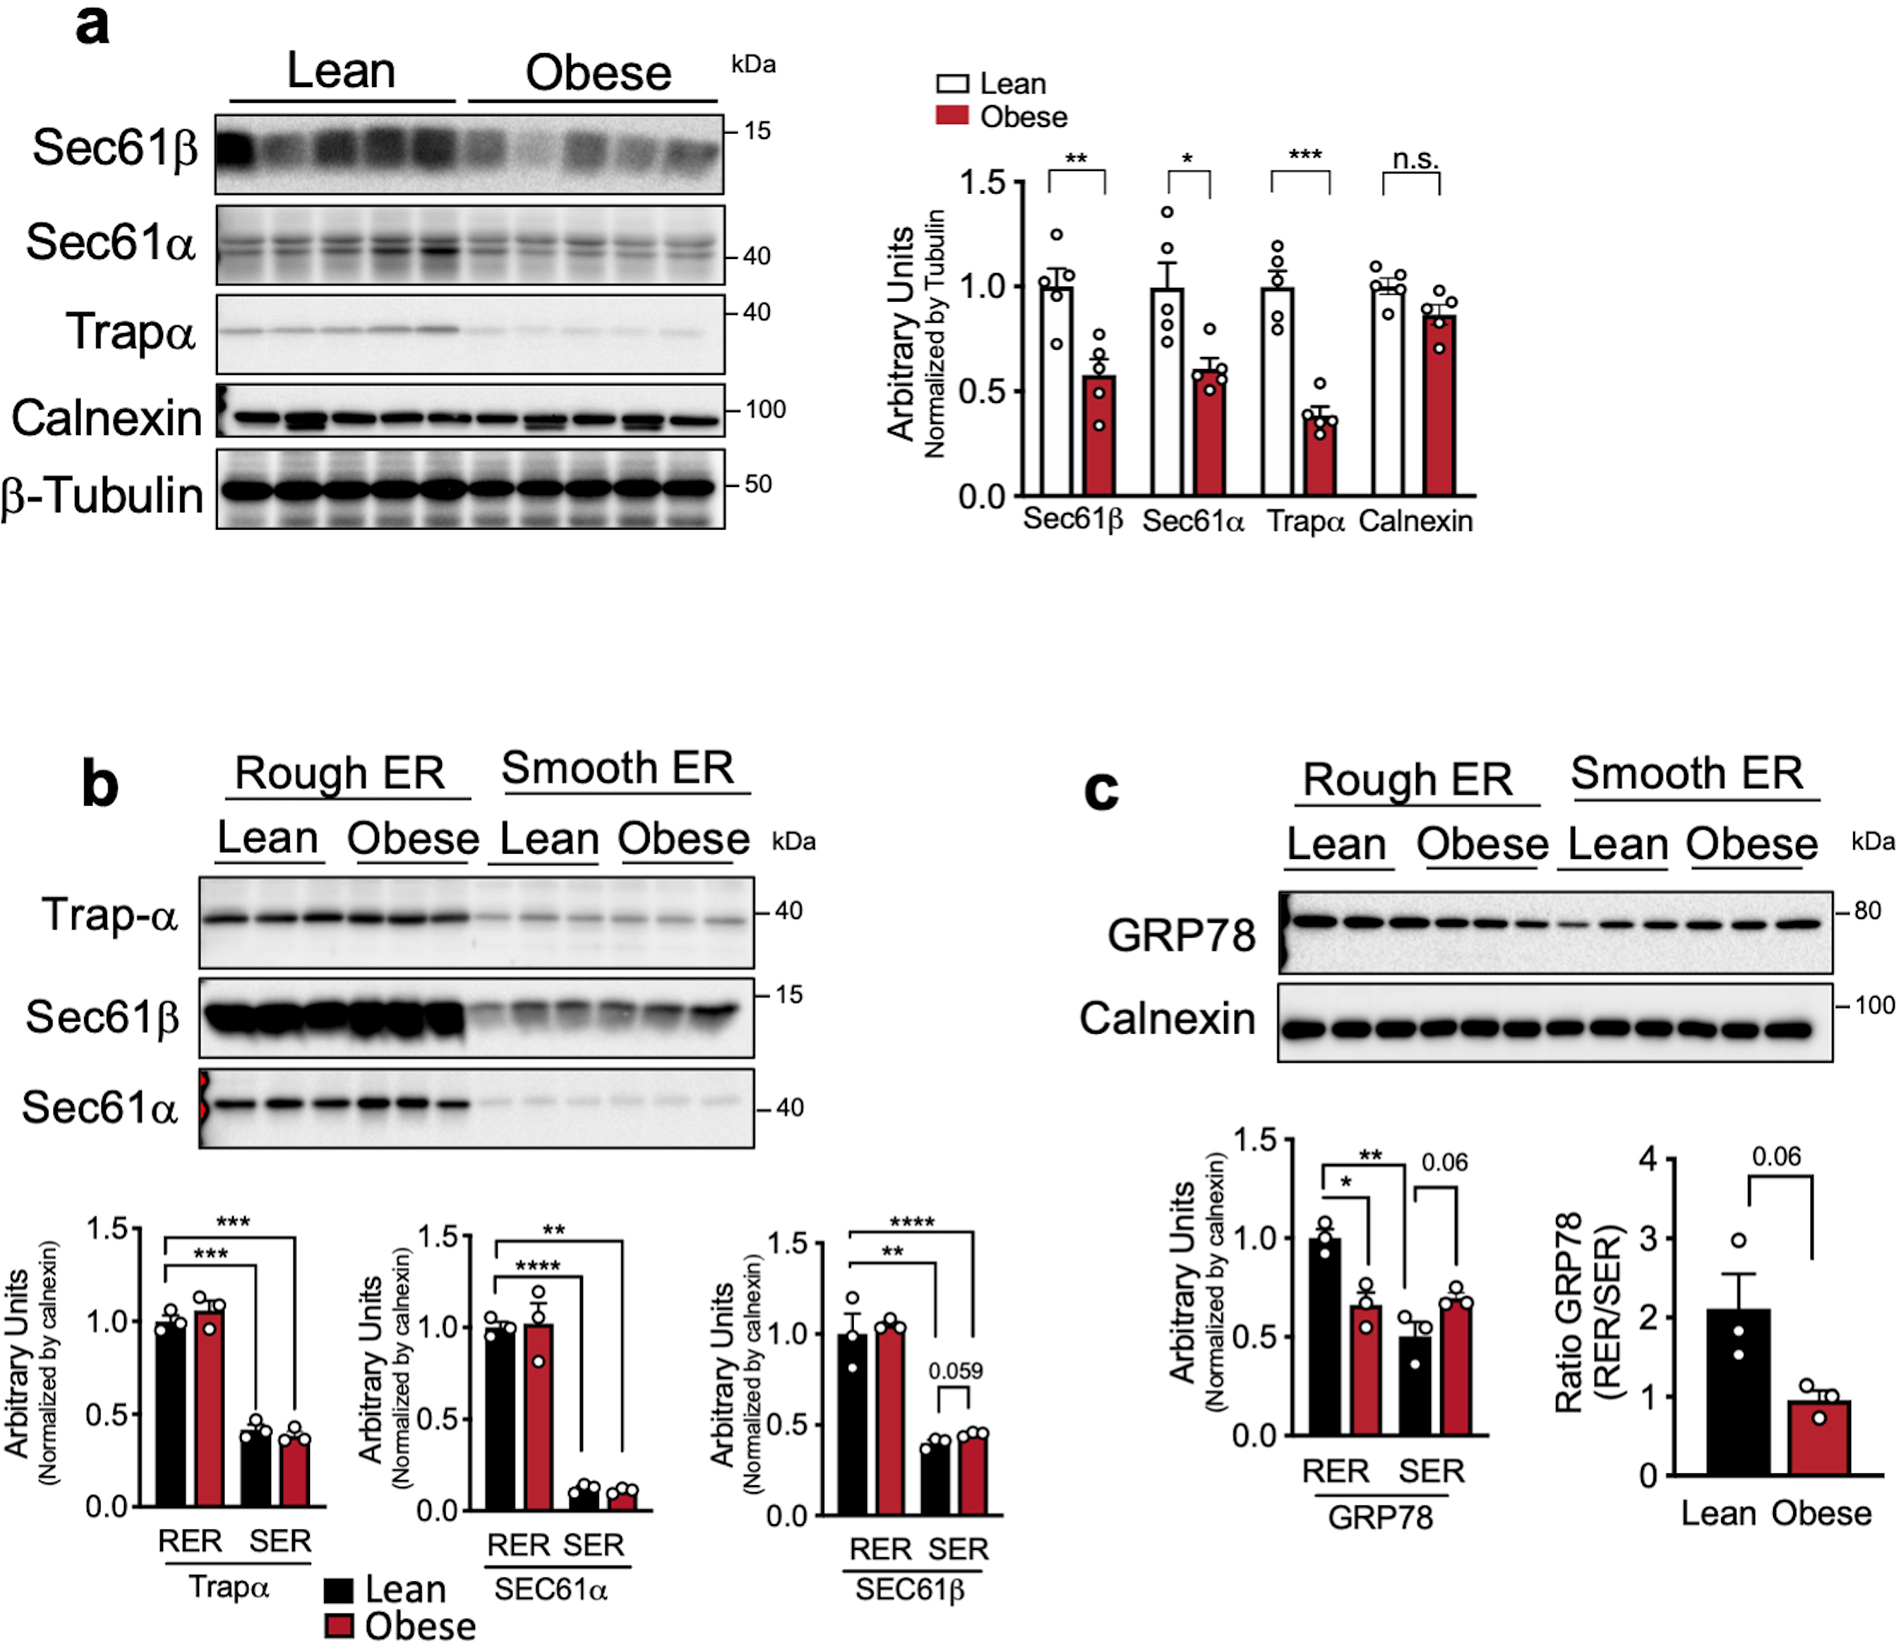
a, Left panel: Immunoblot analysis of the indicated proteins in total liver lysates from lean and obese mice. Right panel: Quantification of the immunoblots. n=5 mice per group, representative of 3 independent cohorts (*p=0.016, **p=0.0057, ***p=0.0001). b, c, Immunoblot analysis (top) and quantification (bottom) of indicated proteins in rough and smooth ER fractions from livers of lean and obese mice (*p<0.013, **p<0.006, ***p<0.0002). n=3 mice per condition. The quantification of all the proteins in the blots were normalized to signal for Calnexin shown in Extended Data Fig. 4c. All data (Ext. Data Fig. 4a–c) are presented as mean values +/− SEM. Unpaired t-test was used for all the statistical analyses.
Extended Data Fig. 5 |. Validation of organelle fractionation and antibodies.
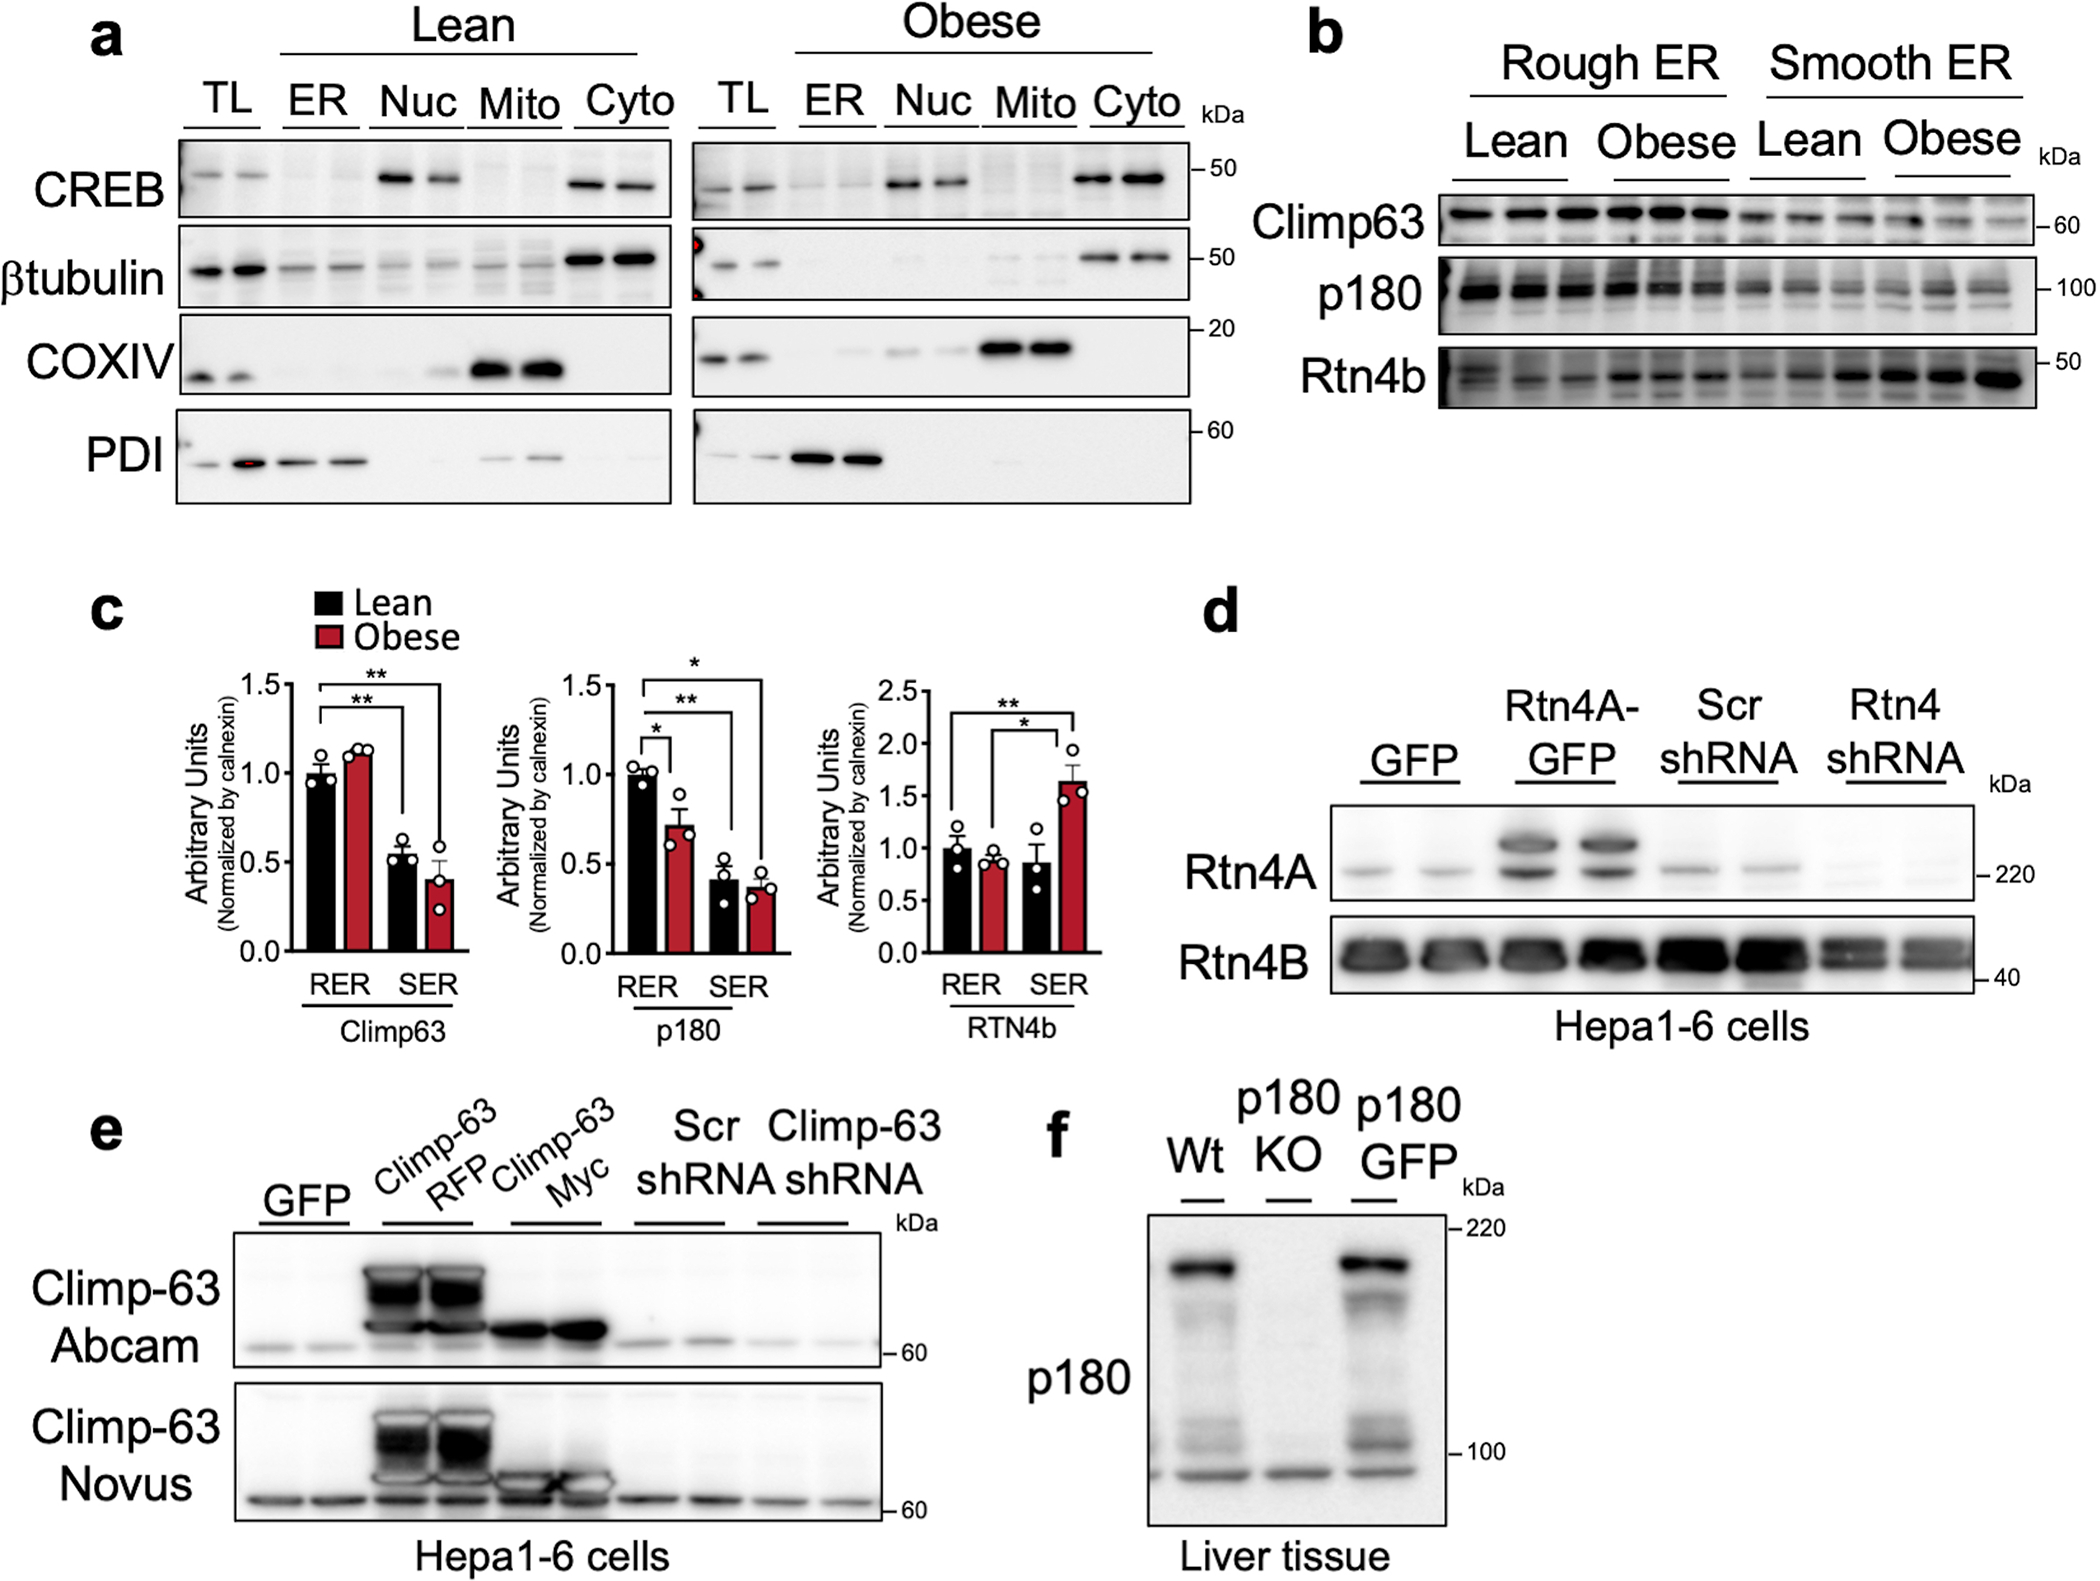
a, Immunoblot analysis of the indicated proteins and validation of the organelle fractionation. TL: total liver lysate, ER: endoplasmic reticulum, Nuc: nucleus, Mito: mitochondria, Cyto: cytosolic fraction. b, Immunoblot analysis and quantification (c) of indicated proteins in rough and smooth ER fractions from livers of lean (n=3) and obese (n=3) mice. The quantification of all the proteins in these blots were normalized to signal for Calnexin shown in Extended Data Fig. 4c (*p<0.038, **p<0.0085), as these samples were from the same experiment. d, Immunoblot analysis for Reticulon 4A (Rtn4a) and 4B (Rtn4b) in total lysates from Hepa1–6 cells expressing GFP control or Rtn4A tagged with GFP or transfected with shRNA control (scrambled, Scr) or shRNA against Reticulon4. e, Immunoblot analysis for Climp-63 in total lysates from Hepa1–6 cells expressing GFP control or Climp-63 tagged with RFP or Myc or transfected with shRNA control (scrambled, Scr) or shRNA against Climp-63. f, Immunoblot analysis for RRBP1 (p180) in total liver lysates derived from wildtype (Wt) and RRBP1 deficient mice. All data (Ext. Data Fig. 5c) are presented as mean values +/− SEM. Unpaired t-test was used for all the statistical analyses.
Extended Data Fig. 6 |. Exogenous expression of Reep5, Rtn4A or Rtn-HD in livers of lean mice leads to hepatic steatosis.
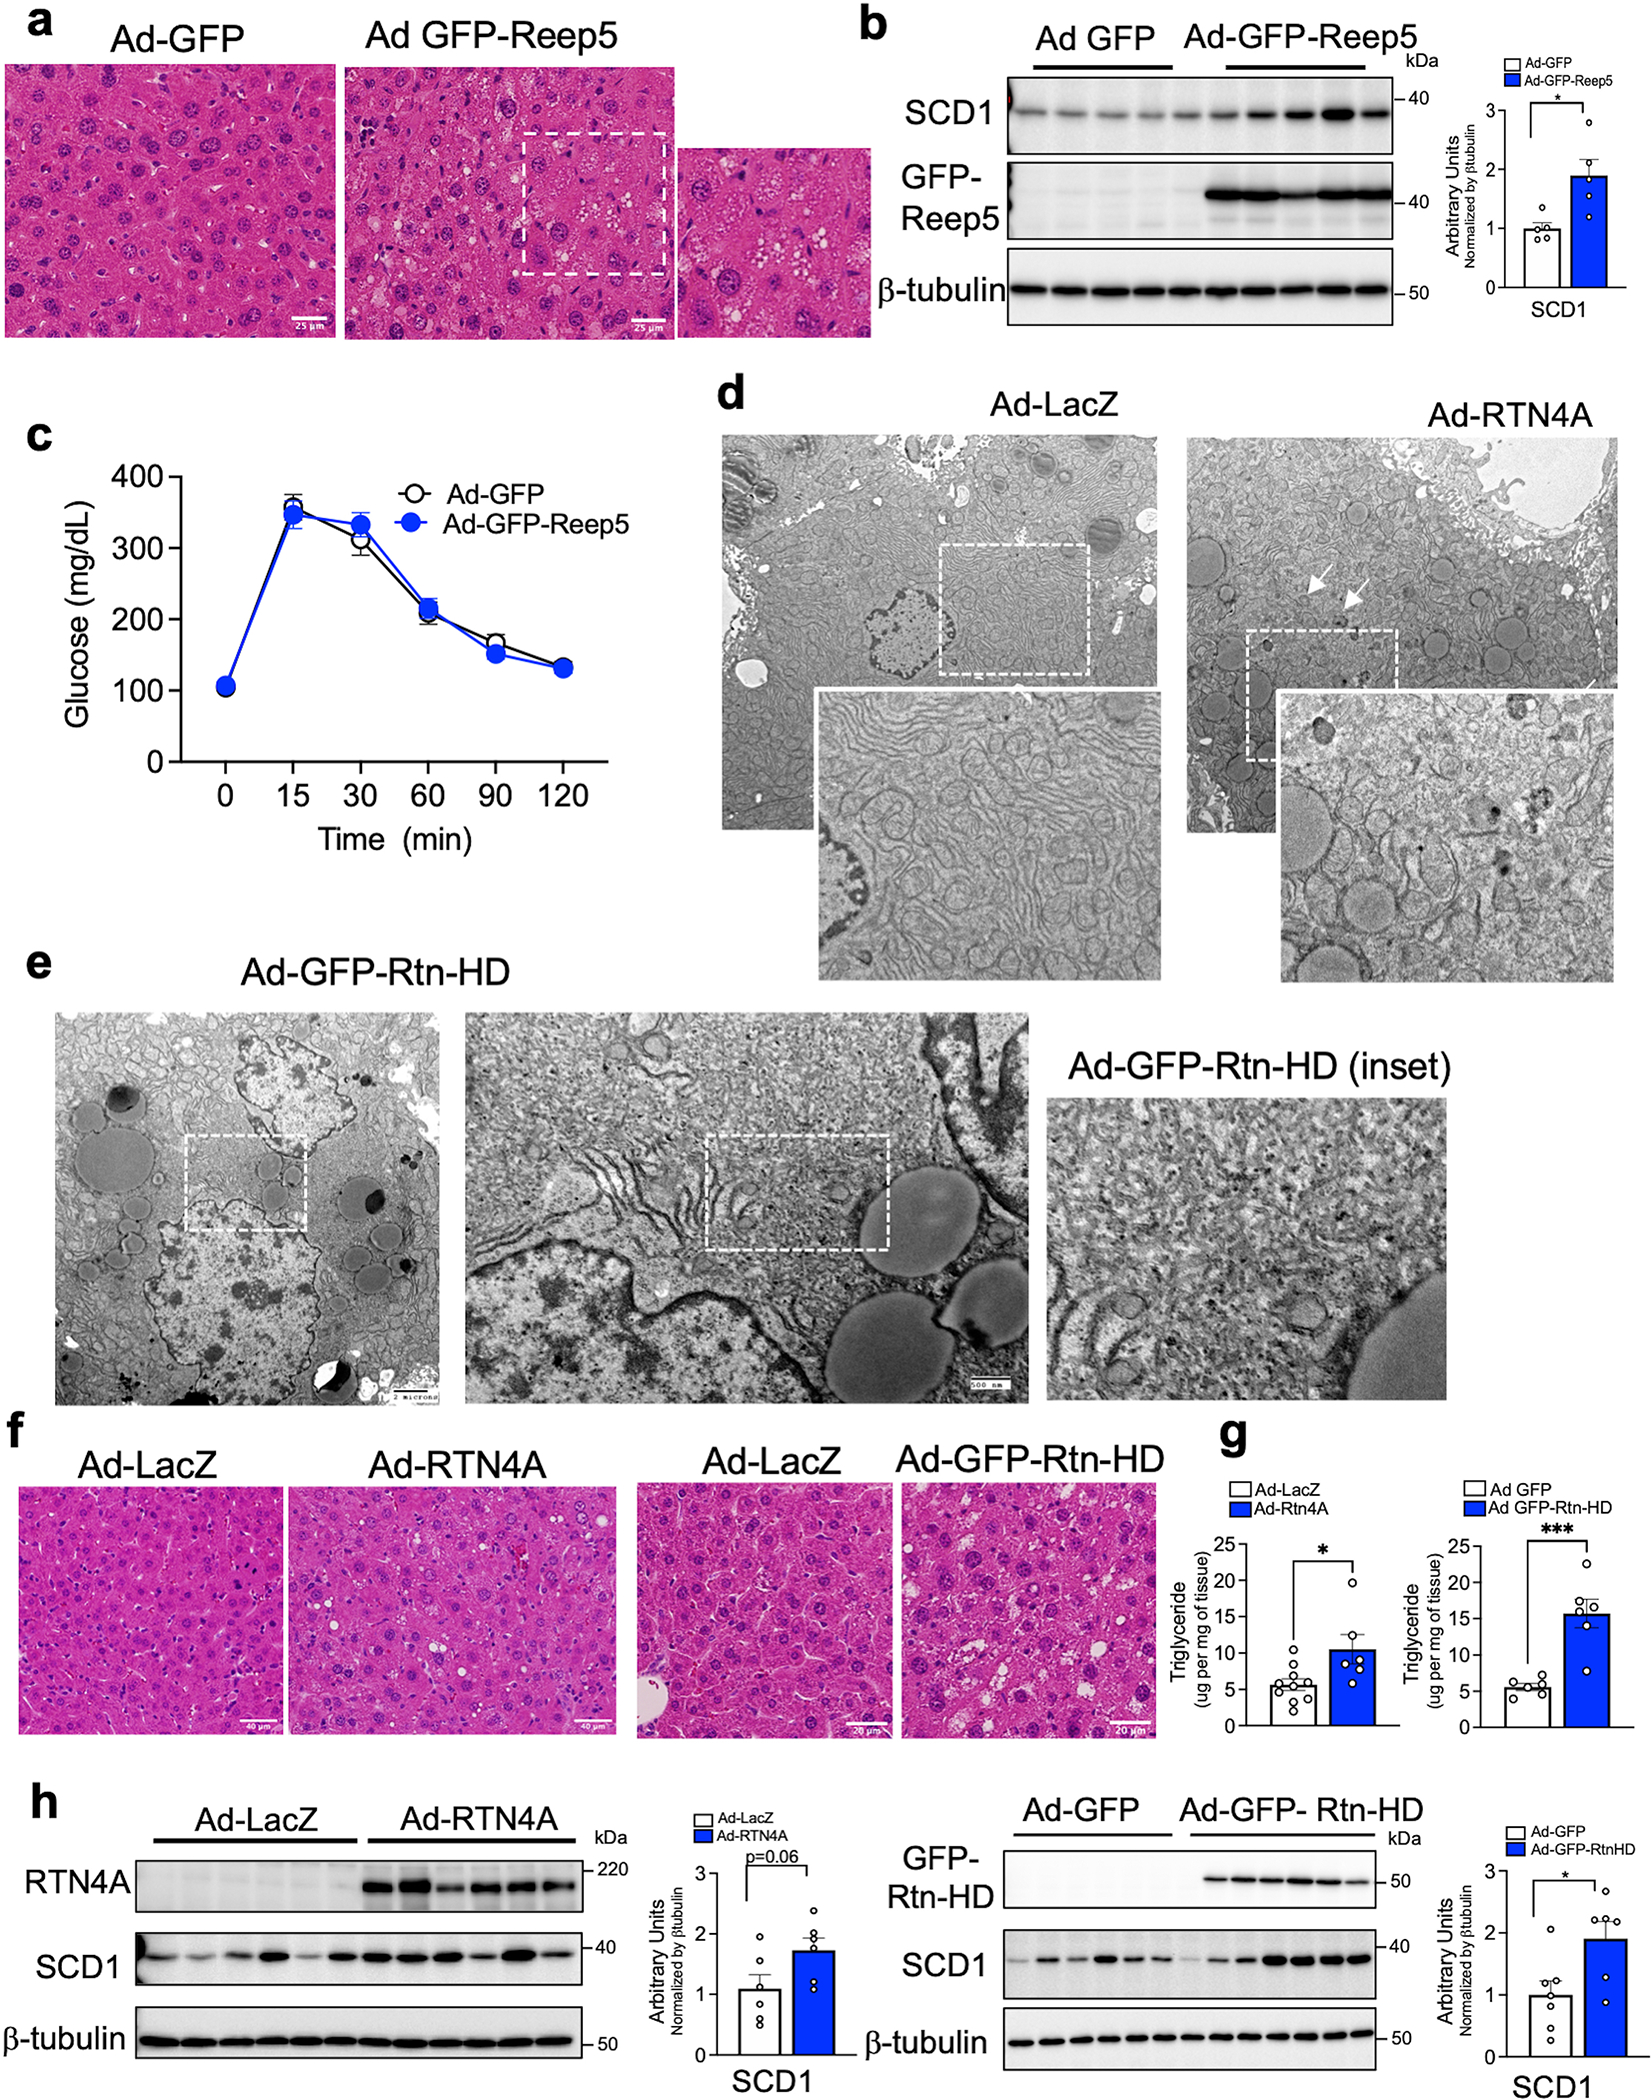
a, Histology sections (H&E staining) from livers of lean mice expressing Ad-GFP control or Ad-GFP-Reep5. b, Immunoblot analysis (left) and quantification (right) of indicated proteins (*p=0.014). n=5 mice per group. c, Glucose tolerance test in lean mice expressing Ad-GFP (n=7 mice) or Ad-Reep5 (n=7 mice). d-e, Representative TEM images derived from livers of lean mice exogenously expressing (d) full length Rtn4A and (e) Reticulon4 homology domain (Ad-GFP-Rtn-HD). Ad: Adenovirus. Magnified insets show smooth ER proliferation and lipid droplets, white arrows show autophagosomes. f, Histology sections (H&E staining) from livers of lean mice expressing Ad-LacZ control or Ad-RTN4A (left) or Ad-GFP-Rtn-HD (right). g, Triglyceride content of livers from lean mice expressing either Ad-LacZ control (n=10 mice) or Ad-Rtn4A construct (n=6 mice) (left side) (*p=0.019) and Ad-GFP control (n=6 mice) or Ad-GFP-Rtn-HD construct (n=6 mice) (right side) (***p=0.0005). h, Immunoblot analysis (left) and quantification (right) of indicated proteins. Ad-LacZ (n=6 mice), Ad-Rtn4A (n=6 mice) (p=0.06). Ad-GFP (n=7 mice), Ad-Rtn-HD (n=6 mice) (*p=0.025). All data (Ext. Data Fig. 6b, g, h) are presented as mean values +/− SEM. Unpaired t-test was used for all the statistical analyses.
Extended Data Fig. 7 |. Exogenous expression of Climp-63 in primary hepatocytes and liver in vivo promotes ER sheet formation.
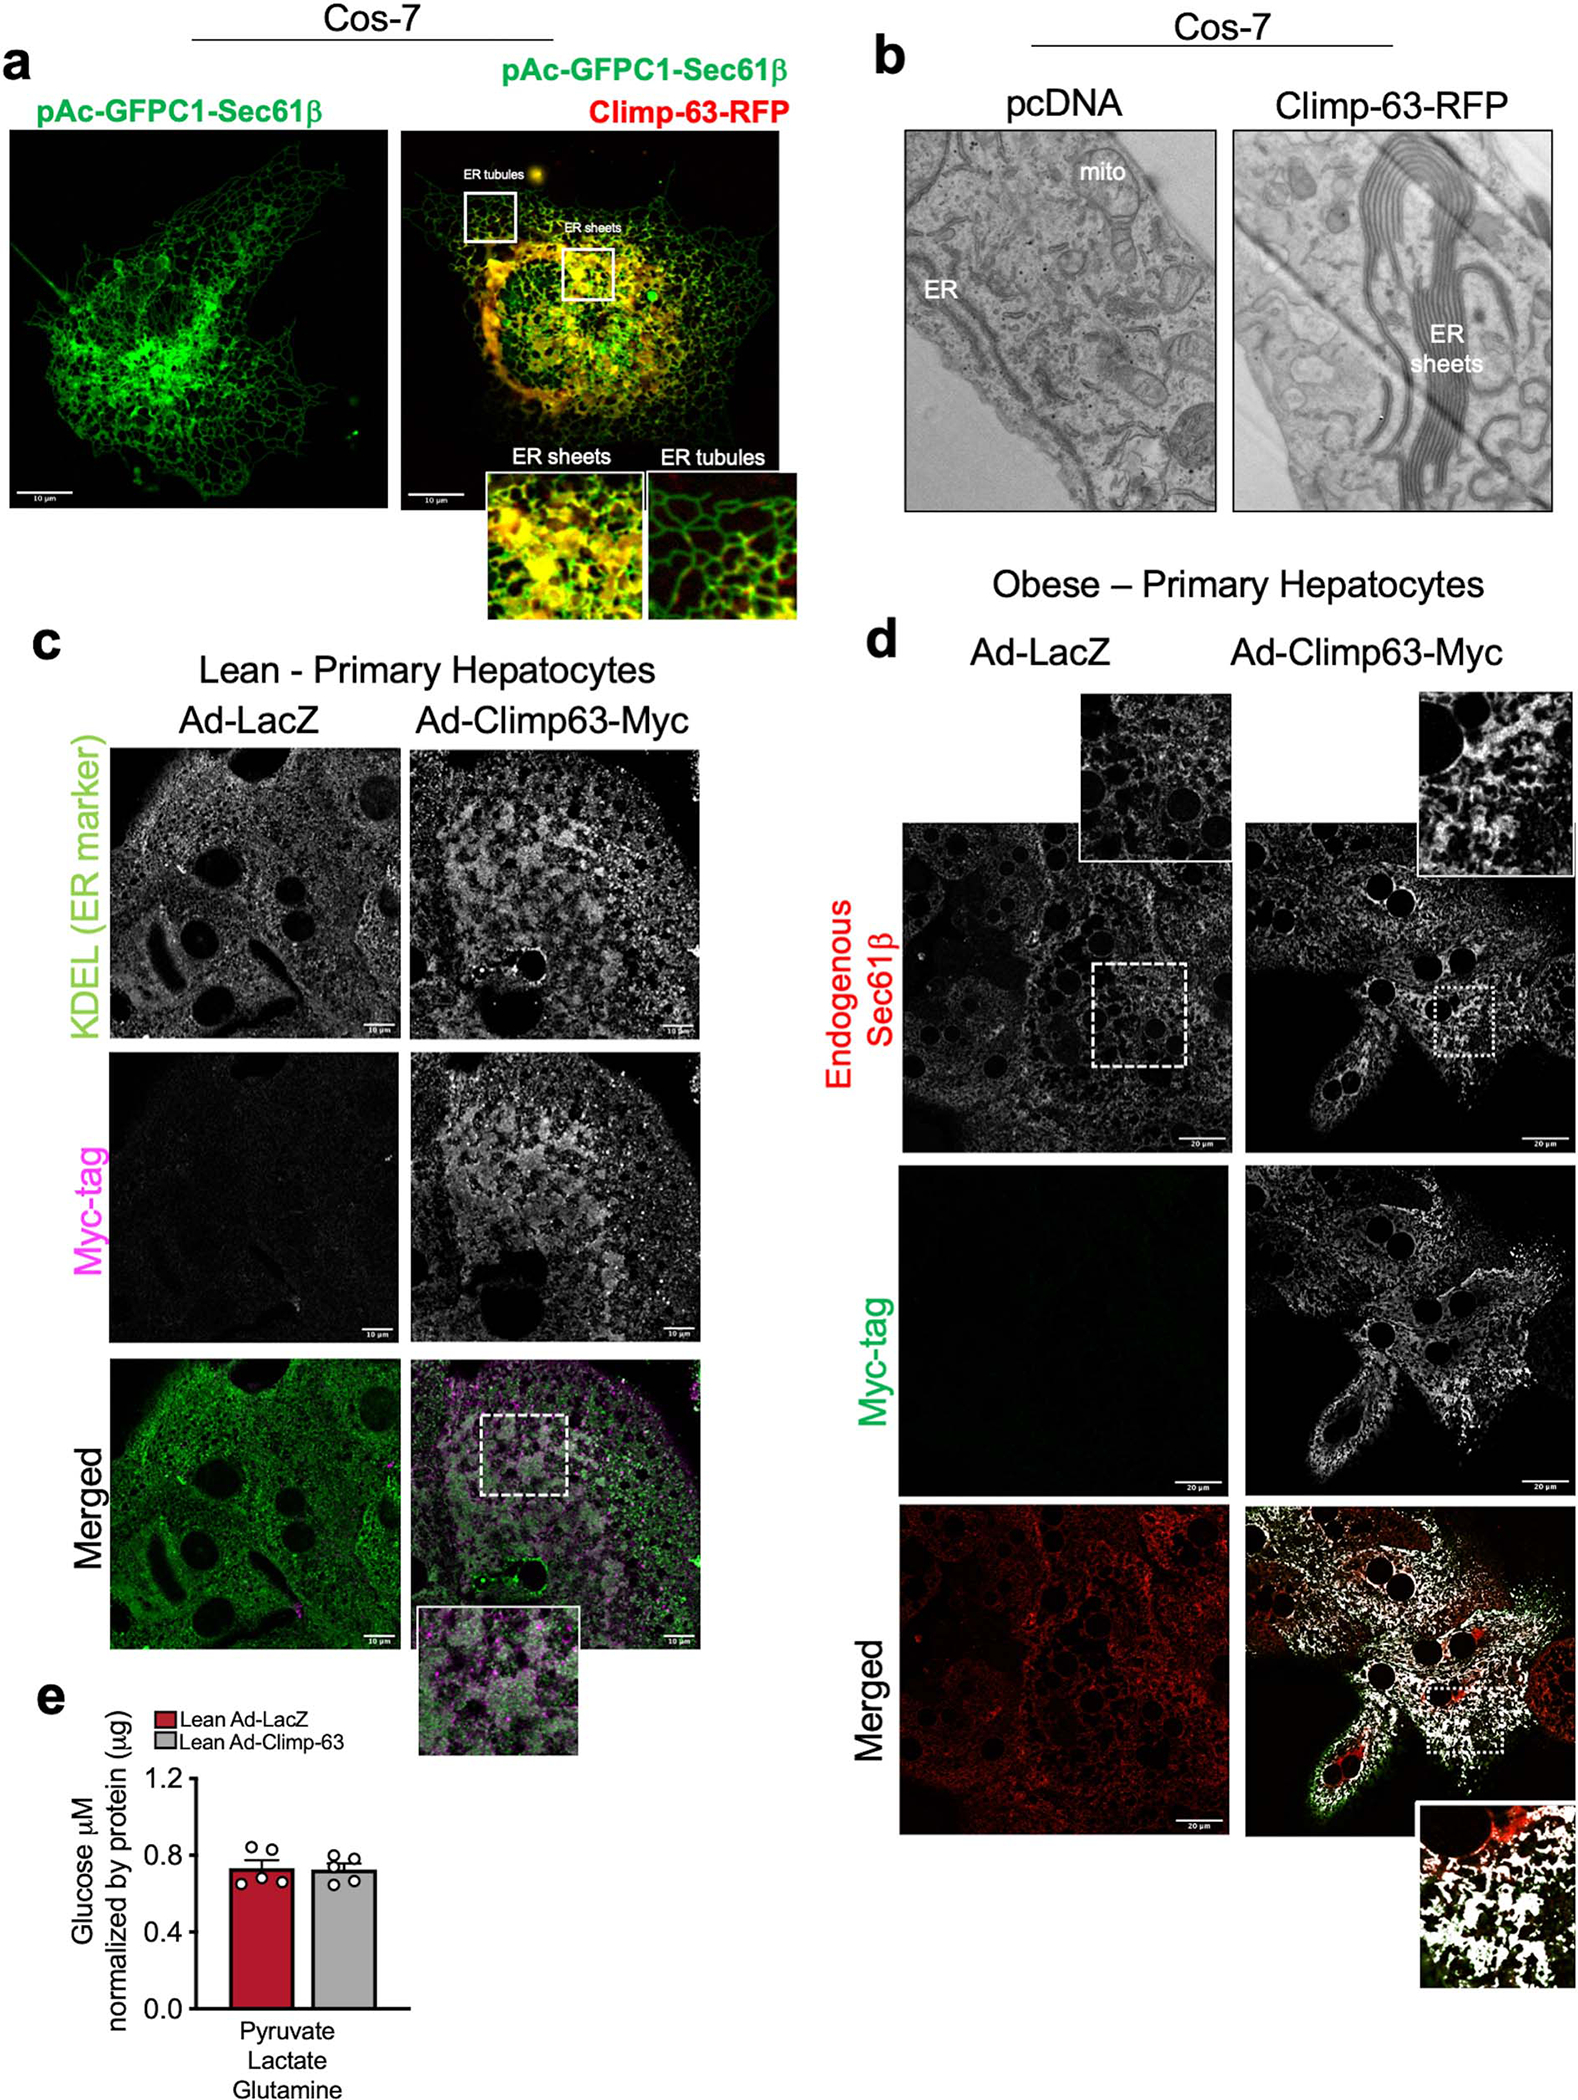
a, Left panel: Confocal images from Cos-7 cells exogenously expressing Sec61β fused with GFP on its N terminal (GFP- Sec61β) as a fluorescent marker for general ER. Right panel: Overlay of images from Cos-7 cells exogenously expressing GFP-Sec61β (green) and Climp-63 fused with RFP (red) in its C terminal (Climp-63-RFP). Overlay is shown in yellow. b, Representative TEM from Cos-7 cell sections expressing control (pcDNA) or Climp-63-RFP constructs. c, Endogenous staining of KDEL sequence as an ER marker (in green) and Myc-tag (in far red) in lean primary hepatocytes expressing either Ad-LacZ or Ad-Climp-63-Myc. Ad: Adenovirus. d, Confocal images of immunofluorescence staining for Myc reflecting Ad-Climp-63-Myc expression in primary hepatocytes from obese mice, expressing Ad-LacZ or Ad-Climp-63-Myc. e, Gluconeogenesis assay in primary hepatocytes isolated from lean mouse, expressing Ad-LacZ or Ad-Climp-63. n=5 biological replicates. Cells were treated with the indicated gluconeogenic substrates in the presence of glucagon for 3 hours. All data (Ext. Data Fig. 7e) are presented as mean values +/− SEM. Unpaired t-test was used for all the statistical analyses.
Extended Data Fig. 8 |. FIB-SEM imaging and automated deep-learning-based segmentation of the 2nd dataset from obese liver and obese liver expressing Climp-63.
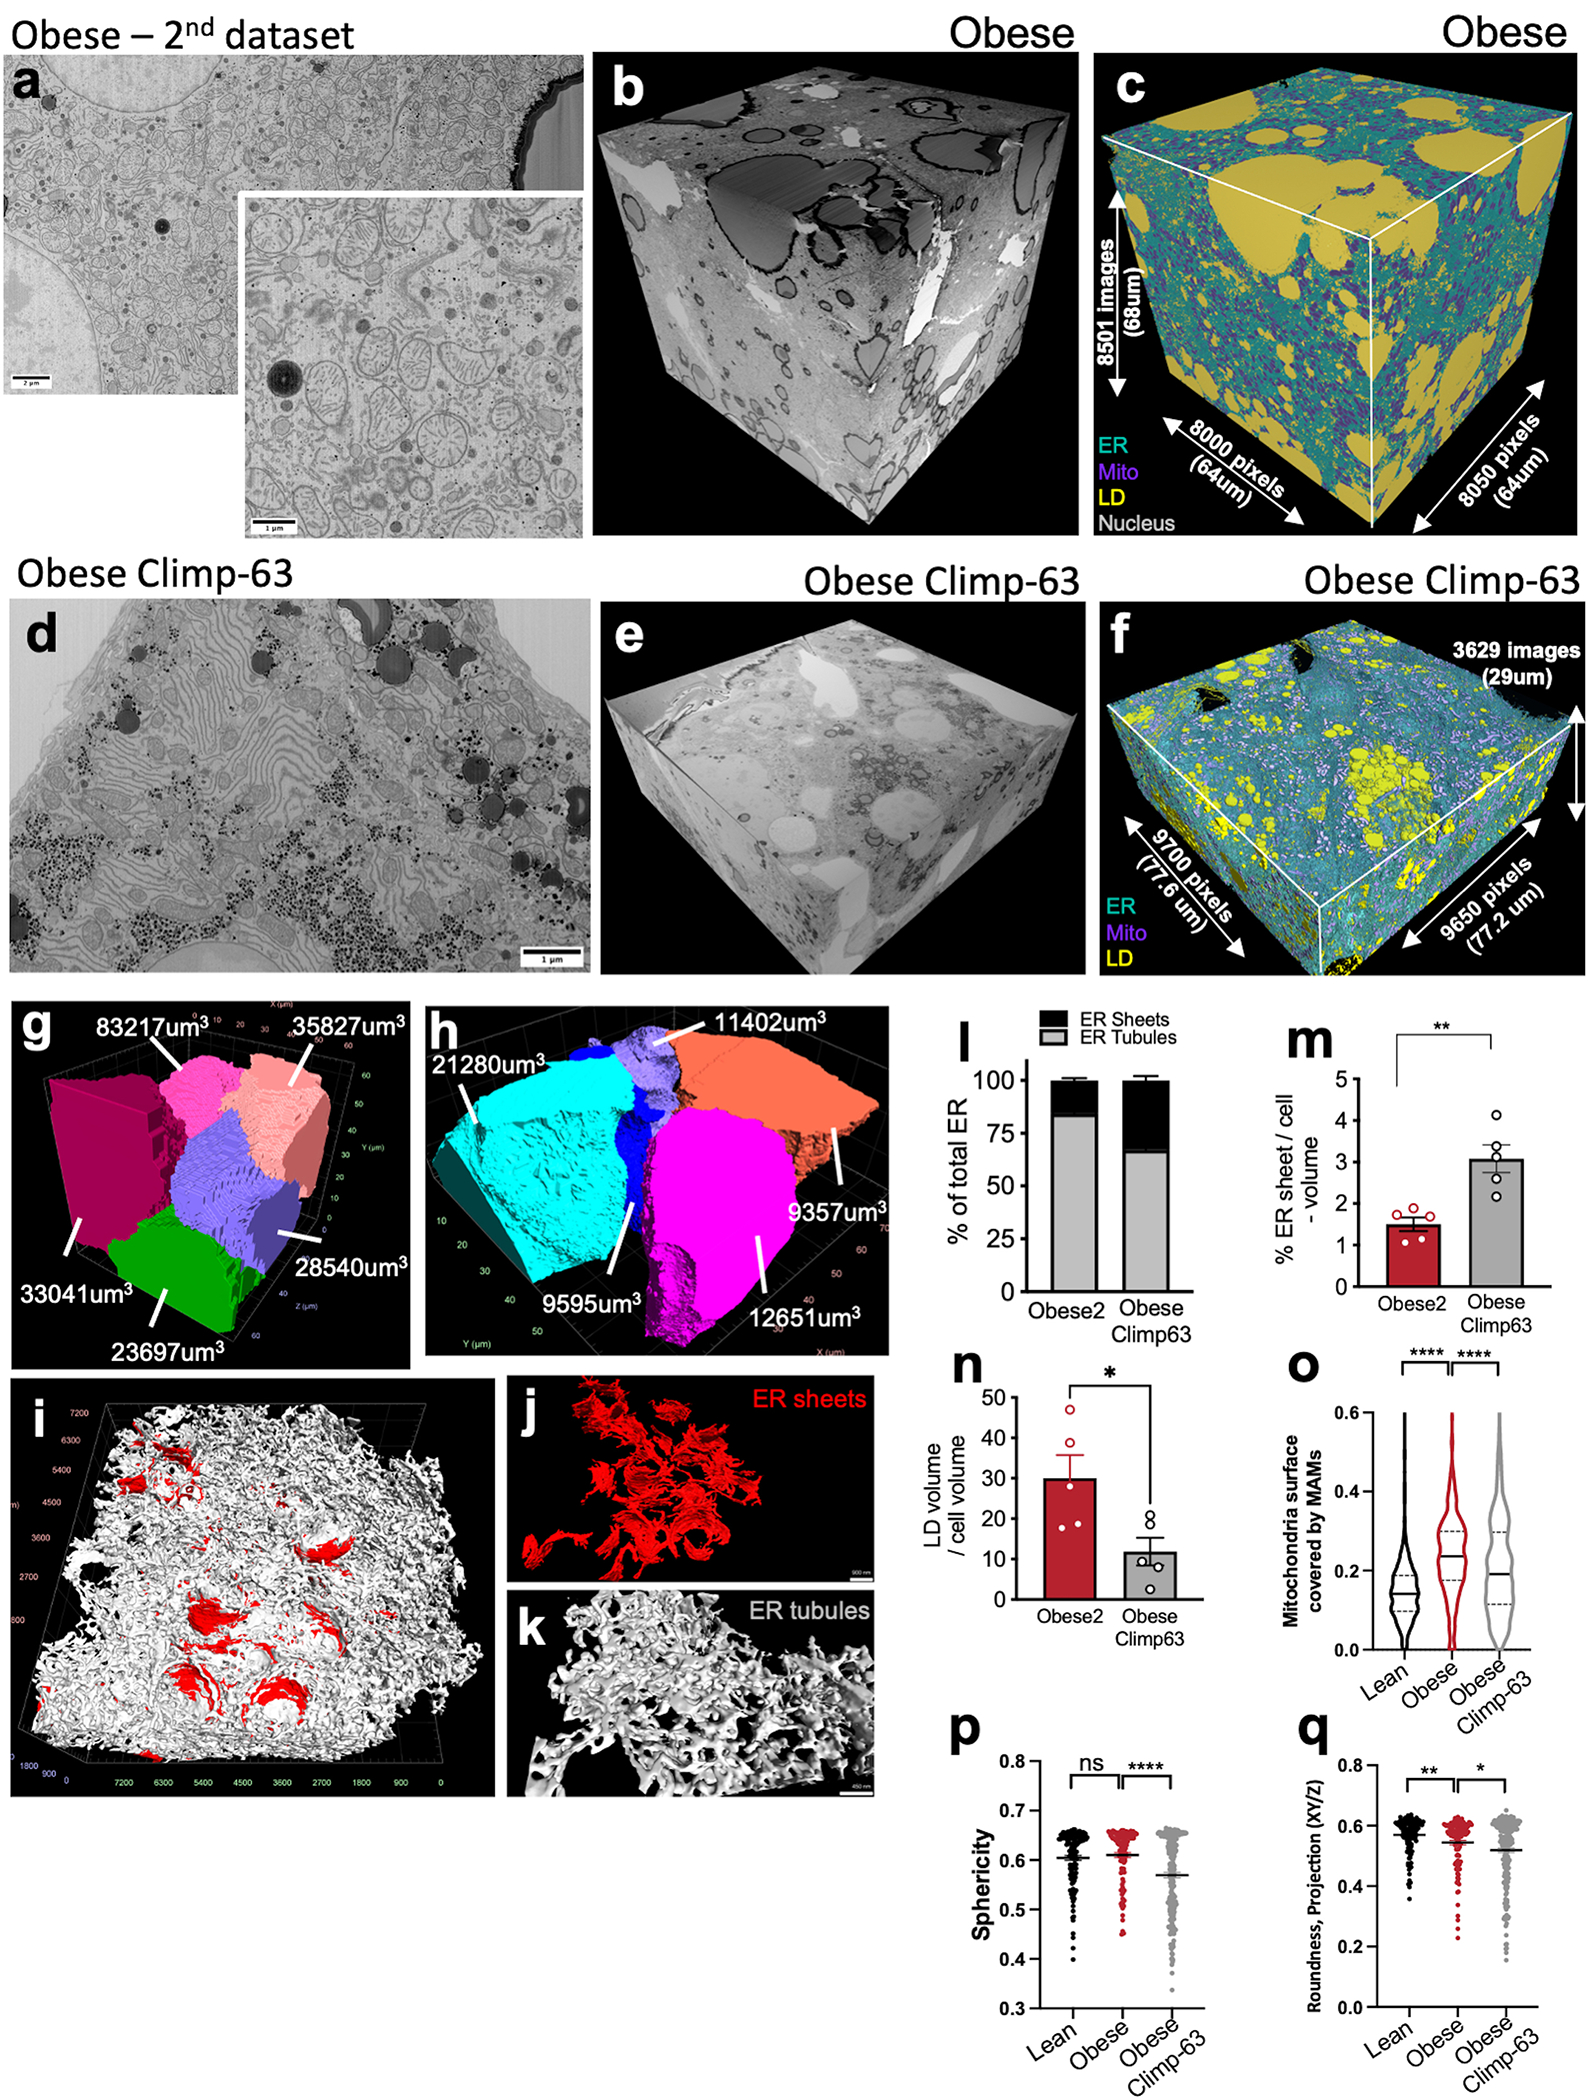
a, Single section SEM of liver from obese mouse liver at 8 nm pixel size. b, 3D-reconstruction of FIB-SEM images. c, Convolutional neural network-based automated segmentation of liver volumes. The dimensions of the volume are depicted in the figure. ER (endoplasmic reticulum, blue), Mito (mitochondria, purple), LD (lipid droplet, yellow), Nucleus (gray). d, Single section SEM of liver from obese mouse expressing Ad-Climp-63 in fed state at 8 nm pixel size. e, 3D reconstruction of FIB-SEM images derived from obese Climp-63 liver volume. f, Convolutional neural network-based automated segmentation of liver volumes. The dimensions of the volume are depicted in the figure. ER (endoplasmic reticulum, blue), Mito (mitochondria, purple), LD (lipid droplet, yellow). g, h, Reconstruction of 5 full or partial hepatocyte volumes from obese liver (g) and obese liver expressing Ad-Climp-63 (h). Volumes of the cells are depicted in the figure. i, Sub-segmentation and 3D reconstruction of ER sheets (red) and tubules (gray) from obese mouse dataset. j, Example volumes of ER sheets and k, ER tubules from this dataset. l, Percent of ER sheets (black) and tubules (gray) relative to total ER from indicated datasets. n=5 cells per group. m, Ratio of ER sheets to tubule volume (**p=0.003). n=5 cells per group. n, Lipid droplet content from the indicated datasets. n=5 cells per group. (*p=0.0256). o, Analysis of mitochondria associated membranes (MAMs) from indicated FIB-SEM datasets. Analysis was done in 3 separate volumes of 2000×2000×400 voxels in each dataset (****p<0.0001). p, q, Analysis of mitochondria sphericity and roundness from indicated FIB-SEM datasets. n=127 (lean), n=112 (obese), n=217 (obese Climp-63) mitochondria. Analysis was done in the same volumes as Ext Fig. 8o, with the mitochondria volumes that are fully present in the ROI (*p=0.003, ****p<0.0001). All data (Ext. Data Fig. 8 l–n, p, q) are presented as mean values +/− SEM. Unpaired t-test was used for all the statistical analyses.
Extended Data Fig. 9 |. Exogenous Climp-63 expression in livers of obese mice rescues rough/smooth ER ratio, restores GRP78 localization to ER sheets and improves ER folding capacity.
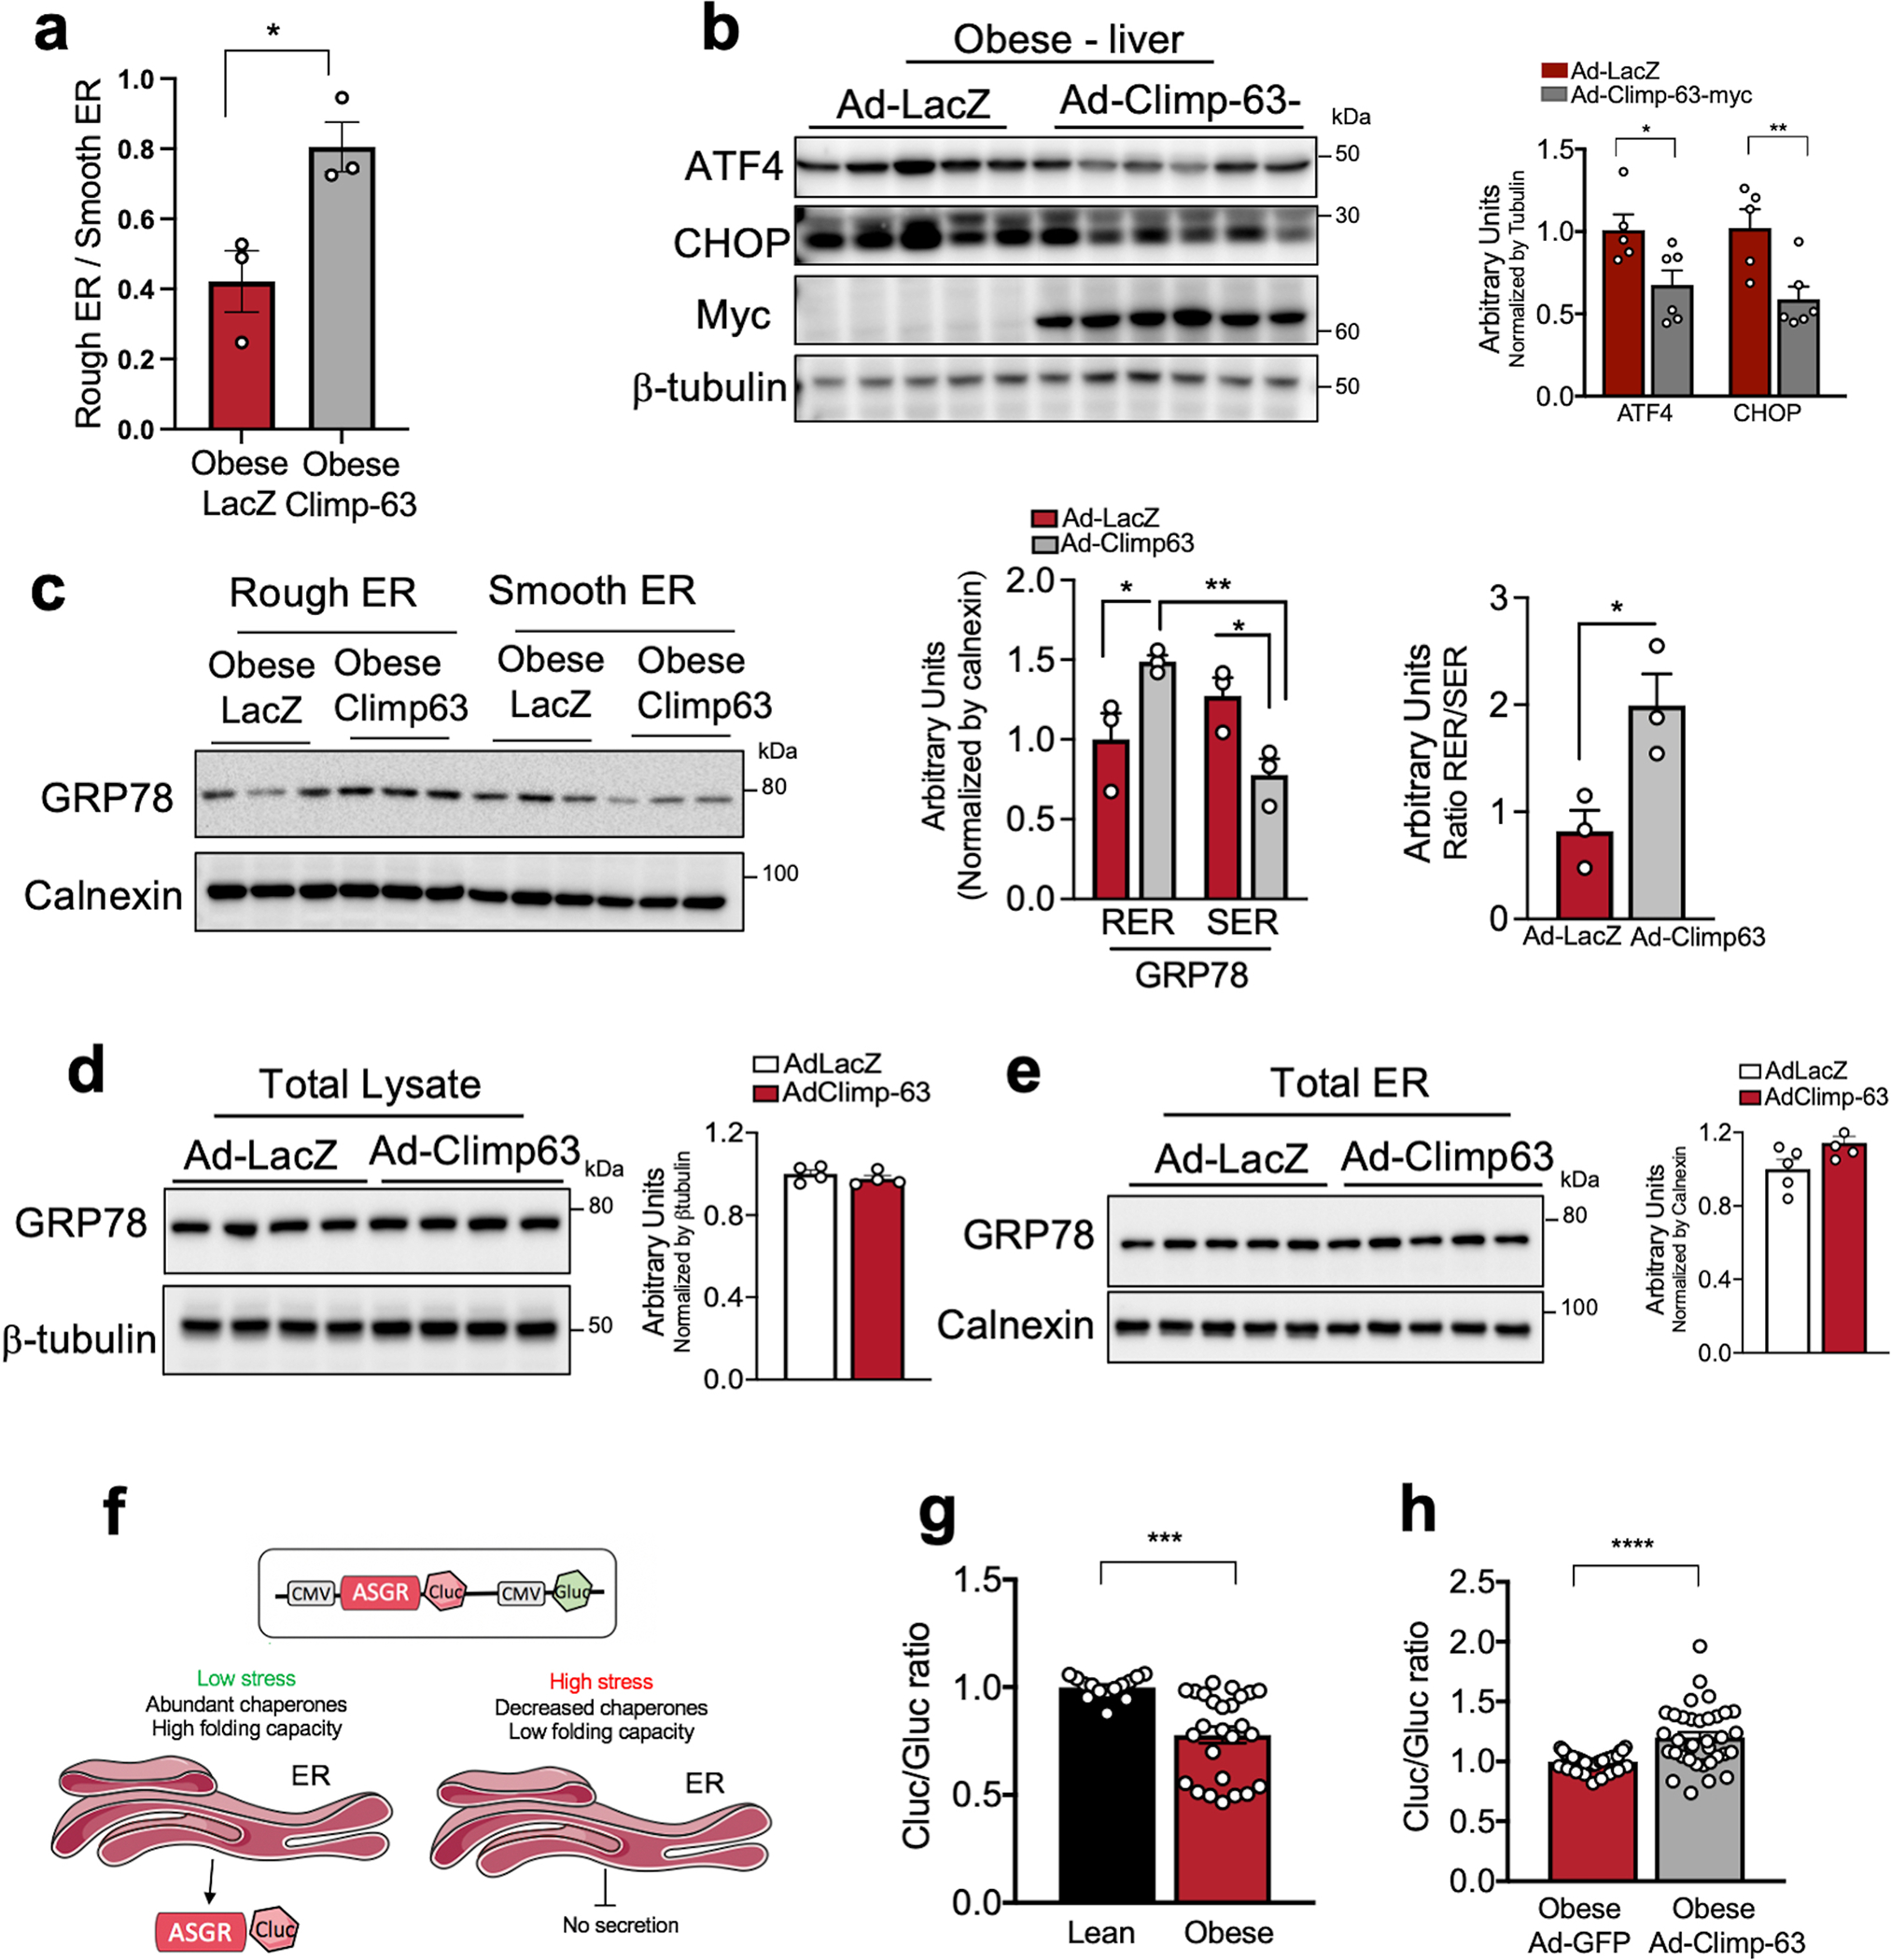
a, Ratio between abundance of rough divided by smooth ER vesicles recovered by liver subcellular fractionation of livers from obese mice expressing Ad-LacZ (n=3 mice) or Ad-Climp-63 (n=3 mice), (*p=0.027). Ad: Adenovirus. b, Immunoblot analysis (left) and quantification (right) of the indicated proteins from total liver lysates (*p=0.03, **p=0.01). n=5 mice for Ad-LacZ and n=6 mice for Ad-Climp-63. c, Immunoblot analysis (left) and quantification (right) of the indicated proteins from rough and smooth ER fractionation (n=3 mice per group) (c), total lysate (n=4 mice per group) (d) and total ER fractions (n=5 mice per group) (e) obtained from obese mice expressing either Ad-LacZ control or Ad-Climp-63 (*p<0.045). f, Scheme describing the ASGR reporter. In this reporter, Cluc indicates the folding and secretion of ASGR-Cluc fusion protein and Gluc, which is constitutively expressed in the construct is used as a normalization of expression level, transfection efficiency and cell densities. g, Quantification of the ratio between luminescence signal from Cluc normalized by luminescence signal derived from Gluc in lean and obese primary hepatocytes. n=14 for lean and n=26 for obese (***p=0.0002). Pooled data from 3 experiments. h, Quantification of the ratio between luminescence signal from Cluc normalized by luminescence signal derived from Gluc in obese primary hepatocytes exogenously expressing GFP or Climp-63. n=36 for GFP and n=35 for Climp-63 (****p<0.0001). Pooled from 6 experiments. All data (Ext. Data Fig. 9a–e, g, h) are presented as mean values +/− SEM. Unpaired t-test was used for all the statistical analyses.
Extended Data Fig. 10 |. Climp-63 exogenous expression decreases SCD1 expression in obesity.
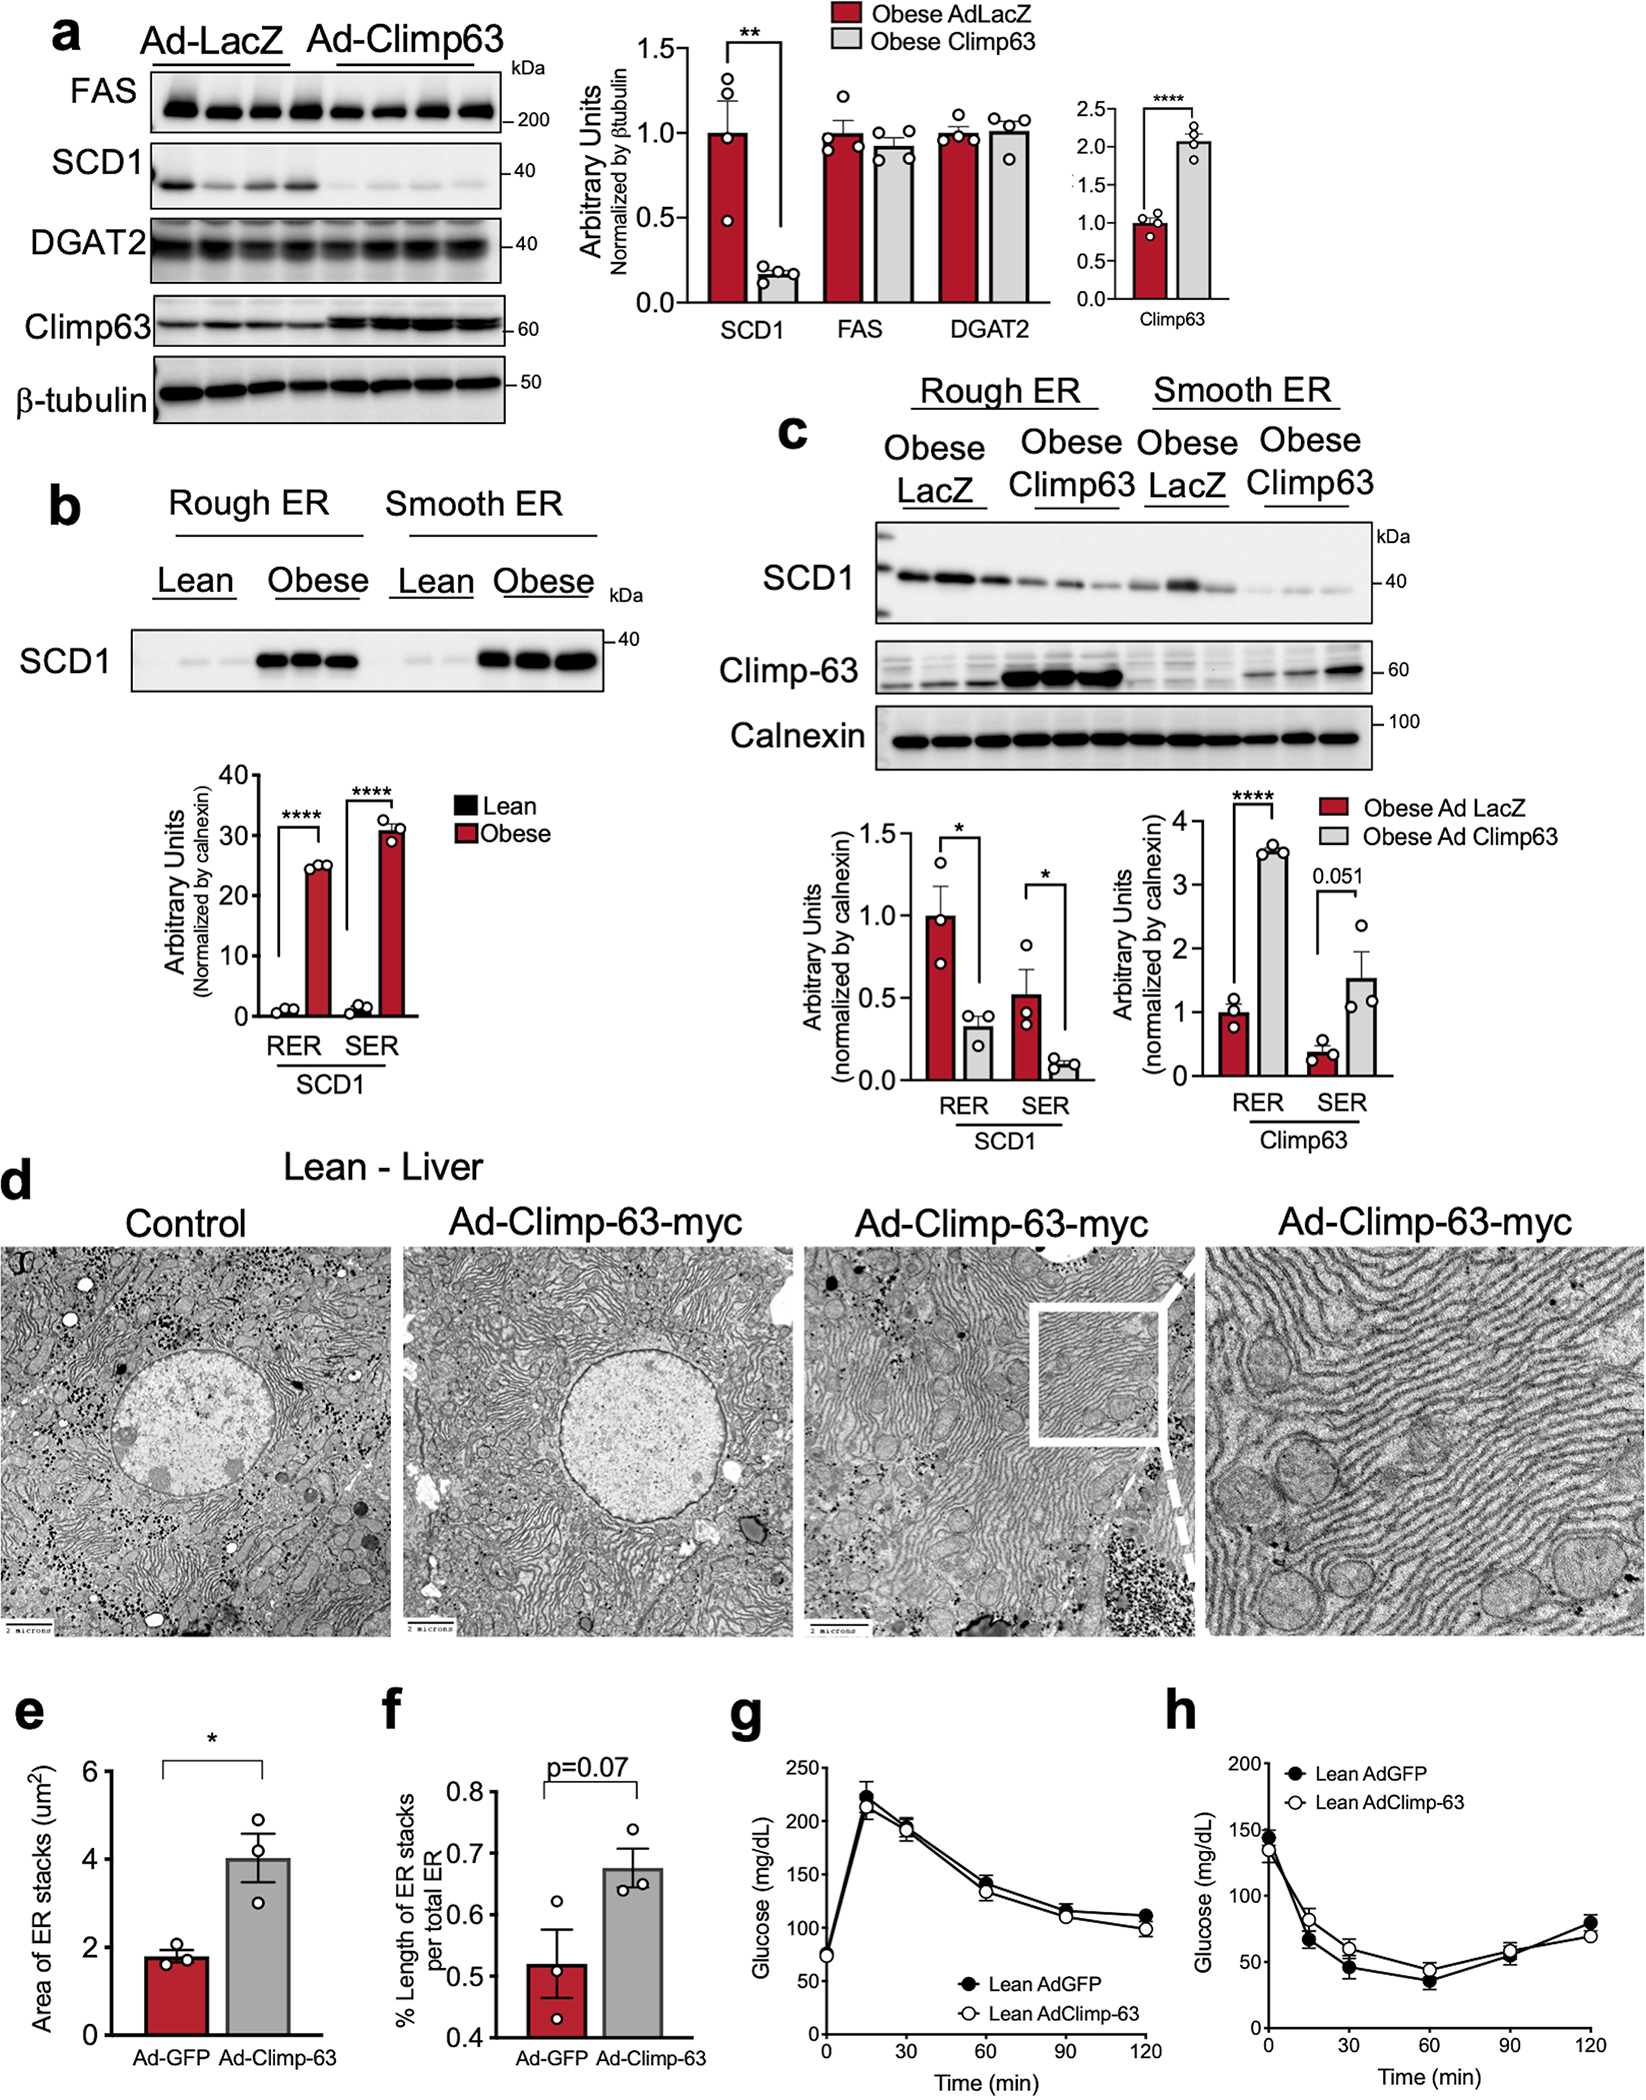
a, Immunoblot analysis (left) and quantification (right) of the indicated proteins from total liver lysates obtained from obese mice expressing either Ad-LacZ control or Ad-Climp-63 (**p=0.0046). Ad: Adenovirus. b, c, Immunoblot analysis (top) and quantification (bottom) of the indicated proteins from rough and smooth ER fractions derived from (b) lean and obese mice and (c) obese mice expressing either Ad-LacZ or Ad-Climp-63 (*p<0.049, ****p<0.0001). The quantification of SCD1 in 10b was normalized to signal for Calnexin shown in Extended Data Fig. 4c, as these samples were from the same experiment. d, Representative TEM from liver sections derived from lean control mice or lean mice overexpressing Climp-63-Myc in vivo. e, f, Quantification of stacks of ER sheets in Fig. 10d (*p=0.017). n=3 TEM images per group. g, Glucose tolerance test in lean mice exogenously expressing Ad-GFP (control) or Ad-Climp-63-myc (n=6 mice per group). h, Insulin tolerance test in lean mice expressing Ad-GFP (control) or Ad-Climp-63-myc (n=6 mice per group). All data (Ext. Data Fig. 10a–c, e, f) are presented as mean values +/− SEM. Unpaired t-test was used for all the statistical analyses.
Supplementary Material
Acknowledgements
We are especially grateful for Ho Man Leung, Nicholas Boss and Refik Anadol for their artistic talent and vision, visualization of the data, generating outstanding videos and generously sharing the resources and expertise of the Refik Anadol Studio (Los Angeles, CA). We would like to thank Elizabeth Benecchi, Maria Ericsson and Louise Trakimas for their help in sample preparation for TEM. We appreciate Marcelo Cicconet for his help with generating the Matlab codes. We would like to thank Christopher Zugates for his help and guidance in using the Arivis Vision 4D software. We appreciate Adrian Wanner, Jörgen Kornfeld and the whole Ariadne team’s effort and help with the segmentation. We thank all members of the Sabri Ülker Center and Hotamisligil Lab community for their continued support and encouragement. This project is supported by the Sabri Ülker Center for Metabolic Research. GP is supported by an NIH training grant (5T32DK007529-32).
Footnotes
Competing interests
C.S.X and H.F.H are the inventors of a US patent assigned to HHMI for the enhanced FIB-SEM systems used in this work: Xu, C.S., Hayworth K.J., Hess H.F. (2020) Enhanced FIB-SEM systems for large-volume 3D imaging. US Patent 10,600,615, 24 Mar 2020. Other authors have no conflicts of interest to declare.
References
- 1.Xu CS et al. Enhanced FIB-SEM systems for large-volume 3D imaging. eLife 6, (2017). [DOI] [PMC free article] [PubMed] [Google Scholar]
- 2.Xu CS, Pang S, Hayworth KJ & Hess HF Transforming FIB-SEM systems for large-volume connectomics and cell biology. in Neuromethods vol. 155 221–243 (Humana Press Inc., 2020). [Google Scholar]
- 3.Terasaki M et al. Stacked endoplasmic reticulum sheets are connected by helicoidal membrane motifs. Cell 154, 285–296 (2013). [DOI] [PMC free article] [PubMed] [Google Scholar]
- 4.Ben-Moshe S & Itzkovitz S Spatial heterogeneity in the mammalian liver. Nature Reviews Gastroenterology & Hepatology 16, 395–410 (2019). [DOI] [PubMed] [Google Scholar]
- 5.Lee AH, Chu GC, Iwakoshi NN & Glimcher LH XBP-1 is required for biogenesis of cellular secretory machinery of exocrine glands. EMBO Journal 24, 4368–4380 (2005). [DOI] [PMC free article] [PubMed] [Google Scholar]
- 6.Zirkin BR & Papadopoulos V Leydig cells: formation, function, and regulation. Biology of Reproduction vol. 99 101–111 (2018). [DOI] [PMC free article] [PubMed] [Google Scholar]
- 7.Valm AM et al. Applying systems-level spectral imaging and analysis to reveal the organelle interactome. Nature vol. 546 162–167 (2017). [DOI] [PMC free article] [PubMed] [Google Scholar]
- 8.Lee JE, Cathey PI, Wu H, Parker R & Voeltz GK Endoplasmic reticulum contact sites regulate the dynamics of membraneless organelles. Science (New York, N.Y.) 367, (2020). [DOI] [PMC free article] [PubMed] [Google Scholar]
- 9.West M, Zurek N, Hoenger A & Voeltz GKA 3D analysis of yeast ER structure reveals how ER domains are organized by membrane curvature. Journal of Cell Biology 193, 333–346 (2011). [DOI] [PMC free article] [PubMed] [Google Scholar]
- 10.Nixon-Abell J et al. Increased spatiotemporal resolution reveals highly dynamic dense tubular matrices in the peripheral ER. Science 354, (2016). [DOI] [PMC free article] [PubMed] [Google Scholar]
- 11.Heinrich L et al. Whole-cell organelle segmentation in volume electron microscopy. Nature 599, (2021). [DOI] [PubMed] [Google Scholar]
- 12.Goyal U & Blackstone C Untangling the web: mechanisms underlying ER network formation. Biochimica et Biophysica Acta - Molecular Cell Research 1833, 2492–2498 (2013). [DOI] [PMC free article] [PubMed] [Google Scholar]
- 13.Shibata Y et al. Mechanisms determining the morphology of the peripheral ER. Cell 143, 774–788 (2010). [DOI] [PMC free article] [PubMed] [Google Scholar]
- 14.Chen S, Novick P & Ferro-Novick S ER structure and function. Current Opinion in Cell Biology vol. 25 428–433 (2013). [DOI] [PMC free article] [PubMed] [Google Scholar]
- 15.Westrate LM, Lee JE, Prinz WA & Voeltz GK Form follows function: the importance of endoplasmic reticulum shape. Annual review of biochemistry 84, 791–811 (2015). [DOI] [PubMed] [Google Scholar]
- 16.Lynes EM & Simmen T Urban planning of the endoplasmic reticulum (ER): how diverse mechanisms segregate the many functions of the ER. Biochimica et Biophysica Acta - Molecular Cell Research vol. 1813 1893–1905 (2011). [DOI] [PMC free article] [PubMed] [Google Scholar]
- 17.Voeltz GK, Prinz WA, Shibata Y, Rist JM & Rapoport TA A class of membrane proteins shaping the tubular endoplasmic reticulum. Cell 124, 573–586 (2006). [DOI] [PubMed] [Google Scholar]
- 18.Sandoz PA & van der Goot FG How many lives does CLIMP-63 have? Biochemical Society Transactions vol. 43 222–228 (2015). [DOI] [PMC free article] [PubMed] [Google Scholar]
- 19.Shen B et al. Calumenin-1 interacts with Climp63 to cooperatively determine the luminal width and distribution of endoplasmic reticulum sheets. iScience 22, 70–80 (2019). [DOI] [PMC free article] [PubMed] [Google Scholar]
- 20.Zhang H & Hu J Shaping the endoplasmic reticulum into a social network. Trends in Cell Biology vol. 26 934–943 (2016). [DOI] [PubMed] [Google Scholar]
- 21.Arruda AP et al. Chronic enrichment of hepatic endoplasmic reticulum-mitochondria contact leads to mitochondrial dysfunction in obesity. Nature medicine 20, 1427–1435 (2014). [DOI] [PMC free article] [PubMed] [Google Scholar]
- 22.Fu S et al. Phenotypic assays identify azoramide as a small-molecule modulator of the unfolded protein response with antidiabetic activity. Science Translational Medicine 7, (2015). [DOI] [PMC free article] [PubMed] [Google Scholar]
- 23.Hotamisligil GS Endoplasmic reticulum stress and the inflammatory basis of metabolic disease. Cell 140, 900–917 (2010). [DOI] [PMC free article] [PubMed] [Google Scholar]
Method References
- 24.Fu S et al. Aberrant lipid metabolism disrupts calcium homeostasis causing liver endoplasmic reticulum stress in obesity. Nature 473, 528–531 (2011). [DOI] [PMC free article] [PubMed] [Google Scholar]
- 25.Arruda AP et al. Defective STIM-mediated store operated Ca2+ entry in hepatocytes leads to metabolic dysfunction in obesity. eLife 6, (2017). [DOI] [PMC free article] [PubMed] [Google Scholar]
- 26.Shibata Y et al. The reticulon and DP1/Yop1p proteins form immobile oligomers in the tubular endoplasmic reticulum. The Journal of biological chemistry 283, 18892–18904 (2008). [DOI] [PMC free article] [PubMed] [Google Scholar]
- 27.Akie TE & Cooper MP Determination of fatty acid oxidation and lipogenesis in mouse primary hepatocytes. JoVE (Journal of Visualized Experiments) 2015, e52982 (2015). [DOI] [PMC free article] [PubMed] [Google Scholar]
- 28.Margolis RN, Cardell RR & Curnow RT Association of glycogen synthase phosphatase and phosphorylase phosphatase activities with membranes of hepatic smooth endoplasmic reticulum. The Journal of cell biology 83, 348–356 (1979). [DOI] [PMC free article] [PubMed] [Google Scholar]
- 29.Iudin A, Korir PK, Salavert-Torres J, Kleywegt GJ & Patwardhan A EMPIAR: a public archive for raw electron microscopy image data. Nature Methods 2016 13:5 13, 387–388 (2016). [DOI] [PubMed] [Google Scholar]
Associated Data
This section collects any data citations, data availability statements, or supplementary materials included in this article.
Supplementary Materials
Data Availability Statement
Raw FIB-SEM, segmentation and evaluation data are deposited to EMPIAR database29 and can be reached at https://dx.doi.org/10.6019/EMPIAR-10791. The uncropped raw versions of the western blots generated during the current study are provided in Supplementary Figure 1. Source data are provided with this paper. Supplementary videos can also be reached at https://www.youtube.com/playlist?list=PLpzquMkvsJ9UDo2SROFj1ibGxC4XkbMwO