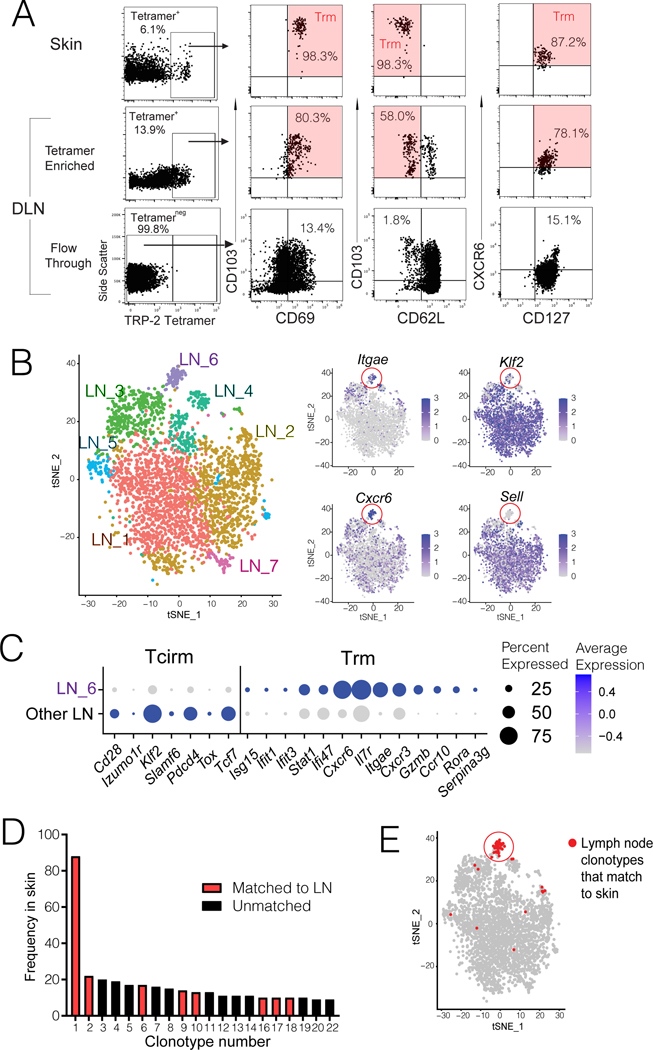
Figure 5. Lymph node Trm populations are comprised of endogenous tumor-specific T cells.
Endogenous CD8+ T cells from regional LNs of mice with MAV (induced as in Figure 1A, but without pmel cell transfer) were analyzed by either (A) tetramer staining or (B-C) scRNAseq and paired TCRseq, with skin as a reference population. (A) H-2Kb TRP-2180–188 tetramer staining, gated on CD8+CD44+ cells from skin (top row), or draining LN tetramer-enriched and - depleted fractions (middle and bottom rows). Phenotype of each gated population is shown at right; Trm phenotype is highlighted in red. Data are representative of two experiments. (B) tSNE clustering of 3266 FACS-sorted CD8+CD44+ T cells from regional LNs pooled from 15 mice with MAV, analyzed by scRNAseq, revealing seven distinct transcriptional clusters (left) with representative Trm and Tcirm gene expression depicted across clusters (right); red circles highlight the LN_6 cluster. (C) Plots depict average Z-transformed normalized expression of representative Trm and Tcirm genes in LN_6 cluster relative to all other LN clusters. (D) Frequency of twenty most expanded clonotypes in skin of these mice, indicating eight clones that were matched to cells from regional LNs. (E) tSNE projection of LN clusters highlighting (in red) those T cells that were clonally matched to skin. Each dot corresponds to a single cell.

