

Abstract
COVID‐19 is a disease characterized by acute respiratory failure and is a major health problem worldwide. Here, we aimed to investigate the role of CD39 expression in Treg cell subsets in COVID‐19 immunopathogenesis and its relationship to disease severity. One hundred and ninety COVID‐19 patients (juveniles, adults) and 43 volunteers as healthy controls were enrolled in our study. Flow cytometric analysis was performed using a 10‐color monoclonal antibody panel from peripheral blood samples. In adult patients, CD39+ Tregs increased with disease severity. In contrast, CD39+ Tregs were decreased in juvenile patients in an age‐dependent manner. Overall, our study reveals an interesting profile of CD39‐expressing Tregs in adult and juvenile cases of COVID‐19. Our results provide a better understanding of the possible role of Tregs in the mechanism of immune response in COVID‐19 cases.
Keywords: CD39, COVID‐19, FoxP3, infectious diseases, Tregs
Research Highlights
CD39+ Tregs increased with disease severity in adult COVID‐19 cases. In addition, significant changes were also observed in other Treg subsets.
Treg subsets in the juvenile COVID‐19 cases showed age‐related variability but were significantly lower than in the healthy control group.
Consistent correlations were found between laboratory findings in adult COVID‐19 cases and Treg subsets.
1. INTRODUCTION
At the end of December 2019, a group of patients was referred to hospitals with a preliminary diagnosis of pneumonia characterized by an uncertain etiology. 1 The disease, caused by severe acute respiratory syndrome coronavirus‐2 (SARS‐CoV‐2), was named coronavirus disease 2019 (COVID‐19). More than 5 million deaths from the disease have been reported through November 25, 2021, along with nearly 260 million COVID‐19 cases. 2 Although a large amount of information has been obtained about COVID‐19 since the diagnosis of the first case, the response of the patient's immune system is still not fully understood.
Regulatory T (Treg) cells have been shown to play an essential role in immune homeostasis in many diseases and pathological conditions. 3 In addition to the well‐described role of Tregs in immune tolerance, recent studies have demonstrated their prominent role in the immune response to chronic infection by pathogens, including viral pneumonia and viral origin acute lung injury (ALI). The results of these studies suggest that the effector activity of CD8+ T (Cytotoxic T) cells decreases during viral infections. 4 , 5 , 6
CD25 and CD127 have been suggested as two reliable markers for Tregs. Although these markers are not unique to Tregs, they allow the identification of a large population of Tregs. CD4+CD25highCD127low cells are often considered as bona fide Tregs. 7 , 8 In addition, the transcription factor forkhead box P3 (FoxP3) has been identified as a specific marker of Tregs. 9 FoxP3 has been shown to be involved in the essential immunosuppressive properties of Tregs in autoimmune diseases. 10 Taking into consideration the heterogeneous phenotypes of these cells, two phenotypes seem to be beneficial in identifying Tregs. The determination of CD4+CD25high and CD4+CD25highCD127low cells with the expression of the transcription factor FoxP3 is prime in determining the Treg cell pool. 11 Another marker, Helios, a transcription factor belonging to the Ikaros family, has been proposed as a marker for thymic Tregs (tTregs). In addition, it has been reported that it can be used to distinguish between peripheral and thymus‐derived Tregs. 12 Moreover, Zabransky et al. 13 reported that Helios+FoxP3+ Tregs have stronger immunosuppressive properties than Helios‐FoxP3+ Tregs.
Tregs are divided into three subsets based on the suppressive functions of the cells. CD4+CD45RA+FoxP3low cells represent naïve or resting Tregs (nTreg), whereas CD4+CD45RA‐FoxP3high cells are known as activated effector Tregs (eTreg). 14 , 15 Both Treg cell subsets have been reported to have immunosuppressive effects in vitro. Another subset of FoxP3+ T cells, CD4+CD45RA−FoxP3low cells, are functionally distinct from the Treg subsets often referred to as non‐Tregs. These cell subsets are characterized by expressing proinflammatory cytokines and having no immunosuppressive effects. 16 , 17
CD39 is an ectoenzyme that can hydrolyze adenosine triphosphate (ATP) and adenosine diphosphate to adenosine monophosphate (AMP). The hydrolyzed AMPs are then converted by CD73 into anti‐inflammatory adenosine (ADO), which can bind to adenosine receptors on T cells and antigen‐presenting cells. 18 ADO, which occurs particularly as a result of changes in ATP metabolism, plays an important role in the immunosuppressive and anti‐inflammatory effects of Tregs. As CD39 can directly contribute to the suppressive capacity of Tregs, it is considered a functional Treg marker. 19 Some studies have reported that CD4+CD25+CD39+ Tregs have more immunosuppressive effects than CD4+CD25+CD39− Tregs. 20
Tregs in COVID‐19 have been a notable area of research recently. Several studies have provided insights into the role of CD4+ Tregs (CD25+CD127low, CD25+FoxP3high/+, CD45RA−FoxP3high) in COVID‐19. In studies of peripheral blood, PBMCs, and lung samples, some authors reported that Tregs increased, while others thought that these cells decreased or remained unchanged. 21 In addition to phenotypic analyses, studies were supported by gene expression and transcriptome analyses. 22 For example, soluble CD25 in peripheral blood was reported to be elevated in COVID‐19 patients. 23 In addition, FoxP3 expression has been proposed as a biomarker of disease progression. 24 However, some other studies have reported conflicting results in both cases. 25 In conclusion, the question of whether Tregs support or hinder COVID‐19 immunopathogenesis remains to be investigated.
In our study, we aimed to investigate the role of CD39‐expressing Treg cell subsets in the immunopathogenesis of COVID‐19 and their relationship to disease severity. Our findings on the association of Tregs with COVID‐19 immunity effectively support the uncovering of the poorly understood mechanism of immune response in these cases and make valuable contributions to knowledge that could initiate new therapeutic approaches.
2. MATERIALS AND METHODS
2.1. Patients and clinical assessments
One hundred and twenty‐six adult patients (57 females and 69 males; age: 51.89 ± 1.4) and 64 juvenile patients (34 girls and 30 boys; mean age of age group 0–12 years: 4.9 ± 0.64 and of age group 13–18 years: 15.50 ± 0.25) diagnosed with COVID‐19 who applied to and/or were followed‐up at Bursa Uludag University, Faculty of Medicine, Department of Infectious Diseases, and University of Health Sciences, Bursa Yuksek Ihtisas Training and Research Hospital, Department of Pediatric Infectious Diseases and Department of Infectious Diseases, participated in the study. The demographic and clinical picture in the adult and juvenile patient groups of COVID‐19 is demonstrated in Table 1. In addition, five patients in the adult group and 28 patients in the juvenile group were followed up within 6 weeks of discharge. Moreover, a total of 43 (25 adult and 18 juvenile) adult and juvenile volunteers participated in the study as a healthy control group. A summary overview of the patients included in the study can be found in Figure S1. The adult control group consisted of healthy volunteers who applied to the blood donation center as donor candidates and were not diagnosed with COVID‐19, had no known or recognized disease, and were aged between 18 and 84 years. The juvenile control group included healthy children under 18 years of age who came for routine checkups (growth and development monitoring) for reasons other than infection. Laboratory findings in the adult and juvenile patient groups of COVID‐19 are shown in Table 2. The hematologic abnormalities and comorbidity analysis of the patients are shown in Figure S, 2. In addition, only unvaccinated individuals were included in the study.
Table 1.
Demographic and clinical picture in adult and juvenile patient groups of COVID‐19
| Adult patients | ||||||
|---|---|---|---|---|---|---|
| Total illness (n = 126) | Noncomplicated (n = 33) | Mild pneumonia (n = 39) | Severe pneumonia (n = 54) | Healthy controls (n = 25) | p value | |
| Sex, n (%) | ||||||
| Male | 69 (53.2) | 17 (51.5) | 22 (56.4) | 30 (55.6) | 11 (44) | 0.906 |
| Female | 57 (46.8) | 16 (48.5) | 17 (43.6) | 24 (44.4) | 14 (56) | |
| Age (years), median (min–max) | 49 (19–89) | 41 (19–80) | 49 (26–80) | 59 (24–89) | 39.5 (22–64) | <0.01 a |
| Comorbidity, n (%) | ||||||
| Hypertension | 22 (17.5) | 7 (21.2) | 4 (10.3) | 11 (20.4) | ‐ | 0.331 |
| Diabetes mellitus | 24 (19) | 5 (15.2) | 5 (12.8) | 14 (25.9) | ‐ | 0.228 |
| Cardiovascular disease | 12 (9.5) | 3 (9.1) | 3 (7.7) | 6 (11.1) | ‐ | 0.853 |
| Chronic pulmonary disease | 10 (7.9) | 4 (12.1) | 1 (2.6) | 5 (9.3) | ‐ | 0.292 |
| Other | 27 (21.4) | 7 (21.2) | 11 (28.2) | 9 (16.7) | ‐ | 0.408 |
| Symptoms at admission, n (%) | ||||||
| Fever | 38 (30.2) | 11 (33.3) | 9 (23.1) | 18 (33.3) | ‐ | 0.510 |
| Cough | 65 (51.6) | 11(33.3) | 26 (66.7) | 28 (51.9) | ‐ | 0.019*a |
| Dyspnea | 28 (22.2) | 6 (18.2) | 5 (12.8) | 17 (31.5) | ‐ | 0.083 |
| Myalgia | 26 (20.6) | 5 (15.2) | 6 (15.4) | 15 (27.8) | ‐ | 0.229 |
| Sore throat | 20 (15.9) | 6 (18.2) | 6 (15.4) | 8 (14.8) | ‐ | 0.912 |
| Headache | 16 (12.7) | 9 (27.3) | 4 (10.3) | 3 (5.6) | ‐ | 0.011*a |
| Anosmia | 5 (4) | 1 (3) | 3 (7.7) | 1 (1.9) | ‐ | 0.345 |
| Diarrhea | 14 (11.1) | 3 (9.1) | 3 (7.7) | 8 (14.8) | ‐ | 0.510 |
| Fatigue | 31 (23.8) | 8 (24.2) | 11 (28.2) | 12 (20.4) | ‐ | 0.680 |
| Smoker | 7 (5.6) | 3 (9.1) | 2 (5.1) | 2 (3.7) | ‐ | 0.562 |
| Need to mechanical ventilation | 27 (21.4) | 0 (0) | 0 (0) | 27 (50) | N/A | |
| Juvenile patients | |||||
|---|---|---|---|---|---|
| Total illness (n = 64) | 0–12 age group (n = 29) | 13–18 age group (n = 35) | Healthy control (n = 18) | p value | |
| Sex, n (%) | |||||
| Male | 30 (46.9) | 16 (55,2) | 14 (40) | 10 (55,5) | 0.390b |
| Female | 34 (53.1) | 13 (44.8) | 21 (60) | 8 (14,5) | |
| Age (years), median (min–max) | 11 (0–18) | 5 (0–12) | 15 (13–18) | 9 (0.17) | 0.621b |
| Comorbidity | There is no comorbid disease in juvenile patients. | ||||
| Symptoms at admission, n (%) | |||||
| Fever | 37 (57.8) | 19 (65.5) | 18 (51.4) | ‐ | 0.189c |
| Cough | 18 (28.1) | 7 (24.1) | 11 (31.4) | ‐ | 0.359c |
| Dyspnea | 2 (3.1) | 1 (3.4) | 1 (2.9) | ‐ | N/A |
| Myalgia | 2 (3.1) | ‐ | 2 (5.7) | ‐ | N/A |
| Sore throat | 5 (7.8) | 1 (3.4) | 4 (11.4) | ‐ | 0.242c |
| Headache | 8 (12.5) | 1 (3.4) | 7 (20) | ‐ | 0.049* c |
| Anosmia | ‐ | ‐ | ‐ | ‐ | N/A |
| Diarrhea | 7 (10.9) | 3 (10.3) | 4 (11.4) | ‐ | 0.607c |
| Fatigue | 1 (1.6) | ‐ | 1 (2.9) | ‐ | N/A |
| Smoker | ‐ | ‐ | ‐ | ‐ | N/A |
Note: Statistically significant (*) results are shown in bold.
Comparison between multiple groups in adults.
COVID‐19 versus healthy controls.
COV 0–12 versus COV 13–18.
Table 2.
Laboratory findings in adult and juvenile patient groups of COVID‐19
| Adult patients | ||||||
|---|---|---|---|---|---|---|
| Normal range | Noncomplicated cases | Mild pneumonia | Severe pneumonia | All patients | p value | |
| White blood cell count (K/µl) | 4.5–11 | 5.8 (3.3–14.7) | 6.3 (2.3–15.2) | 6.4 (1.0–26.1) | 6.2 (1.0–26.1) | 0.012 a |
| Neutrophil count (K/µl) | 2–6.9 | 3.5 (1.2–15.3) | 3.6 (1.3–12.6) | 4.3 (2.0–23.6) | 3.9 (1.2–23.6) | <0.001* a, b |
| Lymphocyte count (K/µl) | 1.3–3.8 | 1.6 (0.5–7.1) | 1.4 (0.4–4.3) | 1.1 (0.4–7.8) | 1.3 (0.4–7.8) | 0.01* b |
| Platelet count (K/µl) | 145–400 | 240 (101–686) | 215 (103‐ 497) | 257 (24–774) | 240 (24–774) | NS |
| Monocyte count (K/µl) | 0.2–0.95 | 0.7 (0.05–1.3) | 0.5 (0.07–0.6) | 0.4 (0.08–1.4) | 0.5 (0.05–1.4) | NS |
| CRP (mg/L) | <5 | 8 (2.0–190) | 9.7 (2.0–194) | 75 (2.2–234) | 37 (2.0 ‐234) | <0.001* a, b |
| Procalcitonin (ng/ml) | <0.08 | 0.01 (0–0.04) | 0.02 (0.01–0.04) | 0.06 (0.02–1.79) | 0.03 (0–1.79) | 0.006* b |
| ALT (U/L) | 9–57 | 18 (5–132) | 18 (5–124) | 30 (5–145) | 27 (5–145) | 0.008* b |
| AST (U/L) | 13–30 | 21 (11–90) | 25 (11–98) | 37 (9–184) | 29 (9–184) | <0.001* b |
| Lactic acid dehydrogenase (LDH) (U/L) | 125–243 | 229 (84–695) | 282 (121–707) | 372 (130–664) | 312 (84–707) | <0.001* a, b |
| Ferritin (µg/L) | 15–260 | 72 (4.2–770) | 117.5 (2.8–1268) | 346 (12.3–2000) | 204 (2.8–2000) | <0.001* a, b |
| D‐dimer (µg/ml) | <0.55 | 0.5 (0.1–4.3) | 0.3 (0.1–6.2) | 0.6 (0.3–16.3) | 0.5 (0.1–16.3) | <0.001* a, b |
| Troponin I (ng/L) | <34.2 | 1.16 (0.6–6.1) | 3.3 (1.3–25.4) | 19.75 (2.1–127.9) | 9.8 (0.6–127.9) | NS |
| Juvenile patients | ||||||
|---|---|---|---|---|---|---|
| Normal range | COVID‐19 | |||||
| Age, 0–12 years | Age, 13–18 years | Age, 0–12 years | Age, 13–18 years | Total | p value | |
| White blood cell count (K/µl) | 4.5–13.5 | 4.5–13 | 7.9 (3.5–16) | 5.1 (2.8–9.3) | 6.1 (2.8–16) | <0.001* c |
| Neutrophil count (K/µl) | 1.5–8 | 2–6.9 | 3.3 (1–11) | 2.6 (1.3–6.3) | 2.9 (1–11) | NS |
| Lymphocyte count (K/µl) | 1.5–7 | 1.3–3.8 | 3.5 (0.8–13.5) | 1.9 (0.7–3.4) | 2.3 (0.7–13.5) | <0.001* c |
| Platelet count (K/µl) | 200–450 | 145–400 | 281 (154–593) | 246 (156–440) | 259 (154–593) | 0.03* c |
| Monocyte count (K/µl) | 0.2–1.0 | 0.2–1.0 | 0.6 (0.3–7.2) | 0.4 (0.2.–0.7) | 0.5 (0.2–7.2) | 0.01* c |
| CRP (mg/L) | <5 | <5 | 3.1 (1–257) | 3.1 (3–25.9) | 3.1 (1–257) | NS |
| ALT (U/L) | 5–30 | 5–30 | 16 (6–41) | 12 (8–156) | 14 (6–156) | NS |
| AST (U/L) | 8–60 | 8–48 | 30 (15‐70) | 21 (7–52) | 23 (7–70) | <0.001* c |
| LDH (U/L) | 143–345 | 105–283 | 288 (180–548) | 204 (163‐285) | 239 (163‐548) | 0.008* c |
| Ferritin (µg/L) | 7–140 | 7–260 | 44.1 (9–267) | 26 (0–63) | 36 (0–267) | NS |
| D‐dimer (µg/ml) | 0.09–0.5 | <0.55 | 0.22 (0.06–1.6) | 0.33 (0.01–1) | 0.3 (0.01–1.6) | NS |
Note: Statistically significant (*) results are shown in bold.
Abbreviations: ALT, alanine aminotransferase; AST, aspartate aminotransferase; CRP, C‐reactive protein.
Severe pneumonia versus mild pneumonia.
Noncomplicated versus severe pneumonia.
COV 0–12 versus COV 13–18.
Figure 2.
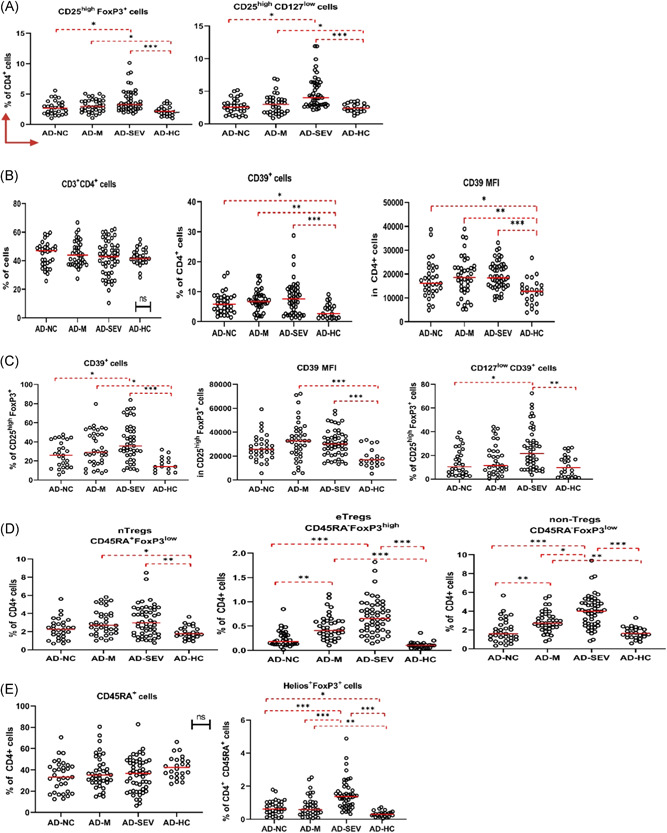
Graphical representation of statistical significance (p) and cell percentages (median and IQR) of Treg subsets of adult patient groups according to flow cytometry analysis data. In all analyses, p < 0.05 was considered to indicate statistical significance (*p < 0.05, **p < 0.01, ***p < 0.001). (A) CD25highFoxP3+ and CD25highCD127low Tregs were increased in COVID‐19 cases. (B) CD4+CD39+ cells were also significantly increased. (C) CD39+ cells in the CD25highFoxP3+ gate increased with disease severity. (D) As a result of classification based on CD45RA and FoxP3, nTregs, eTregs, and non‐Tregs increased with disease severity. (E) Helios+FoxP3+ cells increased with the severity of the disease. AD‐HC, adult healthy control; AD‐M, mild pneumonia adult cases; AD‐NC, noncomplicated adult cases; AD‐SEV, severe pneumonia adult cases; IQR, interquartile range
The diagnoses of all patients included in the study were made by physicians specializing in infectious diseases based on the evaluation of laboratory and radiographic findings and the reverse‐transcriptase polymerase chain reaction (RT‐PCR) (Bio‐Speedy Direct RT‐qPCR SARS‐CoV‐2 nucleic acid detection kit; Bioeksen). Adult patient groups were classified according to pneumonia status. These groups were composed of cases of noncomplicated, mild, and severe pneumonia. In noncomplicated cases, patients with some nonspecific symptoms but without respiratory complications were selected. Cases with mild pneumonia consisted of patients who had nonsevere pneumonia caused by SARS‐CoV‐2 and did not require oxygen support. Cases of severe pneumonia were included in the study as recommended by the WHO (rate > 30 breaths/min; severe respiratory distress; or SpO2 ≤ 93% on room air). On the contrary, age‐related groups were formed among the juvenile patients included in the study (0–12 and 13–18 years).
2.2. Flow cytometry analysis
Peripheral blood samples of the patients were freshly collected and evaluated by flow cytometry method. Two flow cytometry tubes were used for isotypic control and Treg cell analysis. First, peripheral blood samples were transferred with EDTA (100 µl) into two test tubes. At this stage, CD3 was used as T‐cell marker, CD4 as T helper cell marker, CD8 as cytotoxic T‐cell marker, and CD45RA, FoxP3, CD25, CD127, CD39, and Helios as markers for naïve and effector Treg subsets (FoxP3 and Helios were stained intracellularly). The aforementioned monoclonal antibodies were pipetted into the Treg cell tube according to the intended panel and incubated for 15 min at room temperature protected from light after vortexing. The tubes were fixed with Reagent 1 (IntraPrep™ Immunotech/Coulter) containing 5.5% formaldehyde and incubated for 10 min at room temperature protected from light. After incubation, 2 ml of Isoflow (IsoFlow Sheath Fluid; Coulter) was added, and both tubes were centrifuged at 300g for 5 min and permeabilized with 100 µl of phosphate‐buffered saline‐buffered saponin‐based lysis reagent (Reagent 2; IntraPrep™ Immunotech/Coulter) for 5 min. For intracytoplasmic staining, FoxP3 and Helios monoclonal antibodies were added and incubated for 15 min at room temperature protected from light after vortexing. Two milliliters of Isoflow were added and both tubes were centrifuged at 300g for 5 min. After the supernatant was removed, 350 µl of Isoflow was added to the remaining cells and analyzed in a flow cytometer (Novious EX; Beckman Coulter). The following fluorescent stains were selected for the panel of conjugated monoclonal antibodies: CD45RA FITC/CD25 PE/CD4 ECD/CD39 PC5.5/FoxP3 PC7/CD127 APC/CD8 A700/CD3 A750/Helios PB/CD45 KrO (Beckman Coulter). The gating strategy for flow cytometry analysis of Treg subsets is shown in Figure 1. All flow cytometric data were analyzed using Kaluza Analysis Flow Cytometry software (v.2.1; Beckman Coulter).
Figure 1.

Flow cytometry gating strategy for analysis of Treg subsets. (A) Lymphocytes were separated based on CD45 and SSC characteristics. (B) CD39+, CD25highFoxP3+, CD25highCD127low, 45RA+, and FoxP3+ cells were separated at the CD3+ CD4+ lymphocyte gate. Naive Tregs (nTreg), effector Tregs (eTreg), and non‐Tregs were separated using CD45RA and FoxP3 gated on CD3+CD4+ cells. (C) CD39+ and CD127lowCD39+ cells were separated at the CD25highFoxP3+ gate. (D) Helios and FoxP3 were used to separate thymic Tregs
2.3. Statistical analysis
The normality of the obtained data was determined by Kolmogorov–Smirnov/Shapiro–Wilk tests and histogram analysis. Data in this study were expressed as medians and interquartile ranges and were analyzed using IBM SPSS Statistics version 21.0 (IBM Corp.). In the adults, multigroup statistics were performed using the Kruskal–Wallis test and the post hoc Dunn test. In the juvenile patients, the Mann–Whitney U test and Bonferroni correction were used for comparisons between groups (0–12 vs. 13–18). Patients followed up after recovery were evaluated using the Wilcoxon signed‐rank test. Values of categorical variables were compared using the χ 2 test or the Fisher exact test. Correlation analysis was performed using Spearman's correlation test. In all analyses, p < 0.05 was considered statistically significant.
3. RESULTS
3.1. Tregs and expression of CD39 increase with disease severity in adults
Adult patients were evaluated in three groups according to their COVID‐19 pulmonary complication status (noncomplicated, mild, and severe pneumonia). The gating strategy used in the flow cytometry method is shown in Figure 1.
Tregs were identified in this study as CD25highFoxP3+ and CD25highCD127low/− cells. In adult cases of COVID‐19, these cell levels were statistically significantly elevated, especially in cases with severe pneumonia. CD25highFoxP3+ cells were significantly higher in severe and mild pneumonia than in noncomplicated cases and healthy controls. CD25highCD127low/− cells also followed a similar profile and were significantly increased in severe and mild pneumonia (Figure 2A).
In addition, interesting results were found in the studies on CD39 expression. It was found that CD39 expression in CD3+CD4+ cells was significantly higher in patients with COVID‐19 than in the healthy control group (Figure 2B). CD39 expression in CD25+FoxP3+ cells also followed a similar profile and was significantly higher in the patient groups than in the healthy group. Moreover, a CD39 expression signature was detected in these cell groups that increased with disease severity. In CD25highFoxP3+CD127low/− cells, CD39 expression was significantly higher in severe pneumonia than in the noncomplicated and healthy control groups (Figure 2C).
Furthermore, nTregs, eTregs, and non‐Tregs were assessed by the expression of CD45RA and FoxP3. It was found that nTregs were significantly higher in patients with severe and mild pneumonia compared with healthy controls. On the contrary, eTregs were significantly increased in patients with severe and mild pneumonia, but there was no difference between the noncomplicated and healthy control groups. Moreover, non‐Tregs differed significantly from each other in each disease group in direct proportion to the severity of the disease. In severe pneumonia cases, eTregs were statistically significantly higher than even in mild pneumonia cases. For mild pneumonia cases, eTregs were also significantly higher than for noncomplicated cases. In severe and mild pneumonia cases, these cells were also significantly elevated compared to healthy controls (Figure 2D). Changes in Helios+FoxP3+ cells were also observed in a similar profile to non‐Tregs (Figure 2E). In direct proportion to the severity of disease, from the healthy control group to the cases with severe pneumonia, each group was found to be significantly higher than the disease severity group below. There was no statistically significant difference in Treg subsets in patients followed up after recovery compared to initial flow cytometry data (Figure S3).
Moreover, interesting results were obtained in correlation analysis of Treg profile and hematological parameters in adults. In severe pneumonia cases, lactate dehydrogenase (LDH) and ferritin levels were negatively correlated with CD3+CD4+ cells. Interestingly, LDH and ferritin levels were significantly positively correlated with Tregs. Conversely, platelet count was positively correlated with CD3+CD4+ cells while negatively correlated with Treg cells. In addition, the group of Helios+FoxP3+ cells was positively correlated with CRP (Figure S5A). In mild pneumonia cases, a negative correlation was found between non‐Tregs and lymphocytes (Figure S5B) Similarly, Tregs (CD25highFoxP3+ cells) and lymphocytes were negatively correlated in noncomplicated cases (Figure S5C).
3.2. Low CD39 expression and low Tregs in juvenile COVID‐19 cases
Serious illness and associated deaths are extremely rare in pediatric COVID‐19 patients. In almost all pediatric patients included in our study, the disease was asymptomatic or with mild symptoms. In this regard, we found an age‐based distinction more useful in pediatric COVID‐19 cases. We examined Treg and CD39 expression in juvenile patients in two different age groups (0–12 vs. 13–18).
In examining our juvenile patients, we used the same flow cytometric panels as in the adult patients and applied the same gating strategy. The first striking point we observed in the juvenile patients was that CD25highFoxP3+ cells did not change in all age groups, whereas there was a tendency for CD25highCD127low/− cells to decrease, especially in the 0–12 age group (Figure 3A).
Figure 3.

Graphical representation of statistical significance (p) and cell percentages (median and IQR) of Treg subsets of juvenile patient groups according to flow cytometry analysis data. In all analyses, p < 0.05 was considered to indicate statistical significance (*p < 0.05, **p < 0.01, ***p < 0.001). (A) CD25highFoxP3+ and CD25highCD127low Tregs were not significantly altered in juvenile COVID‐19 cases. (B) CD4+CD39+ cells were significantly higher in the 13–18 age group than in the 0–12 age group. (C) CD39+ cells in the CD25highFoxP3+ gate showed age‐related changes. Moreover, the percentage in the age group 0–12 years was significantly lower than that in the healthy control group. (D) As a result of classification based on CD45RA and FoxP3, significant age‐related changes were observed in nTregs. Moreover, nTregs were significantly lower in the patient groups than in the age‐matched healthy controls. (E) Although no significant changes were observed in Helios+FoxP3+ cells, a decreasing trend was observed in juvenile patients. Moreover, CD45RA cells were significantly decreased in the patients of age group 13–18 years as compared to the patients of age group 0–12 years. J‐COV 0–12, Juveniles 0–12 age; J‐COV 13–18, Juveniles 13–18 age, J‐HC 0–12, healthy juveniles 0–12 age; J‐HC 13–18, healthy juveniles 13–18 age, J‐COV Total, total juvenile patients; J‐HC Total, total healthy controls
This result in Tregs aroused curiosity about how CD39 expression evolves. We observed that patients aged 0–12 years had lower CD39 expression in CD4+ cells than patients aged 13–18 years (Figure 3B). However, no statistical significance was found between juvenile patients and healthy controls. A similar profile was observed for CD39 expression in CD25highFoxP3+ cells. Interestingly, COVID‐19 cases in the 0–12 age group tended to decrease, while cases in the 13–18 age group tended to increase compared with the age‐matched healthy controls. The CD39 expression profile of CD25highCD127low/− cells also showed the same signature (Figure 3C). According to these results, it can be assumed that patients aged 0–12 years with COVID‐19 express less CD39 in Tregs. When comparing all juvenile COVID‐19 and healthy groups participating in the study, CD39+ Tregs tended to decrease overall.
Interesting results also emerged from the analysis of nTregs, eTregs, and non‐Tregs by examining the expression of CD45RA and FoxP3 together. nTregs were significantly lower in both the 0–12 years age group and the 13–18 years age group than in the healthy control groups in the corresponding age range (Figure 3D). Although no statistically significant results were obtained for eTregs and non‐Tregs, a decreasing trend was observed for these cells in the 0–12 years age group. In addition, when Helios and FoxP3 expressions were examined, a slight decrease was observed in the patient groups for Helios+ Tregs (Figure 3E).
After recovery, no major change was observed in juvenile patients who were followed up. However, in patients aged 13–18 years, non‐Treg levels were found to be significantly lower after recovery (Figure S4).
4. DISCUSSION
The course of COVID‐19 infections varies from asymptomatic to acute respiratory failure syndrome and multiorgan dysfunction. 26 Tregs have been shown to have an important impact on the immune response in many acute and chronic viral infections, but their role in COVID‐19 immunopathogenesis remains to be elucidated. 27 Here, we present the CD39‐expressing Treg profile in juvenile and adult COVID‐19 patients. Understanding the Treg activation mechanisms induced by SARS‐CoV‐2 is required to prevent or enhance the immunosuppressive effect of disease and increase its immunoprotective effect on the host.
Since the onset of the disease, there have been many studies on the question of whether Tregs are friends or foes in COVID‐19, but there is still no consensus on this question. Some studies have reported that Treg levels decrease in SARS‐CoV‐2 infection, while they increase in others. In our study, Tregs increased significantly with disease severity in adult patients. Consistent with our study, de Biasi et al. 28 reported an increased proportion of CD25highCD127low cells in COVID‐19 patients. In another study, Tan et al. 29 reported that these cell subsets increased in both mild and severe cases, with a relatively smaller increase in severe cases compared with mild cases. Peña et al. 30 also reported a significant increase in CD25highFoxP3+ cells in the severe group compared with the other groups. Recently, Neumann et al. 31 reported a five‐fold increase in interleukin (IL)‐10‐producing Tregs in severe cases compared with healthy individuals. 31 However, there were several studies that contradicted our study. Qin et al. 32 reported a slight decrease in CD25highCD127low Tregs in COVID‐19 infections, while Liu et al. 33 reported a significant decrease in thymic Treg (CD45RA+CD3+CD4+CD25+CD127low) and induced Treg (CD45RO+CD3+CD4+CD25+CD127low) cell levels (%) in severe and mild cases. These two‐sided results raise curiosity about the role of Tregs in the immunopathology of COVID‐19.
Infection and/or cellular damage results in a high release of ATP from cells. Extracellular ATP has a proinflammatory effect on the immune system. In recent years, some studies have reported high levels of extracellular ATP in various inflammatory diseases, including ALI and acute respiratory distress syndrome (ARDS). In the immune system, extracellular ATP acts as a messenger that triggers pro‐inflammatory effects. Although there is no evidence yet of the possible effects of extracellular ATP on SARS‐COV‐2 infection, recent data suggest that it may have an underlying effect on COVID‐19. Thus, CD39 and CD73, which are responsible for the conversion of extracellular ATP to ADO, may play a key role in the progression of COVID‐19. Stimulation of A2A receptors (major adenosine receptors) to which ADOs bind leads to suppression of proinflammatory IL‐6 production and increase in TGF‐β production. The presence of TGF‐β promotes FoxP3 expression and Treg cell polarization. 34 , 35 Therefore, in this study, we aimed to investigate the variation of CD39 expression in Tregs in COVID‐19. To our knowledge, there is only one study in the literature on the expression of CD39 in COVID‐19. Ahmadi et al. 36 examined the expression of CD39 and CD73 in CD8+ and CD4+ cell subsets in 14 COVID‐19 patients. Although they found a significant increase in CD73 expression in CD8+ cell subsets, they found no correlation between CD39 expression and these cell subsets.
In this study, we observed a significant increase in CD39‐expressing Tregs in cases of mild and severe pneumonia in COVID‐19, which may be a sign of the development of a strong immunosuppressive response that seems to be particularly beneficial in a disease whose severe cases are characterized by aggressive inflammation and cytokine storms. In contrast to this profile we observed in Tregs, why does aggressive inflammation in COVID‐19 not tend to decrease with disease severity? First, circulating Tregs can be expected to proliferate more in severe cases and have a stronger immunosuppressive effect, but there may be abnormalities in their migration to tissues and organs (especially the lungs). Some molecules with immunomodulatory properties, such as sphingosine‐1‐phosphate (S1P), can mediate migration of Tregs to the lungs. 37 Besides, the S1P molecule was found to be inversely correlated with disease severity in COVID‐19, which may indicate a discrepancy in the efficient migration of Treg cells. 38 In addition, some membrane receptors enable Tregs to undergo chemotaxis. Some chemokine receptors, such as CCR4, CCR5, CCR7, and CCR8, are effective for migration to the lung. 39 It is possible that there is a dysfunction in these membrane receptors that may affect migration to the lung. However, He et al. 40 and Ronit et al. 41 reported that Tregs are increased in the lung microenvironment (the bronchoalveolar lavage fluid) in COVID‐19 patients. Clearly, further studies are needed on the migration of Tregs in COVID‐19. Second, we and others have focused on the immunophenotypic characteristics of Tregs in COVID‐19. As far as we know, there are no studies on the immunosuppressive abilities of these cells in SARS‐CoV‐2 infections. Some cells of the CD4+FoxP3+ phenotype can differentiate into a Th17‐like Treg cell subset that can produce IL‐17A. In the presence of IL‐6, IL‐1β, and IL‐23, these cells can contribute to inflammation by producing the proinflammatory cytokine IL‐17A. 42 , 43 In addition, it has been reported that Tregs may have proinflammatory properties, dysfunctional immunosuppressive abilities, and possibly antiangiogenic properties in some diseases. 44 Third, Tregs could perform their role much better in COVID‐19. In particular, the increase in CD39 expression in these cells observed in this study may be evidence of this. Tregs may suppress valuable immune responses to resolve the infection and modulate immunity to the benefit of SARS‐CoV‐2. Peña et al. 30 reported a significant increase in CD25highFoxP3+ cells in the severe group compared with the other groups. On the basis of their cytometric and transcriptomic profiling studies, they showed that the Treg cell profile and transcriptomic pattern of tumor‐infiltrating Tregs were similar in severe COVID‐19 cases. They also observed that the proinflammatory IL‐32 release of Tregs increased with IL‐10. In view of these findings, Tregs might play a proinflammatory supportive role under the influence of hidden factors in addition to their strong immunosuppressive role in COVID‐19.
On the contrary, CD39‐expressing Tregs decreased in the juvenile patients in an age‐dependent manner (0–12 vs. 13–18). Pediatric‐specific risk factors for COVID‐19 have not been adequately explored. A physiologic increase in immunoregulatory cells and a well‐regulated immune system appear to be beneficial in SARS‐CoV‐2 infections in children and infants. 45 However, our current understanding of the immunopathogenesis of COVID‐19 is still insufficient to clarify how children are protected from the symptoms of SARS‐CoV‐2 infection.
We also analyzed nTregs, eTregs, and non‐Tregs based on CD45RA and FoxP3 expression. In adults, we observed an increase in these cell groups in direct proportion to the severity of the disease. Interestingly, the percentage of non‐Treg cells was increased 2.5‐fold in the severe pneumonia group compared with the healthy group. A downward trend in this cell group was observed in patients who followed up after recovery (Figure S3). However, in juvenile patients, nTregs were significantly reduced at the time of illness. After recovery, a slight decrease in nTregs continued and a significant decrease in non‐Tregs was observed (Figure S4). Although the results in the eTreg and nTreg profiles in adults were fairly consistent throughout the study, the significant results in non‐Tregs are of particular interest. Notably, non‐Tregs have no immunosuppressive properties and produce proinflammatory cytokines, such as IL‐2, IFN‐γ, and IL‐17. 17 These results may support the theory of “proinflammatory Tregs” in COVID‐19.
Helios+ Treg cells are known as thymus‐derived Treg cells. Co‐expression of Helios and FoxP3 enhances the immunosuppressive effect of Tregs. 46 CD45RA+Helios+FoxP3+ Tregs have been observed to increase in HIV‐1 infection and have been reported to cause the release of PD‐1 from monocytes. 47 In a study conducted in murines, an increase in Helios+FoxP3+ Tregs proliferating rapidly in the lungs and a correlation with TGF‐β was found in pneumococcal pneumonia. 48 Moreover, in this study, Helios+FoxP3+ (gated on CD3+CD4+CD45RA+) cells were found to be significantly higher in adult COVID‐19 cases than in healthy controls. This raises the possibility that Helios+FoxP3+ Tregs expand rapidly in the peripheral circulation and lungs in COVID‐19 and can be an early marker of disease progression.
As a result of correlation analysis of laboratory parameters and Treg cell subsets, three important parameters emerged in severe pneumonia cases. It has been reported that LDH and ferritin levels increase with the severity of the disease in COVID‐19 cases. 49 , 50 In our study, Tregs were found to increase with disease severity and positively correlated with these parameters. Decreased platelet count at COVID‐19 was associated with disease severity. 51 Consequently, a negative correlation between Tregs and platelet count was found in this study. In mild pneumonia and noncomplicated cases, there is a negative correlation between lymphocytes and Treg subsets (non‐Tregs and CD25highFoxP3+ cells, respectively) (Figure S5). This may indicate an increase in Treg cell subsets despite lymphocytopenia.
Finally, we are well aware of some limitations of our study. First, the major limitation of this study is the small sample size of healthy controls. Second, the possible role of memory Tregs in COVID‐19 was also a matter of interest to us. Patient samples were collected not only during the acute phase of COVID‐19 but also during the convalescence phase. However, memory Tregs could not be distinguished from the eTregs. Third, the recruitment of CD73, in addition to CD39 in our panel, could provide valuable clues about the effect of extracellular ATP in SARS‐CoV‐2 infection. Our result could be strengthened by additional markers, such as Nrp1, CCR6, and CTLA‐4. In addition, it should be mentioned that a larger number of patients followed up would have made a valuable contribution to this study.
Taken together, in our study, significant increases were discerned in Tregs and expression of CD39 in adult COVID‐19 patients. In juvenile patients, it was noticed that CD39 expression of Tregs tended to change in an age‐dependent manner. We speculate that changes in the Treg profile of juveniles and adults at COVID‐19 may play a role in immunopathogenesis and control of the disease. A better understanding of the Treg activation mechanisms induced by SARS‐CoV‐2 will open new perspectives for the treatment of the disease to prevent or enhance the immunosuppressive effects. Further studies are needed to determine the immunoprotective properties of Tregs in adult and juvenile COVID‐19 patients and their impact on the prognosis of the disease.
CONFLICT OF INTERESTS
The authors declare that there are no conflict of interests.
ETHICS APPROVAL AND CONSENT TO PARTICIPATE
This study protocol was approved by the Ethics Committee of Bursa Uludag University, Faculty of Medicine (Permit number: 2020‐7/9) Bursa, Turkey, and all subjects provided written informed consent.
AUTHOR CONTRIBUTIONS
Research area and study design: Abdurrahman Simsek, Muhammed Ali Kizmaz, and Ferah Budak. Sample and data acquisiton: Abdurrahman Simsek, Eren Cagan, Ali Asan, Halil İbrahim Demir, S. Haldun Bal, Digdem Yoyen‐Ermis, Asli Gorek Dilektasli, Esra Kazak, E. Halis Akalin, H. Barbaros Oral, and Ferah Budak. Conducting the research: Abdurrahman Simsek, Muhammed Ali Kizmaz, and Fatma Dombaz. Data analysis: Abdurrahman Simsek, Eren Cagan, Gülcin Tezcan, and Ferah Budak. Writing and editing: Abdurrahman Simsek and Ferah Budak. All listed authors reviewed and revised the manuscript.
Supporting information
Supporting information.
ACKNOWLEDGMENTS
We would like to thank Deniz Gulkaya and Tugce Bozkurt for their technical support. This project was supported by a grant from the Foundation for Scientific Research Projects (BAP) of the Bursa Uludag University of Turkey (Project No. OUAP [T]—2020/6).
Simsek A, Kizmaz MA, Cagan E, et al. Assessment of CD39 expression in regulatory T‐cell subsets by disease severity in adult and juvenile COVID‐19 cases. J Med Virol. 2022;94:2089‐2101. 10.1002/jmv.27593
DATA AVAILABILITY STATEMENT
The data that support the findings of this study are available from the corresponding author upon reasonable request.
REFERENCES
- 1. Lu H, Stratton CW, Tang YW. Outbreak of pneumonia of unknown etiology in Wuhan, China: the mystery and the miracle. J Med Virol. 2020;92(4):401‐402. 10.1002/jmv.25678 [DOI] [PMC free article] [PubMed] [Google Scholar]
- 2. World Health Organization (WHO) Coronavirus disease (COVID‐19) outbreak situation reports. Weekly epidemiological update on COVID‐19 ‐23 November 2021, Edition 67. Accesed November 25, 2021. https://www.who.int/emergencies/diseases/novel-coronavirus-2019
- 3. Setoguchi R, Hori S, Takahashi T, Sakaguchi S. Homeostatic maintenance of natural Foxp3(+) CD25(+) CD4(+) regulatory T cells by interleukin (IL)‐2 and induction of autoimmune disease by IL‐2 neutralization. J Exp Med. 2005;201(5):723‐735. 10.1084/jem.20041982 [DOI] [PMC free article] [PubMed] [Google Scholar]
- 4. Sanchez AM, Zhu J, Huang X, Yang Y. The development and function of memory regulatory T cells after acute viral infections. J Immunol. 2012;189(6):2805‐2814. 10.4049/jimmunol.1200645 [DOI] [PMC free article] [PubMed] [Google Scholar]
- 5. Liu Y, Qi G, Bellanti JA, Moser R, Ryffel B, Zheng SG. Regulatory T cells: a potential weapon to combat COVID‐19? MedComm (Beijing). 2020;1(2):157‐164. 10.1002/mco2.12 [DOI] [PMC free article] [PubMed] [Google Scholar]
- 6. Veiga‐Parga T, Sehrawat S, Rouse BT. Role of regulatory T cells during virus infection. Immunol Rev. 2013;255(1):182‐196. 10.1111/imr.12085 [DOI] [PMC free article] [PubMed] [Google Scholar]
- 7. Su H, Longhi MS, Wang P, Vergani D, Ma Y. Human CD4+CD25(high)CD127 (low/neg) regulatory T cells. Methods Mol Biol. 2012;806:287‐299. 10.1007/978-1-61779-367-7_20 [DOI] [PubMed] [Google Scholar]
- 8. Yu N, Li X, Song W, et al. CD4(+)CD25 (+)CD127 (low/−) T cells: a more specific Treg population in human peripheral blood. Inflammation. 2012;35:1773‐1780. [DOI] [PubMed] [Google Scholar]
- 9. Hori S, Nomura T, Sakaguchi S. Control of regulatory T cell development by the transcription factor Foxp3. Science. 2003;299(5609):1057‐1061. 10.1126/science.1079490 [DOI] [PubMed] [Google Scholar]
- 10. Zhang X, Olsen N, Zheng SG. The progress and prospect of regulatory T cells in autoimmune diseases. J Autoimmun. 2020;111:102461. 10.1016/j.jaut.2020.102461 [DOI] [PubMed] [Google Scholar]
- 11. Battaglia M, Roncarolo MG. The fate of human Treg cells. Immunity. 2009;30(6):763‐765. 10.1016/j.immuni.2009.06.006 [DOI] [PubMed] [Google Scholar]
- 12. Thornton AM, Korty PE, Tran DQ, et al. Expression of Helios, an Ikaros transcription factor family member, differentiates thymic‐derived from peripherally induced Foxp3+ T regulatory cells. J Immunol. 2010;184(7):3433‐3441. 10.4049/jimmunol.0904028 [DOI] [PMC free article] [PubMed] [Google Scholar]
- 13. Zabransky DJ, Nirschl CJ, Durham NM, et al. Phenotypic and functional properties of Helios+ regulatory T cells. PLOS One. 2012;7(3):e34547. 10.1371/journal.pone.0034547 [DOI] [PMC free article] [PubMed] [Google Scholar]
- 14. Mohr A, Malhotra R, Mayer G, Gorochov G, Miyara M. Human FOXP3+ T regulatory cell heterogeneity. Clin Transl Immunology. 2018;7(1):e1005. 10.1002/cti2.1005 [DOI] [PMC free article] [PubMed] [Google Scholar]
- 15. Miyara M, Sakaguchi S. Natural regulatory T cells: mechanisms of suppression. Trends Mol Med. 2007;13(3):108‐116. 10.1016/j.molmed.2007.01.003 [DOI] [PubMed] [Google Scholar]
- 16. Miyara M, Yoshioka Y, Kitoh A, et al. Functional delineation and differentiation dynamics of human CD4+ T cells expressing the FoxP3 transcription factor. Immunity. 2009;30(6):899‐911. 10.1016/j.immuni.2009.03.019 [DOI] [PubMed] [Google Scholar]
- 17. Li Z, Li D, Tsun A, Li B. FOXP3+ regulatory T cells and their functional regulation. Cell Mol Immunol. 2015;12(5):558‐565. 10.1038/cmi.2015.10 [DOI] [PMC free article] [PubMed] [Google Scholar]
- 18. Ohta A, Sitkovsky M. Extracellular adenosine‐mediated modulation of regulatory T cells. Front Immunol. 2014;5:304. 10.3389/fimmu.2014.00304 [DOI] [PMC free article] [PubMed] [Google Scholar]
- 19. Gu J, Ni X, Pan X, et al. Human CD39hi regulatory T cells present stronger stability and function under inflammatory conditions. Cell Mol Immunol. 2017;14(6):521‐528. 10.1038/cmi.2016.30 [DOI] [PMC free article] [PubMed] [Google Scholar]
- 20. Bastid J, Cottalorda‐Regairaz A, Alberici G, Bonnefoy N, Eliaou JF, Bensussan A. ENTPD1/CD39 is a promising therapeutic target in oncology. Oncogene. 2013;32(14):1743‐1751. 10.1038/onc.2012.269 [DOI] [PubMed] [Google Scholar]
- 21. Rahimzadeh M, Naderi N. Toward an understanding of regulatory T cells in COVID‐19: a systematic review. J Med Virol. 2021;93(7):4167‐4181. 10.1002/jmv.26891 [DOI] [PubMed] [Google Scholar]
- 22. Kalfaoglu B, Almeida‐Santos J, Tye CA, Satou Y, Ono M. T‐cell hyperactivation and paralysis in severe COVID‐19 infection revealed by single‐cell analysis. Front Immunol. 2020;11:589380. 10.3389/fimmu.2020.589380 [DOI] [PMC free article] [PubMed] [Google Scholar]
- 23. Xie M, Yunis J, Yao Y, et al. High levels of soluble CD25 in COVID‐19 severity suggest a divergence between anti‐viral and pro‐inflammatory T‐cell responses. Clin Transl Immunology. 2021;10(2):e1251. 10.1002/cti2.1251 [DOI] [PMC free article] [PubMed] [Google Scholar]
- 24. Abdelhafiz AS, Fouad MA, Sayed‐Ahmed MM, et al. Upregulation of FOXP3 is associated with severity of hypoxia and poor outcomes in COVID‐19 patients. Virology. 2021;563:74‐81. 10.1016/j.virol.2021.08.012 [DOI] [PMC free article] [PubMed] [Google Scholar]
- 25. Wang Y, Zheng J, Islam MS, Yang Y, Hu Y, Chen X. The role of CD4+FoxP3+ regulatory T cells in the immunopathogenesis of COVID‐19: implications for treatment. Int J Biol Sci. 2021;17(6):1507‐1520. 10.7150/ijbs.59534 [DOI] [PMC free article] [PubMed] [Google Scholar]
- 26. Greenland JR, Michelow MD, Wang L, London MJ. COVID‐19 infection: implications for perioperative and critical care physicians [published correction appears in Anesthesiology. 2020 Sep;133(3):693]. Anesthesiology. 2020;132(6):1346‐1361. 10.1097/ALN.0000000000003303 [DOI] [PMC free article] [PubMed] [Google Scholar]
- 27. Keynan Y, Card CM, McLaren PJ, Dawood MR, Kasper K, Fowke KR. The role of regulatory T cells in chronic and acute viral infections. Clin Infect Dis. 2008;46(7):1046‐1052. 10.1086/529379 [DOI] [PubMed] [Google Scholar]
- 28. De Biasi S, Meschiari M, Gibellini L, et al. Marked T cell activation, senescence, exhaustion and skewing towards TH17 in patients with COVID‐19 pneumonia. Nat Commun. 2020;11(1):3434. 10.1038/s41467-020-17292-4 [DOI] [PMC free article] [PubMed] [Google Scholar]
- 29. Tan M, Liu Y, Zhou R, et al. Immunopathological characteristics of coronavirus disease 2019 cases in Guangzhou, China. Immunology. 2020;160(3):261‐268. 10.1111/imm.13223 [DOI] [PMC free article] [PubMed] [Google Scholar]
- 30. Galvan‐Pena S, Leon J, Chowdhary K, et al. Profound Treg perturbations correlate with COVID‐19 severity. bioRxiv. Published online December 11, 2020. 10.1101/2020.12.11.416180 [DOI] [PMC free article] [PubMed] [Google Scholar]
- 31. Neumann J, Prezzemolo T, Vanderbeke L, et al. Increased IL‐10‐producing regulatory T cells are characteristic of severe cases of COVID‐19. Clin Transl Immunology. 2020;9(11):e1204. 13 10.1002/cti2.1204 [DOI] [PMC free article] [PubMed] [Google Scholar]
- 32. Qin C, Zhou L, Hu Z, et al. Dysregulation of immune response in patients with coronavirus 2019 (COVID‐19) in Wuhan, China. Clin Infect Dis. 2020;71(15):762‐768. 10.1093/cid/ciaa248 [DOI] [PMC free article] [PubMed] [Google Scholar]
- 33. Liu L, Xu L, Lin C. T cell response in patients with COVID‐19. Blood Science. 2020;2.3:76‐78. [DOI] [PMC free article] [PubMed] [Google Scholar]
- 34. Sriram K, Insel PA. Inflammation and thrombosis in COVID‐19 pathophysiology: proteinase‐activated and purinergic receptors as drivers and candidate therapeutic targets. Physiol Rev. 2021;101(2):545‐567. 10.1152/physrev.00035.2020 [DOI] [PMC free article] [PubMed] [Google Scholar]
- 35. Allard D, Allard B, Stagg J. On the mechanism of anti‐CD39 immune checkpoint therapy [published correction appears in J Immunother Cancer. 2020 Jul;8(2)]. J Immunother Cancer. 2020;8(1):e000186. 10.1136/jitc-2019-000186 [DOI] [PMC free article] [PubMed] [Google Scholar]
- 36. Ahmadi P, Hartjen P, Kohsar M, et al. Defining the CD39/CD73 axis in SARS‐CoV‐2 infection: the CD73‐ phenotype identifies polyfunctional cytotoxic lymphocytes. Cells. 2020;9(8):1750. 10.3390/cells9081750 [DOI] [PMC free article] [PubMed] [Google Scholar]
- 37. Ishimaru N, Yamada A, Nitta T, et al. CCR7 with S1P1 signaling through AP‐1 for migration of Foxp3+ regulatory T‐cells controls autoimmune exocrinopathy. Am J Pathol. 2012;180(1):199‐208. 10.1016/j.ajpath.2011.09.027 [DOI] [PubMed] [Google Scholar]
- 38. Marfia G, Navone S, Guarnaccia L, et al. Decreased serum level of sphingosine‐1‐phosphate: a novel predictor of clinical severity in COVID‐19. EMBO Mol Med. 2021;13(1):e13424. 10.15252/emmm.20201342 [DOI] [PMC free article] [PubMed] [Google Scholar]
- 39. Bromley SK, Mempel TR, Luster AD. Orchestrating the orchestrators: chemokines in control of T cell traffic. Nat Immunol. 2008;9(9):970‐980. 10.1038/ni.f.213 [DOI] [PubMed] [Google Scholar]
- 40. He Y, Zhai B, Zhou S, et al. Chemokine‐expressing Th1 and Treg cells are increased in the lung of patients with COVID‐19. Available at SSRN 3629437. 2020.
- 41. Ronit A, Berg R, Bay JT, et al. Compartmental immunophenotyping in COVID‐19 ARDS: a case series. J Allergy Clin Immunol. 2021;147:81‐91. [DOI] [PMC free article] [PubMed] [Google Scholar]
- 42. Jung MK, Kwak JE, Shin EC. IL‐17A‐producing Foxp3+ regulatory T cells and human diseases. Immune Netw. 2017;17(5):276‐286. 10.4110/in.2017.17.5.276 [DOI] [PMC free article] [PubMed] [Google Scholar]
- 43. Beriou G, Costantino CM, Ashley CW, et al. IL‐17‐producing human peripheral regulatory T cells retain suppressive function. Blood. 2009;113(18):4240‐4249. 10.1182/blood-2008-10-183251 [DOI] [PMC free article] [PubMed] [Google Scholar]
- 44. Bansal SS, Ismahil MA, Goel M, et al. Dysfunctional and proinflammatory regulatory T‐lymphocytes are essential for adverse cardiac remodeling in ischemic cardiomyopathy. Circulation. 2019;139(2):206‐221. 10.1161/CIRCULATIONAHA.118.036065 [DOI] [PMC free article] [PubMed] [Google Scholar]
- 45. Elahi S. Neonatal and children's immune system and COVID‐19: biased immune tolerance versus resistance strategy. J Immunol. 2020;205(8):1990‐1997. 10.4049/jimmunol.2000710 [DOI] [PubMed] [Google Scholar]
- 46. Gottschalk RA, Corse E, Allison JP. Expression of Helios in peripherally induced Foxp3+ regulatory T cells. J Immunol. 2012;188(3):976‐980. 10.4049/jimmunol.1102964 [DOI] [PubMed] [Google Scholar]
- 47. Liu L, Zhang Q, Chen P, et al. Foxp3+Helios+ regulatory T cells are associated with monocyte subsets and their PD‐1 expression during acute HIV‐1 infection. BMC Immunol. 2019;20(1):38. 10.1186/s12865-019-0319-7 [DOI] [PMC free article] [PubMed] [Google Scholar]
- 48. Neill DR, Fernandes VE, Wisby L, et al. T regulatory cells control susceptibility to invasive pneumococcal pneumonia in mice. PLOS Pathog. 2012;8(4):e1002660. 10.1371/journal.ppat.1002660 [DOI] [PMC free article] [PubMed] [Google Scholar]
- 49. Alroomi M, Rajan R, Omar AA, et al. Ferritin level: a predictor of severity and mortality in hospitalized COVID‐19 patients. Immun Inflamm Dis. 2021;9(4):1648‐1655. 10.1002/iid3.517 [DOI] [PMC free article] [PubMed] [Google Scholar]
- 50. Henry BM, Aggarwal G, Wong J, et al. Lactate dehydrogenase levels predict coronavirus disease 2019 (COVID‐19) severity and mortality: a pooled analysis. Am J Emerg Med. 2020;38(9):1722‐1726. 10.1016/j.ajem.2020.05.073 [DOI] [PMC free article] [PubMed] [Google Scholar]
- 51. Mei H, Luo L, Hu Y. Thrombocytopenia and thrombosis in hospitalized patients with COVID‐19. J Hematol Oncol. 2020;13(1):161. 10.1186/s13045-020-01003-z [DOI] [PMC free article] [PubMed] [Google Scholar]
Associated Data
This section collects any data citations, data availability statements, or supplementary materials included in this article.
Supplementary Materials
Supporting information.
Data Availability Statement
The data that support the findings of this study are available from the corresponding author upon reasonable request.