

Abstract
Rapid detection of antibodies to SARS‐CoV‐2 is critical for COVID‐19 diagnostics, epidemiological research, and studies related to vaccine evaluation. It is known that the nucleocapsid (N) is the most abundant protein of SARS‐CoV‐2 and can serve as an excellent biomarker due to its strong immunogenicity. This paper reports a rapid and ultrasensitive 3D biosensor for quantification of COVID‐19 antibodies in seconds via electrochemical transduction. This sensor consists of an array of three‐dimensional micro‐length‐scale electrode architecture that is fabricated by aerosol jet 3D printing, which is an additive manufacturing technique. The micropillar array is coated with N proteins via an intermediate layer of nano‐graphene and is integrated into a microfluidic channel to complete an electrochemical cell that uses antibody‐antigen interaction to detect the antibodies to the N protein. Due to the structural innovation in the electrode geometry, the sensing is achieved in seconds, and the sensor shows an excellent limit of detection of 13 fm and an optimal detection range of 100 fm to 1 nm. Furthermore, the sensor can be regenerated at least 10 times, which reduces the cost per test. This work provides a powerful platform for rapid screening of antibodies to SARS‐CoV‐2 after infection or vaccination.
Keywords: 3D printing and functional sensors, antibody, SARS‐CoV‐2, N protein
Highlights
This work demonstrates a microfluidic biosensor with 3D printed array electrodes that detects nucleocapsid (N) antibodies to SARS‐CoV‐2 in mere 10‐12 seconds. This breakthrough technology will save lives and help in the management of the ongoing COVID‐19 pandemic.
1. INTRODUCTION
The ongoing COVID‐19 pandemic is evolving due to the emergence of several SARS‐CoV‐2 variants and their high infectivity. 1 , 2 , 3 Rapid screening of antibodies specific to SARS‐CoV‐2 can facilitate diagnosis, ascertain the effectiveness of the vaccines, and help with epidemiological studies. 4 , 5 , 6 , 7 Understanding the virus‐immune dynamics of large populations after vaccination could be useful to enable their safe return to work, school, and daily life. 8 In addition, antibody tests can quantify how fast antibodies develop after infection and assist in developing an effective vaccine to fight different SARS‐CoV‐2 strains. For most patients, the concentration of immunoglobulin M (IgM) antibodies increases to a high level within the first 2 weeks of a SARS‐CoV‐2 infection and then decreases thereafter. 9 IgM is detectable within 3–6 days of infection. The immunoglobulin G (IgG) antibodies, however, can be detected only after 8 days of infection, and their concentration remains the same for a long period of time. 10 After several weeks of infection, IgG reactivity reaches >98%, but the duration of this antibody response is still unclear. Currently, serological tests, 11 , 12 , 13 lateral‐flow immunoassay, 14 chemiluminescence immunoassay, 13 surface‐enhanced Raman scattering (SERS)‐PCR, 15 , 16 , 17 and fluorescence immunoassay 18 are important tools for monitoring immunity after a SARS‐CoV‐2 infection or vaccination. These methods, however, suffer from low sensitivity and specificity and are unable to detect low concentrations of antibodies. Some of these problems arise from the lack of quality sample collection, presample processing with multiple steps, and sample contamination. To overcome these issues, there is an unmet need to develop a sensitive device that quickly and accurately identifies the biomarkers for the infection even when in low concentrations. Ultimately, such a device could help combat the medical and economic challenges posed by the current and future pandemics.
Sophistication in biosensor manufacturing has been driven by advanced fabrication tools since the invention of the oxygen electrode. 19 These fabrication technologies have led to the miniaturization of the devices, introduced multiple functionalities via multiplexing, and improved device performances. 20 Cleanroom‐based lithography methods are excellent at creating 2D structures in a highly repeatable manner. 21 These methods, however, involve multiple processing steps and need expensive cleanroom facilities. More importantly, 2D sensor surfaces inherently limit the analytical sensitivity, even if coated with nanomaterials to increase the effective surface area. 22 , 23 Introduction of structural innovations in the geometries of biomedical sensors can bring unique sensing capabilities for molecular biomarkers. Emerging methods such as additive manufacturing (i.e., 3D printing), where nanomaterials can sequentially be added to build 3D geometries, can lead to such structures. 24 On the whole, 3D printing has revolutionized the manufacturing sector through its ability to create hierarchical complex architectures, controlled microstructures, and material combinations, 25 all of which have benefited the biosensor area. 26 , 27
Recently, the authors' research group has used Aerosol Jet 3D printing (AJP) to create 3D microlattices and microscaffolds of metal nanoparticles without any support structures. 28 These structures were used in a recent study to overcome the limitations imposed by 2D electrodes to detect spike (S) antibodies to SARS‐CoV‐2. 29 Gold micropillar arrays were fabricated by AJP and then coated with graphene oxide nanosheets and the S proteins of SARS‐CoV‐2. The 3D micropillar geometry was shown to enhance the reaction kinetics and reduce reaction times to as low as 10 s with a low limit‐of‐detection (LoD) and a wider detection range. 29 , 30 This prior work motivated us to utilize the 3D biosensing platform developed earlier 29 to detect nucleocapsid (N) antibodies specific to SARS‐CoV‐2. Note that the N protein of SARS‐CoV‐2 is known as a highly immunogenic phosphoprotein that modulates cell signaling pathways and is used for viral genome replication.31 Among other proteins (S1, RBD, membrane, and envelope), 32 the N protein is a target protein for vaccine development 33 , 34 and acts as representative protein for SARS‐specific T‐cell proliferation in a vaccine setting. Note that the IgG, IgA, and IgM antibodies against N proteins can be identified in COVID‐19 patients. 35 Due to its role in infection, antibodies to the S1 protein have a higher neutralizing capacity compared to antibodies to the N protein. 36 The detection of the spike (S1 and RBD) antibodies to SARS‐CoV‐2 are thus important to understand the immunodynamics of the patients, as described in previous work. 29 Nevertheless, it is also important to detect N antibodies. Detection of antibodies to both proteins can increase sensitivity and confidence when evaluating the presence of antibodies against the virus. Further, the heterogeneous IgG responses of N and S antibodies with long‐term kinetics are important to characterize patients during their SARS‐CoV‐2 infection or after vaccination.
This work demonstrates the sensing of N antibodies to SARS‐CoV‐2 in seconds using a 3D‐printed biosensing platform. An AJP machine was used to create an array of micropillars consisting of layer‐by‐layer assembled gold (Au) nanoparticles. The micropillar array was thermally sintered. This helped in coating the N protein onto the 3D micro‐surface, which was accomplished by introducing an intermediate layer of reduced graphene oxide (rGO) nanosheets. A polydimethylsiloxane (PDMS)‐based microfluidic channel was prepared separately using replica molding and integrated into the substrate having a 3D‐printed micropillar array, and the counter and reference electrodes (RE). This sensor employed electrochemical transduction to track biomolecule interactions on the micropillar surface, thereby detecting the COVID‐19 antibodies within 10 s. Unlike 2D biosensors, the proposed 3D‐printed sensor platform showed high sensitivity, low LoD, rapid response, regenerability, and good selectivity. The results of sensor stability, incubation analysis, and pH analysis are also included in this study. This biosensing platform could be useful for the sensing of other antibodies specific to influenza, Ebola, human immunodeficiency virus, etc.
2. MATERIALS AND METHODS
2.1. Device manufacturing of sensing elements
An optical image of the 3D‐printed biosensor developed in this work is shown in Figure 1A. The 3D biosensor consists of a micropillar array of Au nanoparticles coated with rGO sheets and N protein. Details of Au nano‐printing of the device can be found in Ali et al. 29 In summary, a 10 × 10 micropillar array was fabricated to serve as the working electrode (WE) of the device, while bare Au and silver/silver chloride (Ag/AgCl) electrodes acted as the counter electrode (CE) and the RE, respectively, to complete the electrochemical cell circuit. The base of all electrodes in the device was made of an Au layer that was deposited on a glass substrate by using an e‐beam evaporator. For this, a Kapton® tape‐based shadow mask was created by a programmable automated cutter (Silhouette Curio Cutting Machine, Silhouette America® Inc.) and placed on the glass substrate before the deposition of an adhesion layer of 5 nm‐thick chromium, followed by a 100 nm‐thick Au layer (Kurt Lesker PVD 75). Following that, the geometries of 2D planar and 3D micropillar array electrodes were manufactured on the surface of the WE (2 × 2 mm 2 ) using the AJ nano‐printer.
Figure 1.
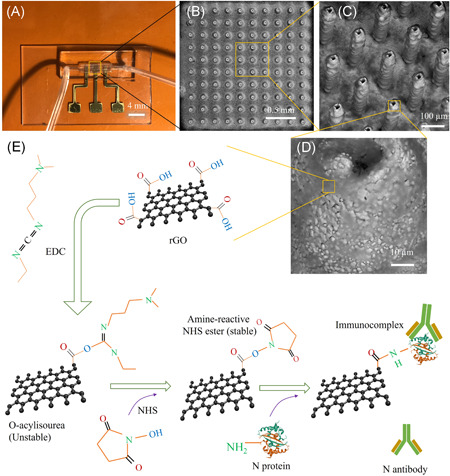
Device structure for the detection of antibodies to N protein of SARS‐CoV‐2 (i.e., N antibodies). (A) An optical image of the AJ printed 3D sensor. A 10 × 10 array of Au micropillars was printed and then coated with rGO sheets and N protein to form the working electrode of the device. The working electrode was assembled into a microfluidic channel. (B) SEM image showing the top‐view of rGO‐coated Au array (rGO‐Au). (C) High magnification SEM image (tilted at 45°) of the 3D rGO‐Au array. (D) Representative close‐up SEM image showing the surface texture of a micropillar. All the micropillars are hollow in construction. (E) Stepwise process of functionalization of the surface of rGO‐Au micropillars for N‐protein conjugation via EDC‐NHS coupling chemistry. SEM, scanning electron microscope
A commercial ink of Au nanoparticles (UTDAu40, UT Dots Inc.) was used to manufacture the micropillar array; the average Au particle size was 4 nm, the ink viscosity was 3 cP, and particle loading in the ink was 40 wt%. The Au nanoparticles were dispersed in an organic nonpolar solvent, which was aerosolized during the AJ 3D printing (AJ300, Optomec Inc.). In the AJ machine, a mist of the Au ink was created by applying ultrasonic energy which consisted of droplets of Au nanoparticles (1–5 µm). These droplets were then brought to a deposition head using a carrier gas (N2). A sheath gas (N2) was then used to focus the nanoparticle stream on the substrate at a length scale of 10 µm using a 150‐µm‐diameter nozzle. The carrier and the sheath gas pressures for the printing were maintained at 24 and 60 sccm, respectively, for the entire printing of the Au microelectrode array. The platen was fixed at a temperature of 150°C by adjusting an external heater that is connected to the movable x‐y stage of the AJP. An AutoCAD (Autodesk) programing code was generated using AutoLISP software to print Au ink in a layer‐by‐layer circular fashion to reach a height of approximately 250 µm for each individual pillar. The resulting micropillars were made of multiple micro‐rings that were stacked over each other, with the height of each micro‐ring being approximately 10 µm. The drying process of a printed micro‐ring develops a solid surface on which the next micro‐ring can be printed. As a result of this process, a small dip was formed on the top of the micropillar (Figure 1D). The micropillars were heated to 350°C for 4 h to remove the binders in the ink and sinter the array.
Scanning electron microscope images of the Au micropillar array coated with rGO sheets (rGO‐Au) of the sensor are shown in Figure 1B–D. The micropillars have a diameter of approximately 73 µm and a pillar‐to‐pillar distance of approximately 118 µm. The surface texture of the micropillars is evident in Figure 1D. This surface texture is believed to aid in the adhesion of rGO sheets and N protein (antigen) to the micropillars. The functionalization of rGO with N protein was enabled by EDC‐NHS conjugation chemistry as described in Section 2.3 below. A 2D WE was also printed with the same Au ink for a comparative study. This 2D WE has a dimension of 2 × 2 mm2 and a thickness of 20 µm. For RE, a thin layer of Ag/AgCl paste (~1 µm thickness; same supplier as in Ali et al. 37 ) was applied on the Au‐glass by placing a shadow mask and drying it at 120°C for 2 h. After that, the electrode pads in the device were connected to a potentiostat for electrochemical measurements.
2.2. Fabrication of a microfluidic device
A microfluidic channel was created to control fluidic flow during the sensing of antibodies. The microchannel was made of PDMS material via a two‐step process of micromachining and replica molding. This was further integrated with a glass substrate containing the three electrodes, as described above. The fabrication process was described in the authors' previous work. 29 In summary, a polymethyl methacrylate (PMMA) mold was fabricated using a high‐precision milling machine. This mold contained a channel that was 1 mm wide, 1 mm deep, and 2 cm long. The width of the channel in the middle portion (1 cm long) was kept at 2 mm to fit the micropillar array. The surface of the PMMA mold was treated with silicone oil before pouring the PDMS solution (containing a PDMS oligomer and a crosslinker in a ratio of 10:1). The poured PDMS solution was cured at 80°C for 2 h. Peeling off of the cured PDMS from the PMMA mold provided an opposite pattern for the channel. This process was repeated on the surface of the opposite pattern on the PDMS substrate to get the final microfluidic channel. Two holes were created by punching a hollow needle into the PDMS to connect the channel with Tygon® tubes for the injection of an antibody and buffer solutions. With the size of the channel, 30 µl volume of liquid is required to fill up the entire channel. This channel was then assembled with the sensor substrate after the surface functionalization of WE with rGO and N protein. The microchannel was temporarily sealed using a method described in literature 38 that consisted of using a simple conformal contact between the glass substrate containing the three electrodes and the PDMS mold. The PDMS‐glass bonding was realized via a conformal contact mediated by van der Waals forces. 39
2.3. Surface functionalization
For the functionalization of WE using rGO and antigens, first a PDMS fence was created and placed surrounding the micropillar array. Separately, an rGO colloidal solution was prepared in deionized water at a concentration of 0.2 mg/ml via sonication for 2 h. The powder form of rGO flakes used for this purpose, obtained from ACS Materials LLC, had a conductivity of >500 Sm−1, a thickness of about 1 nm, and a diameter of 0.5–10 µm as per the manufacturer specifications. A 50 µl rGO solution was drop‐casted onto the micropillar array surrounded by the PDMS fence. The substrate with the array was then kept on a hot plate (85°C) for 1 h, and this process was repeated twice to obtain enough rGO coating on the micropillar surfaces. The rGO sheets on the pillar array are shown in Figure 1C and 1D. It was expected that the decoration of rGO sheets on the micropillar surfaces is nonuniform due to ‐ interactions among the sheets. The rGO‐Au micropillar was then immobilized with N protein via covalent conjugation, shown in Figure 1E. For this, a 30 µl mixer solution of 1‐ethyl‐3‐(3‐dimethylaminopropyl) carbodiimide hydrochloride (EDC; 0.2 M) and N‐hydroxysuccinimide (NHS; 0.05 m) in a ratio of 1:1 was prepared and drop‐casted onto the micropillar array. The substrate was then kept inside a humid chamber for 4 h at room temperature. A 20 µl solution of N protein (5 µg/ml) to SARS‐CoV‐2 was spread onto the micropillar surface thereafter and kept for 4 h under humid conditions to complete the immobilization. In this reaction, EDC acted as a crosslinker for the functional groups (–COOH) that are present at the edges of rGO sheets and are allowed to bind with the primary amine (–NH2) of N proteins. However, the resulting intermediate was not stable. To address this, a stabilizer such as NHS ester was used as shown in Figure 1E. This allowed an amidation reaction wherein the primary amine (–NH2) of the N protein binds with the –COOH terminal of rGO‐Au by establishing a C‐N amide bond. A 50 µl solution of bovine serum albumin (BSA; 2 mg/ml) was spread on the electrodes (3D rGO‐Au/N protein) and kept for 2 h in the humid chamber. BSA was used as a blocking agent to avoid nonspecific binding of antibodies or albumin molecules that are present in body fluids during testing. Similarly, a 2D‐printed rGO‐Au surface was functionalized with N proteins and used for the control studies. Functionalized sensors were stored at 4°C while not in use. After functionalization, the PDMS microfluidic channel was manually placed on the glass substrate carrying the electrodes under a microscope. The sensors were connected to the microfluidic tubes before measurements. All the chemicals, reagents, and instruments used in this study are described in Section 2 of the Supporting Information Material.
3. RESULTS AND DISCUSSION
3.1. Sensor characterization
As the working principle of the sensor is based on electrochemical impedance transduction, the sensor was characterized using an electrochemical impedance spectroscopic (EIS) technique before sensing COVID‐19 N antibodies. EIS is a powerful, label‐free sensing method that can measure the change in the dielectric properties of an electrode surface as a result of antibody‐protein interaction. Figure 2A shows the EIS graphs of 3D sensors having electrodes with a 3D Au array, with rGO coating, and with rGO and N‐protein coating. An alternative current signal with an amplitude of 1 mV and a frequency range of 1–10 000 Hz was applied for the EIS measurements. In addition, a phosphate buffer saline (PBS, pH 7.4, 50 mm) with an equimolar concentration of redox marker (ferro/ferricyanide; 1 mm) was chosen as an electrolyte. The impedance signals of the sensors were obtained due to a redox reaction of a redox probe wherein the produced electrons were transferred through the Au micropillars. An equivalent circuit between the WE, CE, and electrolyte is depicted in Figure 2B. In this circuit, the charge transfer resistance (Rct) due to the hindrance of the electron transfer (kinetic behavior) from the electrolyte to the Au micropillar is established parallelly with the double layer capacitance (Cdl) that is formed between the WE and electrolyte. The diffusion of electrons (or ions) can create the Warburg resistance (Zw) which is connected to Rct in series, as shown in Figure 2B.
Figure 2.
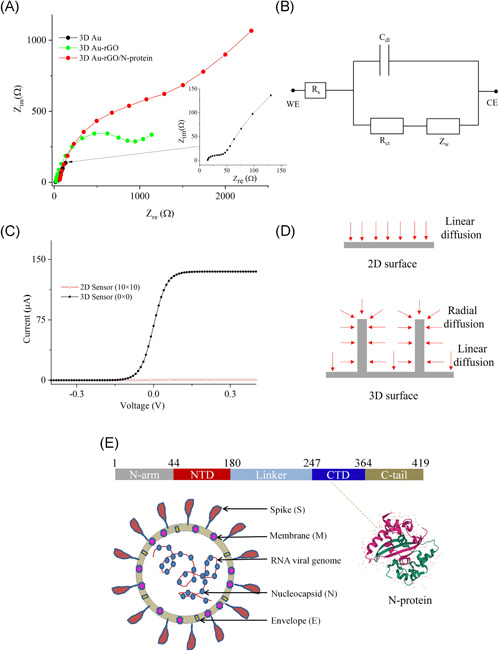
Electrochemical characterization of the biosensor. (A) Nyquist plots of the 3D sensors with 3D Au, 3D Au‐rGO, and 3D Au‐rGO/N‐protein electrodes. This experiment was conducted in presence of pbs with an equimolar concentration (1 mm) of ferro/ferricyanide. The frequency was set to 1–10 000 Hz while the amplitude was maintained at 1 mV. Inset of (A) shows the impedance spectra for 3D Au electrode. (B) An equivalent circuit between WE and CE for the calculation of Rct, solution resistance (Rs) and Warburg resistance (Zw), and double‐layer capacitance (Cdl). (C) Total current (one‐dimensional) obtained via COMSOL simulation for both 2D (0 × 0) and 3D (10 × 10) sensors. (D) Radial and linear diffusion of redox species for 3D and planar (2D) electrode surface. (E) Schematic showing the structure of N protein of SARS‐CoV‐2, which is also shown in the novel coronavirus (COVID‐19). The crystal structure of SARS‐CoV‐2 nucleocapsid C‐terminal domain (CTD) protein (pdb#7CE0) is also shown
The 3D Au micropillar electrode without rGO sheets and rGO/N protein provided a low Rct of 38 Ω (Figure 2A). Coating of rGO sheets on the 3D Au micropillar electrode (3D Au‐rGO) increased the Rct to 1094 Ω due to the presence of functional groups in rGO sheets, which block the electron transfer. Furthermore, N‐protein coating on the 3D Au‐rGO electrode increased the Rct to 2357.8 Ω. Protein molecules on the 3D Au‐rGO acted as a barrier to the transfer of electrons due to their insulating nature, leading to the higher Rct. A similar trend of Rct values was obtained in the case of 2D sensors with 2D Au, 2D Au‐rGO, and 2D Au‐rGO/N‐protein electrodes, which are calculated as 394, 639, and 1438.6 Ω, respectively (Figure S1A of Supporting Information Material). However, the impedance of the bare 2D Au sensor is found to be higher compared to the impedance of the 3D Au micropillar sensor. Note that the 2D surface provides linear diffusion of electrons while the 3D surface provides radial diffusion of electrons, resulting in a low impedance for the sensor with the 3D electrode. Schematics of their diffusion mechanism are shown in Figure 2D. Owing to the larger surface area of the 3D micropillar surface, the loading of protein molecules was expected to be high. A comparison plot between 2D and 3D sensors of the EIS measurements after loading of N protein is shown in Supporting Information Material (Figure S1B). Interestingly, it is found that the impedance signal of the 3D sensor is enhanced by 160% compared to the 2D sensor. The enhancement of impedance signal in the 3D sensor is reflected in the sensing capabilities of COVID‐19 antibodies, which is discussed in Section 3.3.
3.2. COMSOL simulation
Using a finite element analysis software (COMSOL Multiphysics®, Version 5.5, COMSOL Inc.), the diffusion profile of redox species for 2D (planar) and 3D micropillar geometries as the WE were simulated. Simulation results for both sensors are shown in Figure 2C,D. Section 1 in the Supporting Information Material describes the boundary conditions and other parameters for the COMSOL simulation. The total current generated due to an electrochemical reaction at the surface of the 2D electrode is lower compared to that at the 3D surface (Figure 2C). The diffusion profile of redox species on the 2D surface is found to be linear, while that on the 3D surface is found to be radial as well as linear (Figure 2D). Unlike planar 2D surfaces, the resulting high current of 3D micropillar array electrodes is due to the radial diffusion of the redox species. The enhanced diffusion due to the 3D surface of the micropillar electrode was expected to significantly improve the sensing capabilities of biomolecular interaction events at low concentrations.
3.3. Sensing of COVID‐19 nucleocapsid antibody
The N protein has 422 amino acids and has a molecular weight of 46.6 kDa. 40 A schematic illustration of the multivalent RNA‐binding protein is shown in Figure 2E. Surjit et al. 40 demonstrated that the N protein is one of the major antigens of coronavirus and could be an attractive diagnostic biomarker for the sensing of COVID‐19 antibodies at early stages of SARS‐CoV‐2 infection. Nucleocapsid in SARS‐CoV‐2 plays multiple roles during its pathogenesis, including viral replication. 41 The structure of SARS‐CoV‐2 and the N protein are demonstrated in Figure 2E, wherein the viral genome is encapsulated by the N protein. 41 The N protein binds to viral RNA, leading to the formation of the helical nucleocapsid. The viral membrane of SARS‐CoV‐2 contains the spike S1 protein, a glycoprotein, and the envelope protein. In this work, the coating of N protein on the sensor structure was implemented as a candidate diagnostic tool 42 for the sensing of COVID‐19 antibodies via electrochemical transduction. N protein is found to be highly immunogenic and expressed adequately after infection. 43
EIS measurements for the sensing of N antibodies were made using the AJ‐printed 3D sensor (i.e., 3D Au‐rGO/N protein). As a control test of the sensor, pbs, rabbit serum (rs), and fetal bovine serum (fbs) solutions were prepared and tested as well. For the sensing of N antibodies, the titrate concentration of N antibodies was diluted successively from 1 nm to 100 fm. The Nyquist plots of each concentration of N antibodies are shown in Figure 3A, and their corresponding Rct values are shown in Figure 3B. The baseline signal of a 3D sensor with pbs solution was established at an Rct value of 2.3 kΩ. When the 3D sensor was tested with rs and fbs, it showed a relative standard deviation of ±2.9% compared to the baseline signal. Even though these sera contained a large portion of albumin proteins (~60%), the 3D sensor did not show a significant change in the signal. Upon introducing the antibody (at a concentration of 100 fm), the Rct value increased to 2.8 kΩ, which represents a significant enhancement over the baseline signal. This is due to the binding affinity of the N protein that decorated the surface of the 3D electrodes to N antibodies, resulting in the formation of an antigen‐antibody immunocomplex. The formation of this complex on the 3D electrode surface blocks the electron transfer through the Au micropillars due to the redox reaction of ferro/ferricyanide, resulting in increased Rct of the sensor. This is the main principle of this sensor for the detection of N antibodies for COVID‐19. Further, as the concentration of N antibodies increased from 100 fm to 1 nm, the resulting Rct values increased. These results suggest that the sensor is an excellent indicator of the presence of N antibodies in the solution.
Figure 3.
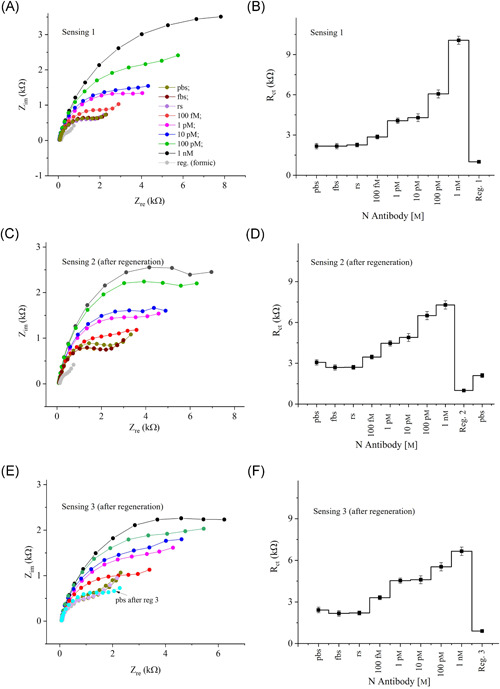
Sensing results of N antibodies. (A) Impedance response (Nyquist plots) of the 3D sensor for the detection of N antibodies. The concentration of N antibodies was varied from 100 fm to 1 nm by adding pbs. Rabbit serum (rs) and fetal bovine serum (fbs) were used for control measurements. The detection frequency and ac signal amplitude were set at 1–10 000 Hz, and 1 mV, respectively. An equimolar concentration of ferro/ferricyanide (1 mm) was used as a redox marker. (B) The Rct obtained from the Nyquist plots in (A) are plotted against the N‐antibody concentration. Once the titrate measurements were completed, the sensor was regenerated using a low‐pH chemistry. The sensing graphs shown in (C) and (D) are similar in trend to that of (A) and (B) respectively, but with some signal degradation. Another regeneration of N‐antibody sensing is shown in (E) and (F). Each error bar represents data from three measurements
The sensor was then regenerated by applying formic acid (1 m), a low pH (2.5) solution, with 60 s incubation time. After regeneration, the baseline signal of the sensor was found to be 2.4 kΩ which is slightly higher than the baseline signal of the sensor before regeneration. This may be due to the residual N proteins which may not have been eluted from the sensor surface. Results after the sensor regeneration are shown in Figure 3C,D. These figures show a similar trend as Figure 3B, i.e., as the N‐antibody concentration was increased, the signal also increased. However, the sensor showed a decreased response compared to a fresh sensor (Figure S2, Supporting Information Material). The sensor was then regenerated for the second time with a baseline signal of 3.0 kΩ, which is again a higher value compared to the sensor before regeneration. However, the sensor showed an excellent response as the N‐antibody concentration was increased. The Rct values for three cases in Figure 3B, 3D, and 3F are plotted together as a function of N‐antibody concentration in Figure S2 of Supporting Information Material. The slope of the 3D sensor decreases gradually (SlopeNoReg [1641 Ω] > SlopeReg.1 [970 Ω] > SlopeReg.2 [769 Ω]) with each regeneration. The sensitivity of the sensor thus decreased with each regeneration.
To comparatively investigate the sensor performance, similar tests were conducted using the 2D AJ nano‐printed sensor (2D Au‐rGO/N protein). Sensing of N antibodies from 100 fm to 1 nm were performed with identical conditions as the 3D sensor. Results are shown in Figure S3 of the Supporting Information Material. The baseline impedance (Rct) of the 2D sensor was found at 1.2 kΩ. With the control fluids, such as rs and fbs, the sensor showed a relative standard deviation of ±4.2% from the baseline signal. Once N antibodies were introduced at 100 fm, the signal shifted to 1.5 kΩ. When the concentration of N antibodies was increased, the Rct values of 2D sensor increased, as expected, due to the formation of immunocomplex on the sensor surface. The Rct values are plotted against the concentration in Figure S3B, Supporting Information Material. Sensor calibration graphs for both the 2D and 3D structures are shown in Figure 4A. The superior performance of the 3D sensor is evident from the fact that the 3D sensor exhibited 20‐fold higher sensitivity compared to the 2D sensor for N‐antibody sensing. The LoD for the 3D and 2D sensors are 13 fm and 2.5 pm, respectively, which was calculated based on previous literature 44 as discussed in Section 3 of the Supporting Information Material.
Figure 4.
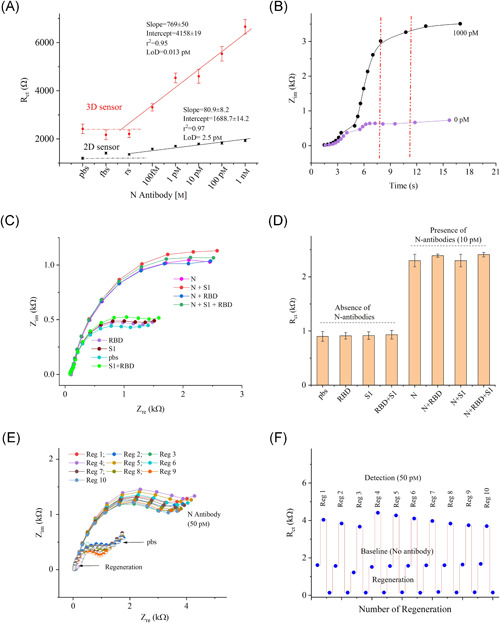
Limit‐of‐detection, detection time, selectivity, and regeneration studies of the 3D sensor. (A) Sensor calibration plots for both 2D and 3D sensors with information showing the regression coefficient (r2) and limit‐of‐detection. Error bars in these plots represent three measurements. (B) Detection time as a function of impedance (Zim) for N antibodies. The sensor reached to ~95% of signal within 8 s. (C, D) Selectivity studies of the sensor where the impedance responses (Nyquist plots) are shown in (C) and Rct values are shown in (D). This study was conducted in presence of a fixed concentration of N antibodies (10.0 pm), spike S1 antibodies (10.0 pm), and RBD antibodies (10.0 pm). Results indicate a good selectivity of the sensor. (E, F) Regeneration study of the sensor where the sensor was exposed to 1.0 m solution of the formic acid assay (pH 2.5). The sensor showed 10× regeneration capability for detection of N antibodies
Many nanostructures with 2D surfaces were utilized in the construction of biosensors to detect biomolecules that provide high sensitivity, within a picomolar (10−12 m) range. 45 , 46 , 47 , 48 , 49 However, due to high background signal and lack of reactive surface areas, the biosensors cannot detect biomolecules down to femtomolar concentrations. It has been suggested that the incorporation of electrodes with multilength‐scale architecture can allow a very low concentration of biomolecules to be detected in a reasonable amount of time. 50 The 3D sensor used in this study provides a low LoD of 13 fm, while the 2D sensor shows an LoD of 2.5 pm. The LoD of the 3D sensor is 192‐times higher than that of the 2D sensor, likely due to the multilength‐scale electrode architecture of the 3D sensor. In other words, the multilength‐scale electrode in the microfluidic channel reduces the diffusion path of the target N antibodies, providing an excellent platform for virus‐immunodynamic analysis.
The detection time of biomolecular assays such as ELISA, rt‐PCR, and genome sequencing for COVID‐19 tests are known to be 30 min to 24 h. Currently, rapid screening of antibodies takes about 15 min. Unlike these tests, this novel 3D sensor takes less than 10 s to detect N antibodies. Results for the time required for detection are shown in Figure 4B. Approximately 94% of the impedance signal is reached within 8 s during the detection of the antibodies. As noted before, this is also due to the sensor structures with multi‐length‐scale architecture, which reduces the diffusion path of the target molecules to be captured on the 3D surface.
Figure S4 of the Supporting Information Material shows the magnitude of impedance signal as a function of frequencies (1–10 000 Hz). At lower frequencies, ranging from 1 to 100 Hz, the magnitude of the impedances was found to increase with the concentration of N antibodies. However, at higher frequencies (from 100 to 10 000 Hz), the magnitude of impedances is almost unchanged.
3.4. Selectivity and regeneration studies of 3D sensor
To test the selectivity, the effect of the most relevant interfering antibodies, such as spike S1 and receptor‐binding domain (RBD), was studied. The selectivity test was conducted at a low concentration (10 pm) of the interfering and target antibodies (see Figure 4C,D). A PBS solution was used to establish the baseline, followed by the solutions of S1, RBD, and a mixer of S1 and RBD antibodies. The sensor revealed the impedance signals close to the baseline signal for S1 and RBD antibodies (relative standard deviation of 1.37%), but a deviation of 3.3% with the mixer of S1 and RBD antibodies. Once the solution with target N antibodies (10 pm) was introduced, the sensor showed high impedance even with its low concentration. When the interfering antibodies were mixed, the sensor did not show a significant change in the impedance signal, as evident by its low relative standard deviation of 2.5%. Note that the N‐sensor surface was coated with BSA to block the nonspecific protein adsorption. The BSA coating on the 3D surface hinders the binding of other proteins, resulting in consistent impedance values for the sensor. This is because the negatively charged BSA molecules on the sensors repel negatively charged protein molecules. These results indicate that this sensor is highly selective to the target N antibodies.
The regenerable sensors should meet two important conditions for optimal performance: (a) a strong surface chemistry to provide surface stability that retains activity after multiple regenerations and (b) fully dissociated antibodies (from the sensor surface) upon regeneration. To test the sensor regeneration, a low‐pH (2.5) buffer solution, formic acid (1 m), was used. In this study, once the sensor was tested with N antibodies (50 pm), the sensor was exposed to the regeneration solution for a short incubation time of 60 s. The pbs solution was then used multiple times to elute the antibodies from the sensor electrode. After completing one cycle, the sensor was again tested by establishing its baseline. This process was repeated 10 times, and results are shown in Figure 4E,F. Binding of captured antibodies is due to either weak noncovalent interactions such as hydrogen bonds and hydrophobic interactions, or van der Waals forces, which form immunocomplex on the sensor surface. 51 As expected, the 3D sensor provided a full dissociation of N antibodies from N proteins on the sensor surface by disruption of noncovalent bonds of the complex. The acidic buffer was chosen due to its ability to break the ionic, hydrophobic, or hydrogen bonding between proteins (antigens) and antibodies without denaturing the proteins and thus retaining the sensor activity after regeneration. After 10 regenerations, the sensor baseline showed a deviation of 7.4% and retained sensing activity at 50 pm with a signal deviation of 5.8%. The results indicate that the sensor can be reused up to 10 times.
3.5. Incubation time, binding kinetics, and reproducibility of the 3D sensor
The 3D sensor was further tested to evaluate the incubation time with the target N antibodies. Figure 5A,B show the sensor results for this study. A low concentration of N antibodies (100 fm) was applied for this test. Upon loading the antibody solution, the sensor readings were monitored at 2‐min intervals without washing the sensor. After 6 repeated measurements (12 min), the sensor did not change its impedance signal compared to its baseline signal (relative standard deviation or RSD ~2.3%). This indicates that the 3D sensor was able to capture antibodies within less than 1 min due to incorporation of the 3D micropillar array as described in Section 3.2. Figure 5C shows the binding study of the antibody‐antigen interactions on the sensor surface. In the association phase of this study, when the N‐antibody solution (1 nm) was introduced, the sensor showed a higher impedance signal. This is due to both captured, bound, and unbound antibodies present on the sensor. In the dissociation phase, the unbound antibodies moved away from the sensor surface when the sensor was washed with pbs, resulting in reduced impedance. However, the signal change from association to dissociation is not significant. This may be due to a measurement condition in which the buffer was not running or circulating continuously over time. 52
Figure 5.
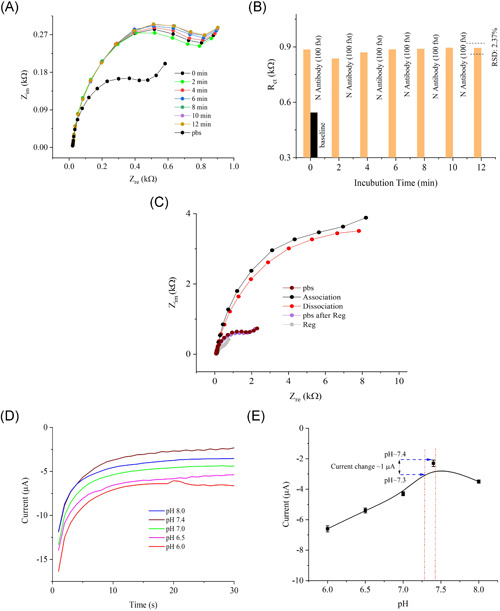
Incubation time and kinetic analysis of the 3D biosensor. (A, B) Incubation time of the sensor for 100 fm concentration of N antibodies. The graph shows the sensor responses at different times after injection of the N‐antibody solution. (B) Rct values for the plots in (A) as a function of the incubation time in minutes. The sensor signal shows a deviation of only 2.3% from the initial signal after 12 min. This indicates that the sensor signal exhibits minimal degradation even for a long incubation time. (C) Association/dissociation (binding) study of the sensor. (D) pH studies of the 3D‐printed bioelectrode (N protein/rGO‐Au). The study shows chronoamperometric responses of the N‐sensor as a function of pH (6.0–8.0). Five identical buffer solutions were prepared for this study at different pH values and tested using the same sensor. (E) Saturated currents obtained at 30 s are plotted against the pH values. Each error bar represents data from three replicate measurements (n= 3) of the sensor
Sensor‐to‐sensor variation was tested to evaluate the reproducibility of the 3D sensor. The RSD is estimated as 3.6% with four identical 3D sensors. The results of this study is shown in Figure S5 of the Supporting Information Material. These results indicate a high reproducibility of the 3D sensor, which is likely due to the reproducible micropillar array by the AJ printing method.
3.6. pH and stability of the 3D sensor
To determine the stability of the 3D sensor in different pH, a 3D‐printed N‐sensor was tested at pH values beyond the physiological pH range for the human body (pH ~7.35–7.45) and at the identical condition as the chronoamperometric method. 53 Figure 5D,E show that the sensor signal varies by 4.3 µA for pH values between 6.0 and 8.0. The range of current change was within 1 µA when tested in the human physiological range of pH approximately 7.35–7.45. However, the magnitude of the current was found to be optimized within the physiological pH range of the human body (close to a pH of 7.4). Hence, an optimized pH value of 7.4 was chosen for the sensing experiments.
Further EIS experiments were conducted to investigate the activity of an Au micropillar array sensor decorated with N protein over time. For this study, a 0.1 pm concentration of N‐antibody was used. The sensor was tested at a regular interval of 3 days, up to 12 days, and was stored at 4 ºC while not in use. The results are shown in Figure S6 of the Supporting Information Material. After 12 days, a decay of Rct value of the sensor was found to be ±6.0% compared to the initial signal. The change in the base signal without N antibodies was found to be ±4.7% within 12 days compared to the initial signal. These results demonstrate that the sensor exhibits minimal loss in sensing activity even after 12 days, forming a reliable detection platform for COVID‐19 N antibodies. In future work, it will be important to evaluate the utility of this sensor with human samples.
4. CONCLUSIONS
This work describes the development of an N protein‐based 3D biosensor for the detection of SARS‐CoV‐2 antibodies in seconds. This sensor was realized by AJP technology, wherein a multilength‐scale electrode architecture comprising of an array of Au micropillars was manufactured. The N protein was decorated on the surface of the Au micropillar array in this sensor which showed an unprecedented analytical sensitivity (100 fm) to monitor nucleocapsid antibodies to SARS‐CoV‐2. The results indicate that the 3D sensing platform provides a low LoD of 13 fm, which is 192‐times lower than that for a planar (i.e., 2D) sensor (LoD ~2.5 pm). This lower limit of detection is due to the structural innovation of multilength‐scale 3D electrode geometry that is used in the 3D sensor architecture. The 3D electrode array reduces the diffusion length for the electrochemical cell with radial diffusion of the ionic species, resulting in high sensitivity and low LoD. Reusability of the sensor is established, which helps reduce the cost per test. The technology developed in this work is a powerful tool for the rapid detection of COVID‐19 antibodies, which can help in the diagnosis and evaluation of vaccine efficacy. This biosensing platform will open new pathways for the rapid screening of COVID‐19 patients and study their immune response after infection or after vaccination.
CONFLICT OF INTERESTS
The authors declare that there are no conflict of interests.
AUTHOR CONTRIBUTIONS
Rahul Panat: came up with the 3D printed sensor concept. Rahul Panat, Shou‐Jiang Gao, and Md. Azahar Ali: came up with the idea of using N‐antibody testing using the 3D sensor platform. Rahul Panat and Shou‐Jiang Gao: directed the research. Md. Azahar Ali: built the device, developed the various chemistries required for functioning of the device, carried out all the tests, and wrote the first draft of the manuscript. Shou‐Jiang Gao and Fei Zhang: provided inputs from the biology side and provided several biomolecules used in this study. Chunshan Hu and Bin Yuan: carried out the AJ printing of the Au micropillar electrodes. Mohammad S. Saleh: wrote the original program for AJ printing of micropillars. Sanjida Jahan: carried out SEM microscopy, along with the simulations of the electrochemical process using COMSOL software. All authors contributed to interpreting the data and preparing and editing the manuscript.
Supporting information
Supporting information.
ACKNOWLEDGEMENTS
The authors would like to acknowledge the use of the Materials Characterization Facility at Carnegie Mellon University under grant # MCF‐677785.
Ali MA, Hu C, Zhang F, et al. N protein‐based ultrasensitive SARS‐CoV‐2 antibody detection in seconds via 3D nanoprinted, microarchitected array electrodes. J Med Virol. 2022;94:2067‐2078. 10.1002/jmv.27591
Contributor Information
Shou‐Jiang Gao, Email: gaos8@upmc.edu.
Rahul Panat, Email: rpanat@andrew.cmu.ed.
REFERENCES
- 1. Kuzmina A, Khalaila Y, Voloshin O, et al. SARS‐CoV‐2 spike variants exhibit differential infectivity and neutralization resistance to convalescent or post‐vaccination sera. Cell Host Microbe. 2021;29(4):522‐528 e522. [DOI] [PMC free article] [PubMed] [Google Scholar]
- 2. Weissman D, Alameh MG, de Silva T, et al. D614G spike mutation increases SARS CoV‐2 susceptibility to neutralization. Cell Host Microbe. 2021;29(1):23‐31 e24. [DOI] [PMC free article] [PubMed] [Google Scholar]
- 3. Tegally H, Wilkinson E, Giovanetti M, et al. Detection of a SARS‐CoV‐2 variant of concern in South Africa. Nature. 2021;592(7854):438‐443. [DOI] [PubMed] [Google Scholar]
- 4. Li Z, Yi Y, Luo X, et al. Development and clinical application of a rapid IgM‐IgG combined antibody test for SARS‐CoV‐2 infection diagnosis. J Med Viro. 2020;92(9):1518‐1524. [DOI] [PMC free article] [PubMed] [Google Scholar]
- 5. Zhao J, Yuan Q, Wang H, et al. Antibody responses to SARS‐CoV‐2 in patients with novel coronavirus disease 2019. Clin Infect Diseas. 2020;71(16):2027‐2034. [DOI] [PMC free article] [PubMed] [Google Scholar]
- 6. Morales‐Narváez E, Dincer C. The impact of biosensing in a pandemic outbreak: COVID‐19. Biosens Bioelectr. 2020;163:112274. [DOI] [PMC free article] [PubMed] [Google Scholar]
- 7. Rashed MZ, Kopechek JA, Priddy MC, et al. Rapid detection of SARS‐CoV‐2 antibodies using electrochemical impedance‐based detector. Biosens Bioelectr. 2021;171:112709. [DOI] [PMC free article] [PubMed] [Google Scholar]
- 8. Phelan AL. COVID‐19 immunity passports and vaccination certificates: scientific, equitable, and legal challenges. The Lancet. 2020;395(10237):1595‐1598. [DOI] [PMC free article] [PubMed] [Google Scholar]
- 9. Hou H, Wang T, Zhang B, et al. Detection of IgM and IgG antibodies in patients with coronavirus disease 2019. Clin Transl Immunol. 2020;9(5):e1136. [DOI] [PMC free article] [PubMed] [Google Scholar]
- 10. Xiao S‐Y, Wu Y, Liu H. Evolving status of the 2019 novel coronavirus infection: proposal of conventional serologic assays for disease diagnosis and infection monitoring. J Med Virol. 2020;92(5):464‐467. [DOI] [PMC free article] [PubMed] [Google Scholar]
- 11. Zhou P, Yang X‐L, Wang X‐G, et al. A pneumonia outbreak associated with a new coronavirus of probable bat origin. Nature. 2020;579(7798):270‐273. [DOI] [PMC free article] [PubMed] [Google Scholar]
- 12. Perera RA, Mok CK, Tsang OT, et al. Serological assays for severe acute respiratory syndrome coronavirus 2 (SARS‐CoV‐2), March 2020. Euro Surveill. 2020;25(16):2000421. [DOI] [PMC free article] [PubMed] [Google Scholar]
- 13. Muench P, Jochum S, Wenderoth V, et al. Development and validation of the Elecsys Anti‐SARS‐CoV‐2 immunoassay as a highly specific tool for determining past exposure to SARS‐CoV‐2. J Clin Microbiol. 2020;58(10):e01694‐01620. [DOI] [PMC free article] [PubMed] [Google Scholar]
- 14. GeurtsvanKessel CH, Okba N, Igloi Z, et al. An evaluation of COVID‐19 serological assays informs future diagnostics and exposure assessment. Nat Commun. 2020;11(1):1‐5. [DOI] [PMC free article] [PubMed] [Google Scholar]
- 15. Wu Y, Dang H, Park S‐G, Chen L, Choo J. SERS‐PCR assays of SARS‐CoV‐2 target genes using Au nanoparticles‐internalized Au nanodimple substrates. Biosens Bioelectr. 2021;197:113736. [DOI] [PMC free article] [PubMed] [Google Scholar]
- 16. Chen H, Park S‐G, Choi N, et al. Sensitive Detection of SARS‐CoV‐2 Using a SERS‐Based Aptasensor. ACS Sens. 2021. [DOI] [PubMed]
- 17. Kim K, Kashefi‐Kheyrabadi L, Joung Y, et al. Recent advances in sensitive surface‐enhanced Raman scattering‐based lateral flow assay platforms for point‐of‐care diagnostics of infectious diseases. Sens Actuat B: Chem. 2021;329:129214. [DOI] [PMC free article] [PubMed] [Google Scholar]
- 18. Pisanic N, Randad PR, Kruczynski K, et al. COVID‐19 serology at population scale: SARS‐CoV‐2‐specific antibody responses in saliva. J Clin Microbiol. 2020;59(1):e02204‐e02220. [DOI] [PMC free article] [PubMed] [Google Scholar]
- 19. Severinghaus JW. The invention and development of blood gas analysis apparatus. The J. Amer. Soc. Anesthesiol. 2002;97(1):253‐256. [DOI] [PubMed] [Google Scholar]
- 20. Vyawahare S, Griffiths AD, Merten CA. Miniaturization and parallelization of biological and chemical assays in microfluidic devices. Chemist. Biol. 2010;17(10):1052‐1065. [DOI] [PubMed] [Google Scholar]
- 21. Piyasena ME, Graves SW. The intersection of flow cytometry with microfluidics and microfabrication. Lab Chip. 2014;14(6):1044‐1059. [DOI] [PMC free article] [PubMed] [Google Scholar]
- 22. Fruncillo S, Su X, Liu H, Wong LS Lithographic Processes for the Scalable Fabrication of Micro‐and Nanostructures for Biochips and Biosensors. ACS Sens. 2021. [DOI] [PMC free article] [PubMed]
- 23. Sheehan PE, Whitman LJ. Detection limits for nanoscale biosensors. Nano Lett. 2005;5(4):803‐807. [DOI] [PubMed] [Google Scholar]
- 24. Yang H, Rahman MT, Du D, Panat R, Lin Y. 3‐D printed adjustable microelectrode arrays for electrochemical sensing and biosensing. Sens. Actuat. B: Chem. 2016;230:600‐606. [DOI] [PMC free article] [PubMed] [Google Scholar]
- 25. Muñoz J, Pumera M. 3D‐printed biosensors for electrochemical and optical applications. TrAC Trends Anal Chem. 2020;128:115933. [Google Scholar]
- 26. Palenzuela CLM, Pumera M. Bio) Analytical chemistry enabled by 3D printing: sensors and biosensors. TrAC Trends Anal Chem. 2018;103:110‐118. [Google Scholar]
- 27. Ali MA, Hu C, Yttri EA, Panat R. Recent advances in 3D printing of biomedical sensing devices. Adv Funct Mater. 2021:2107671. [DOI] [PMC free article] [PubMed] [Google Scholar]
- 28. Saleh MS, Hu C, Panat R. Three‐dimensional microarchitected materials and devices using nanoparticle assembly by pointwise spatial printing. Sci Adv. 2017;3(3):e1601986. [DOI] [PMC free article] [PubMed] [Google Scholar]
- 29. Ali MA, Hu C, Jahan S, et al. Sensing of COVID‐19 antibodies in seconds via aerosol jet nanoprinted reduced‐graphene‐oxide‐coated 3D electrodes. Adv Mater. 2021;33(7):2006647. [DOI] [PMC free article] [PubMed] [Google Scholar]
- 30. Ali MA, Hu C, Yuan B, et al. Breaking the barrier to biomolecule limit‐of‐detection via 3D printed multi‐length‐scale graphene‐coated electrodes. Nat. Comm. 2021;12(1):1‐16. [DOI] [PMC free article] [PubMed] [Google Scholar]
- 31. Zeng W, Liu G, Ma H, et al. Biochemical characterization of SARS‐CoV‐2 nucleocapsid protein. Biochem Biophys. Res. Comm. 2020;527(3):618‐623. [DOI] [PMC free article] [PubMed] [Google Scholar]
- 32. Chen Y, Liu Q, Guo D. Emerging coronaviruses: genome structure, replication, and pathogenesis. J Med Virol. 2020;92(4):418‐423. [DOI] [PMC free article] [PubMed] [Google Scholar]
- 33. Dutta NK, Mazumdar K, Gordy JT. The nucleocapsid protein of SARS–CoV‐2: a target for vaccine development. J Virol. 2020;94(13):e00647‐00620. [DOI] [PMC free article] [PubMed] [Google Scholar]
- 34. Samper IC, Sánchez‐Cano A & Khamcharoen W et al. Electrochemical Capillary‐Flow Immunoassay for Detecting Anti‐SARS‐CoV‐2 Nucleocapsid Protein Antibodies at the Point of Care. ACS Sens. 2021. [DOI] [PMC free article] [PubMed]
- 35. Zeng W, Liu G, Ma H, et al. Biochemical characterization of SARS‐CoV‐2 nucleocapsid protein. Biochem Biophys Res Comm. 2020;527(3):618‐623. [DOI] [PMC free article] [PubMed] [Google Scholar]
- 36. McAndrews KM, Dowlatshahi DP, Dai J, et al. Heterogeneous antibodies against SARS‐CoV‐2 spike receptor binding domain and nucleocapsid with implications for COVID‐19 immunity. JCI Insight. 2020;5(18):e142386. [DOI] [PMC free article] [PubMed] [Google Scholar]
- 37. Ali MA, Wang X, Chen Y, et al. Continuous monitoring of soil nitrate using a miniature sensor with poly (3‐octyl‐thiophene) and molybdenum disulfide nanocomposite. ACS Appl. Mater. Interf. 2019;11(32):29195‐29206. [DOI] [PubMed] [Google Scholar]
- 38. Ali MA, Srivastava S, Solanki PR, et al. Highly efficient bienzyme functionalized nanocomposite‐based microfluidics biosensor platform for biomedical application. Sci Rep. 2013;3(1):1‐9. [DOI] [PMC free article] [PubMed] [Google Scholar]
- 39. Gervais L, De Rooij N, Delamarche E. Microfluidic chips for point‐of‐care immunodiagnostics. Adv Mater. 2011;23(24):H151‐H176. [DOI] [PubMed] [Google Scholar]
- 40. Surjit M, Lal SK. The nucleocapsid protein of the SARS coronavirus: structure, function and therapeutic potential. Molecular Biology of the SARS‐Coronavirus. Springer; 2010:129‐151. 10.1007/978-3-642-03683-5_9 [DOI] [Google Scholar]
- 41. Savastano A, de Opakua AI, Rankovic M, Zweckstetter M. Nucleocapsid protein of SARS‐CoV‐2 phase separates into RNA‐rich polymerase‐containing condensates. Nat. Comm. 2020;11(1):1‐10. [DOI] [PMC free article] [PubMed] [Google Scholar]
- 42. Bai Z, Cao Y, Liu W, Li J. The SARS‐CoV‐2 nucleocapsid protein and its role in viral structure, biological functions, and a potential target for drug or vaccine mitigation. Viruses. 2021;13(6):1115. [DOI] [PMC free article] [PubMed] [Google Scholar]
- 43. Okada M, Takemoto Y, Okuno Y, et al. The development of vaccines against SARS corona virus in mice and SCID‐PBL/hu mice. Vaccine. 2005;23(17‐18):2269‐2272. [DOI] [PMC free article] [PubMed] [Google Scholar]
- 44. Armbruster DA, Tillman MD, Hubbs LM. Limit of detection (LQD)/limit of quantitation (LOQ): comparison of the empirical and the statistical methods exemplified with GC‐MS assays of abused drugs. Clin Chem. 1994;40(7):1233‐1238. [PubMed] [Google Scholar]
- 45. Cui Y, Wei Q, Park H, Lieber CM. Nanowire nanosensors for highly sensitive and selective detection of biological and chemical species. Science. 2001;293(5533):1289‐1292. [DOI] [PubMed] [Google Scholar]
- 46. Wang H, Branton D. Nanopores with a spark for single‐molecule detection. Nat. Biotech. 2001;19(7):622‐623. [DOI] [PubMed] [Google Scholar]
- 47. Singh‐Zocchi M, Dixit S, Ivanov V, Zocchi G. Single‐molecule detection of DNA hybridization. Proc Nat Acad Sci. 2003;100(13):7605‐7610. [DOI] [PMC free article] [PubMed] [Google Scholar]
- 48. Soleymani L, Fang Z, Sargent EH, Kelley SO. Programming the detection limits of biosensors through controlled nanostructuring. Nat Nanotech. 2009;4(12):844‐848. [DOI] [PubMed] [Google Scholar]
- 49. Chen JB, Yousefi H, Nemr CR, et al. Nanostructured architectures for biomolecular detection inside and outside the cell. Adv Funct Mater. 2020;30(37):1907701. [Google Scholar]
- 50. Kelley SO, Mirkin CA, Walt DR, Ismagilov RF, Toner M, Sargent EH. Advancing the speed, sensitivity and accuracy of biomolecular detection using multi‐length‐scale engineering. Nat. Nanotech. 2014;9(12):969‐980. [DOI] [PMC free article] [PubMed] [Google Scholar]
- 51. Goldberg RJ. A theory of antibody—antigen reactions. I. Theory for reactions of multivalent antigen with bivalent and univalent antibody2. J Amer Chem Soc. 1952;74(22):5715‐5725. [Google Scholar]
- 52. Kandimalla VB, Neeta NS, Karanth NG, et al. Regeneration of ethyl parathion antibodies for repeated use in immunosensor: a study on dissociation of antigens from antibodies. Biosens Bioelectr. 2004;20(4):903‐906. [DOI] [PubMed] [Google Scholar]
- 53. Ali A, Ansari AA, Kaushik A, et al. Nanostructured zinc oxide film for urea sensor. Mater Lett. 2009;63(28):2473‐2475. [Google Scholar]
Associated Data
This section collects any data citations, data availability statements, or supplementary materials included in this article.
Supplementary Materials
Supporting information.