

Abstract
Background
A better understanding of innate and adaptive cells in COVID‐19 is necessary for the development of effective treatment methods and vaccines.
Methods
We studied phenotypic features of innate and adaptive immune cells, oxidative burst, phagocytosis, and apoptosis. One hundred and three patients with COVID‐19 were grouped according to their clinical features into the categories of mild (35%), moderate (40.8%), and severe (24.3%).
Results
Monocytes were CD16+ pro‐inflammatory monocytes and tended to shed their HLA‐DR, especially in severe cases (p < 0.01). Neutrophils were mature and functional, although a decline of their CD10 and CD16 was observed (p < 0.01). No defect was found in the reactive oxygen species production and their apoptosis. The percentage of natural killer cells was in the normal range, whereas the percentages of CD8+NK and CD56+T lymphocytes were found to be high (p < 0.01). Although the absolute numbers of all lymphocyte subsets were low and showed a tendency for a gradual decrease in accordance with the disease progression, the most decreased absolute number was that of B lymphocytes, followed by CD4+ T cells in the severe cases. The percentages of double‐negative T cells; HLA‐DR+CD3+ and CD28−CD8+ subsets were found to be significantly increased. Importantly, we demonstrated the increased baseline activation of caspase‐3 and increased lymphocyte apoptosis.
Conclusion
We suggest that SARS‐CoV‐2 primarily affects the lymphocytes and not the innate cells. The increased baseline activation of Caspase‐3 could make the COVID‐19 lymphocytes more vulnerable to cell death. Therefore, this may interrupt the crosstalk between the adaptive and innate immune systems.
Keywords: apoptosis, caspase‐3, COVID‐19, immunophenotyping, oxidative burst
1. INTRODUCTION
SARS‐CoV‐2 virus, which originated from Wuhan, China in December 2019, is a positive‐sense, single‐stranded RNA virus, that has led to a worldwide pandemic (Lu et al., 2020; Modrow et al., 2013). The disease caused by the virus was officially named as the Coronavirus Disease 2019 (COVID‐19) by the World Health Organization on February 11, 2020. The first identified route of SARS‐Cov‐2 uptake into the cell was found to be through the ACE‐2 receptors (Shang et al., 2020; Wang, Zhang, et al., 2020). Although it has been observed that the virus predominantly attacks the lungs causing pneumonia; other organ involvement is also possible, especially since the ACE‐2 receptor is commonly found in the human body (Palasca et al., 2018). Indeed, past clinical experiences, since the inception of the pandemic, have shown that COVID‐19 affects other organs and tissues as well (Xydakis et al., 2020). SARS‐CoV‐2 belonging to the Coronavirus family has similarities with the Middle East Respiratory Syndrome (MERS) and Severe Acute Respiratory Syndrome (SARS) viruses in the context of ACE‐2 receptor binding. However, it has been shown that SARS‐Cov‐2 has a higher virulence and stronger attachment to the ACE‐2 receptor (Shang et al., 2020).
COVID‐19 disease progression can be mild (81%), moderate (14%), and severe (5%) according to its pulmonary involvement and multiple organ failure (Wu & McGoogan, 2020). The current data shows that the recent mortality rate of COVID‐19 has increased up to 6.3%; although it varies with age, gender, occupational group, and presence of comorbidities such as diabetes and hypertension (Coronavirus disease 2019, 2020; Li, Guan, et al., 2020; Targher et al., 2020).
First‐line of defense against intracellular invaders starts with innate immune cells, including monocytes, macrophages, and neutrophils. Activation of monocytes, macrophages, bystanders, and bridging dendritic cells by pattern recognition receptors, results in the release of the pro‐inflammatory cytokines such as IL‐1, IL‐18, IL‐33, and IL‐6. These cytokines activate the natural killer (NK) cells. NK activation is critical for viral defense due to their cellular cytotoxic function and their cytokine release in the particular interferon‐gamma that activates both B and T cells (Paul, 2013). Adaptive activation is a requirement for eliminating the invaders, constructing a proper immune memory, and also for limiting innate activation. Studies with T cell‐deficient or RAG‐1 deficient mice demonstrated that the lack of lymphocytes resulted in a cytokine storm syndrome and death (Kim et al., 2007). The crosstalk between the innate and adaptive immune systems constitutes our entire immune system, but every fine‐tuned interaction could be a new target point for the various strategies of the virus to escape an immune attack.
The vicious circle of cytokine storm syndrome and hyperinflammation seen in COVID‐19, causes the rapid deterioration of the patients' condition, as well as the increase in the mortality rate due to respiratory failure (Mehta et al., 2020; Ulhaq & Soraya, 2020). Studies have shown that SARS‐COV2 uses strategies to inhibit the interferon signaling pathway. Thus, it can be interpreted that it suppresses adaptive activation (Park & Iwasaki, 2020).
Although the knowledge of immune pathogenesis of the disease is very limited, lymphopenia, the change of neutrophil/lymphocyte ratio in favor of neutrophils, as well as the increased level of LDH, CRP, and ferritin seems to vary in proportion with the severity of the disease. These parameters are used in the follow‐up of the disease (Wang, Hou, et al., 2020; Yan et al., 2020). In the autopsies of individuals who died due to COVID‐19, neutrophils, monocyte/macrophage infiltration, as well as a few helper T cells were detected in their lungs (Li, Jiang, et al., 2020; Yao et al., 2020). It is noteworthy that NK and CD8+ cytotoxic T cells, which are the primary fighters against viral infection, were not present in the lungs. Considering lymphopenia, it brings the suspicion that the SARS‐CoV‐2 virus may attach to other surfaces and cytoplasmic molecules other than ACE‐2, and may also target the lymphoid system apoptosis similar to the SARS‐CoV virus 7a protein, which induces apoptosis by competing to bind anti‐apoptotic member of the Bcl‐2 family, Bcl‐XL (Tan et al., 2007).
Immune profiles of patients with COVID‐19 should be examined to get more information in order to establish more valid immune hypotheses on this disease (Tan et al., 2007). Indeed, several immune impairments such as a low number of CD4+, CD8+ T lymphocytes, NK cells as well as B lymphocytes have already been shown (Giamarellos‐Bourboulis et al., 2020; Qin et al., 2020; Saksena & Chattopadhyay, 2021). The functions of T lymphocytes measured by interferon‐γ release following stimulation have been found to be in the normal range (Qin et al., 2020). In this cross‐sectional study, we aimed to investigate the peripheral innate and adaptive cells, burst and phagocytosis functions of monocyte and neutrophils, and lymphocyte apoptosis of patients with COVID‐19 in various disease courses.
Delineation of the phenotypic and functional impairments created by the SARS‐CoV‐2 virus in the cells of innate and adaptive immune systems will help to better recognize the virus and to develop effective treatment and prevention strategies.
2. PATIENTS AND METHODS
2.1. Patients
A total of 103 COVID‐19 patients with various symptoms, who applied to Istanbul Memorial Şişli Hospital and Marmara University Pendik Training and Research Hospital, were included in the study (52 females, and 51 males with the mean age of 53.9 ± 15 [25–88]). The demographic features of the study groups have been given in Table 1. COVID‐19 RT‐PCR positivity was the inclusion criterion for the study. The outpatient group and a group of patients with mild CT findings were classified together as the “mild group” (n = 36; 35%); patients with more common CT involvement, but with oxygen saturation above 90% were classified as the “moderate group” (n = 42; 40.8%); patients with diffuse lung involvement along with oxygen saturation below 90% were grouped as the “severe group” (n = 25; 24.3%; Table 2). The mean hospitalization time for the latter two groups was 8 ± 8.5 days (range: 1–51). The study was approved by the Marmara University, Ethics Committee (no:08.05.2020/09.2020.541). Informed consent was obtained from the participants before the study.
TABLE 1.
Demographic and clinical features of study groups
| Age | Gender | ||
|---|---|---|---|
| mean ± SD (range) | (female/male) | Presence of chronic disease | |
| Patients with COVID‐19 (n = 103) | 53.9 ± 15 (25–88) | 52F/51M | +52.4% (n = 54) a |
|
Healthy controls (n = 100) |
47.8 ± 11 (29–72) |
53F/47M |
– |
|
p |
>0.05 |
>0.05 |
Hypertension: 16.5% (n = 17); diabetes mellitus: 14.6% (n = 15); ischemic cardiac disease: 4.9% (n = 5); other: 23.3% (n = 24; a plethora of diseases such as Behcet's disease, psoriasis, chronic kidney disease, asthma, sarcoidosis, chronic lung disease).
TABLE 2.
Clinical classification of the patients
| n (%) | PCR | CT | O2 saturation | Lymphocytes (%) | |
|---|---|---|---|---|---|
| Mild | 36 (35%) | + | −/+ | >90% | >20 % |
| Moderate | 42 (40.8%) | + | + | >90% | 20%>L>15% |
| Severe | 25 (24.3%) | + | ++ | <90% | <15% |
2.2. Controls
One‐hundred historical control subjects matched by age (47.8 ± 11 [29–74]) and gender (53 females, 47 males) were included in the study (Table 1). The raw flow cytometric data from healthy controls that have been previously tested for the routine laboratory norm studies and the samples that have been used as controls in previous studies were used. White blood cells (WBC) of historic controls had been assessed with the same method mentioned below.
2.3. Isolation of WBC and immunophenotyping
Peripheral blood–WBC of all participants was isolated from their hemogram tubes with EDTA taken for their routine tests by using an erythrocyte lysing solution (ELS: 155 mM NH4Cl; 10 mM KHCO3; 0.1 mM EDTA; pH: 7.3). The following combinations with fluorochrome labeled monoclonal antibodies (mAb) and isotype‐matched controls were used for two‐three‐four colors phenotypic analysis: (1) CD3 FITC/CD8 PE/CD45 PerCP/CD4 APC and/or CD4 FITC/CD8 PE/CD3 PERCP/CD56 APC and/or CD3 FITC/CD16 PE + CD56 PE/CD4 PerCP/CD8 APC; (2) CD45 FITC/HLA‐DR PE/CD19 PerCP/CD20 APC; (3) CD16 FITC/CD10 PE; (4) CD3 FITC/HLA‐DR PE/CD56 APC; (5) CD4 FITC/CD69 PE/CD3 PerCP (6) CD8 FITC/CD69 PE/CD3 PerCP; (7) CD8 FITC/CD28 PE; (8) CD20 FITC/CD19 PE/CD138 APC; (Becton&Dickinson Inc, San Jose, CA, USA). Following the incubation of cells with antibodies for 20 minutes at room temperature in the dark, the cells were washed with phosphate‐buffered saline (PBS) and were immediately acquired, and subsequently analyzed using CellQuest software on a FACSCalibur flow cytometer (Becton Dickinson Inc, San Jose, CA, USA) similar to the control samples that had been previously tested. Multiple gating strategies were applied. Debris was excluded by using a gate that included all WBC in the forward and side scatter plot or by using CD45/SSC plot where CD45 labeling was available. Lymphocytes, monocytes, and neutrophils were regated according to their forward and side scatter characteristics, and their specific CD markers within the first WBC gate such as 100% HLA‐DR expression for monocytes. Populations were evaluated as a percentage and mean fluorescence intensity (MFI), which is a relative indicator of the number of molecules per unit cell.
2.4. Calculation of the absolute number of subsets
The absolute numbers of subsets were calculated with a simple excel formula using lymphocyte numbers and ratios obtained from simultaneously tested hemograms of patients and controls.
2.5. Oxidative burst and phagocytosis
Heparinized blood samples from 13 patients in the moderate clinical course and five healthy controls were tested for oxidative burst (OB) and phagocytosis functions of their neutrophils and monocytes, according to the manufacturer's instructions (PhagoBurst Test [CE/IVD], Becton Dickinson Inc, San Jose, CA, USA). The samples from patients and controls were simultaneously tested. Briefly, 100 μl of heparinized whole blood per each test was stimulated with (a) phorbol 12‐myristate 13‐acetate (PMA); and (b) unlabeled opsonized bacteria. An unstimulated sample tube (c) was used as a negative control. Tubes were incubated for exactly 10 min at 37°C in a preheated water bath. The incubation time and temperature were strictly monitored. Dihydrorhodamine (DHR) 123 as a fluorogenic substrate was added into all the tubes and incubated for an additional 10 min under the same conditions. Then, samples were lysed by ELS and washed with PBS; a DNA binding reagent provided by the manufacturer was added into tubes and then immediately acquired by flow cytometry. DNA binding reagent was used for live gating in accordance with the instructions. The results were evaluated according to the percentages given by the manufacturer's instructions.
2.6. Apoptosis and cell death
WBCs from 13 patients with a moderate clinical course and five healthy controls were isolated from heparinized blood samples by using ELS. Briefly, the cells (1 × 10⁵/ml) were resuspended in PBS containing 5% fetal bovine serum (FBS), and one tube was stimulated for apoptosis using 100 ng/ml of PMA at 37°C for 1 h, while other was incubated at the same temperature without stimulation, as a control. Then, 9 mM Phi‐Philux.G1D2 was added to the tubes, and then the samples were incubated for an additional 1 h under the same conditions. Following the incubation, PI (20 mg/ml in PBS) was added to evaluate cell death simultaneously. Then at least 40,000 cells were immediately acquired by flow cytometry (FACSCalibur, Becton Dickinson Inc) using CellQuest software. Cells only stained with PhiPhilux were evaluated as early apoptosis or activation; PhiPhilux+PI stained cells as late apoptosis; and cells stained only with PI as cell death. The percentages of early, late apoptosis, and cell death were assessed in lymphocyte, monocyte, and neutrophil gates. Initial MFI values of PhiPhilux fluorescence in unstimulated samples that demonstrate the baseline activation status of the cells were measured and compared.
2.7. Statistical analysis
The statistical software package SPSS version 25.0 was used for all the statistical analyses. Statistical significance of differences between the groups was calculated by either ANOVA and followed by Bonferonni test as post‐hoc, or by the Kruskal Wallis test followed by the Mann–Whitney U test as post‐hoc when needed. The p‐values given in the text are the p‐values obtained from the post hoc tests. Pearson rank correlation test was used where needed. Results were given as mean ± SD (in 95% confidence interval of mean). The significance of pre‐post measurements was calculated using the Wilcoxon signed ranks test. Values of p < 0.05 were regarded as significant.
3. RESULTS
3.1. The percentages and absolute numbers of leucocyte groups
WBC counts, and percentages of lymphocytes, monocytes, and neutrophils, and their absolute numbers in patients with COVID‐19 have been summarized in Table 3. There was no difference found in total WBC numbers between the groups. The lymphocyte percentage was found to be significantly lower in the moderate (19.2% ± 10.8) and severe (15.1% ± 8.9) groups as compared to the mild group (30% ± 11.8; p < 0.01). Absolute lymphocyte count was lower in the moderate (1060 ± 929 cells/μl) and severe group (876 ± 676 cells/μl) compared to the mild group (1486 ± 827 cells/μl; p = 0.02). The percentage of monocytes was higher in the mild (10.9% ± 3.9) COVID‐19 patients compared to moderate (8.1% ± 3.8) and severe (9.1% ± 4) patients (p < 0.05); whereas no difference was found the in absolute monocyte counts. In addition to the increase in the percentages of neutrophils, the absolute number of neutrophils was found to be statistically high in the moderate (70.8% ± 13; 4485 ± 2981 cells/μl) and severe (74.5% ± 10.9; 4300 ± 2081 cells/μl) groups versus the mild group (57.3% ± 14; 2988 ± 1690 cells/μl; p < 0.01). It has been shown that lymphopenia deepened and granulocytosis increased, as both percentage and absolute number were proportional to the severity of the disease in accordance with the literature (Wang, Hou, et al., 2020).
TABLE 3.
Patients' leucocyte number and percentages in various COVID‐19 disease courses
| WBC | Lymphocytes | Monocytes | Neutrophil | |
|---|---|---|---|---|
| (cells/mm3) | (%)/(cells/ml) | (%)/(cells/ml) | (%)/(cells/ml) | |
| Mild (n = 36) | 5.4 ± 2 | 30 ± 11.8* (1486 ± 827)# | 10.9 ± 3.9* (532 ± 250) | 57.3 ± 14* (2988 ± 1690)# |
| Moderate (n = 42) | 6.1 ± 3.3 | 19.2 ± 10.8 (1060 ± 929) | 8.1 ± 3.8 (449 ± 241) | 70.8 ± 13 (4485 ± 2981) |
| Severe (n = 25) | 5.8 ± 2.7 | 15.1 ± 8.9 (876 ± 676)# | 9.1 ± 4 (481 ± 333) | 74.5 ± 10.9 (4300 ± 2081) |
| p value | NS | *: p < 0.01; # p = 0.02 | *: p < 0.05; NS | *: p < 0.01; # p < 0.01 |
Note: The percentage *(p < 0.01) and absolute numbers #(p = 0.02): of lymphocytes were significantly low in the moderate and severe groups compared to the mild group. The percentage of monocytes was high in the mild COVID‐19 patients compared to moderate and severe patients *(p < 0.05). The percentage *(p < 0.01), and the absolute number #(p < 0.01) of neutrophils were significantly high in the moderate and severe groups in comparison to the mild group. Comparisons were analyzed by ANOVA followed by Bonferroni test as post hoc. The results were given as mean values in 95% CI ± SD.
Abbreviation: NS, not significant.
3.2. Phenotypic and functional features of innate immune system cells in COVID‐19
Phenotypic features of monocytes, neutrophils, NK and NK‐like innate lymphoid cells (n = 93), and OB, phagocytosis, and apoptosis of monocyte and neutrophils in a group of patients (n = 13) were assessed.
3.2.1. Pro‐inflammatory monocytes with decreased HLA‐DR expression in patients with COVID‐19
As antigen‐presenting cells, monocytes constitutively express HLA‐DR. In our study group, the MFI of HLA‐DR was 532 ± 138 in the mild; 456.7 ± 82 in the moderate; and 413 ± 100 in the severe group (Figure 1a). Although a gradual decrease in MFI values was observed between the groups, no statistical significance was found. However, HLA‐DR MFI on monocytes from all the patient groups was significantly lower in comparison to the healthy controls (752 ± 352; p < 0.01; Figure 1a).
FIGURE 1.
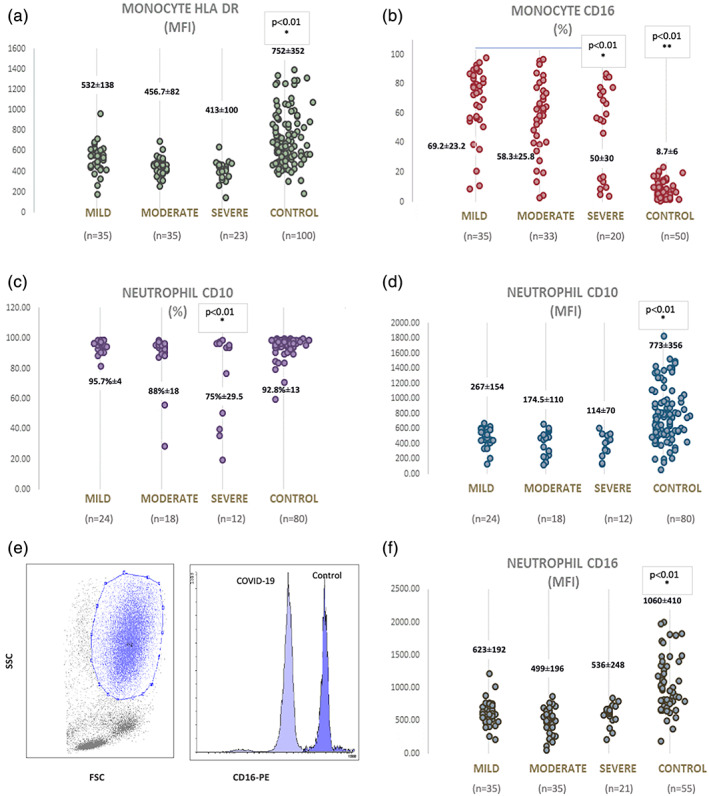
Comparisons of phenotypic features of monocytes and neutrophils in patients with COVID‐19 and controls (a) MFI values of HLA‐DR on monocytes from COVID‐19 patients are significantly different from the controls p < 0.01). (b) The expression of CD16 on monocytes tended a gradual decrease depending on the disease course (*: p < 0.01 between the mild and severe groups). However, all were significantly high in comparison to controls (**: p < 0.01). (c) The percentage of CD10 expression on neutrophils is significantly low in severe cases (*: p < 0.01). (d) MFI values of CD10 on neutrophils in patients with COVID‐19 are low compared to controls. (*: p < 0.01) (e) A representative plot showing gate for neutrophils on FSC versus SSC and a histogram demonstrating CD16 expression on neutrophils from a patient with COVID 19 and healthy control. (f) CD16 MFI values of neutrophils in patients with COVID‐19 are lower in comparison to controls (*: p < 0.01). MFI, mean fluorescence intensity [Color figure can be viewed at wileyonlinelibrary.com]
Expression of CD16 defines a subgroup known as pro‐inflammatory monocytes (Chimen et al., 2017). We demonstrated that monocytes of all groups of COVID‐19 expressed CD16, whereas that expression was very low in the healthy control group (69.2% ± 23.2 in the mild; 58.3% ± 25.8 in the moderate; 50% ± 30 in the severe group of patients versus 8.7% ± 6 in controls, p < 0.01 Figure 1b). That difference was also significant between the mild and severe cases (p = 0.007). Monocytes from patients with COVID‐19 tended to lose their CD16 during the progression of the disease.
3.2.2. Expressions of CD10 and CD16 on neutrophils from COVID‐19 patients
Expression of CD10, and CD16 were measured on neutrophils as the markers of maturation. The percentage of CD10 was found to be 95.7% ± 4 in the mild; 88% ± 18 in the moderate; 74.9% ± 29.5 in the severe group, and 92.8% ± 13 in the control group. CD10 expression was found to be significantly lower in the severe group as compared to the other groups (p < 0.01; Figure 1c). A consistent decrease in CD10 MFI has been found in all three groups (267 ± 154 in mild patients, 174.5 ± 110 in moderate, 114 ± 70 in the severe group), but the only statistical difference was found when compared to controls (773 ± 356, p < 0.01; Figure 1d). The mean MFI values for CD16 expression were 623 ± 192 in the mild group, 499 ± 196 in the moderate group, and 618 ± 154 in the severe group versus 1060 ± 410 in the control group. No difference was found between the groups. However, MFI values of CD16 were lower in all three groups versus the controls (p < 0.01; Figure 1e,f). The decline of CD10 was correlated with the decline of CD16 on neutrophils in severe cases (r: 0.455; p = 0.01).
3.2.3. Full competency in ROS production and phagocytosis of neutrophils and monocytes in COVID‐19
The OB of neutrophils and monocytes is measured as a percentage value, as the result of the conversion of non‐fluorescent dihydrorhodamine (DHR123) to fluorescent rhodamine 123, oxidized by the reactive oxygen species (ROS) that were produced by the stimulated cells. The percentage of OB in both monocytes and neutrophils of COVID‐19 patients (n = 13) was greater than 95%, similar to that of the control group, indicating that there was no defect in the ROS production of monocytes and neutrophils of COVID‐19 patients (Figure 2). Similar results were obtained from the phagocytosis of E. coli (>%90 in both monocytes and neutrophils). In addition to the percentage results, the fold increase was calculated by dividing the MFI values from each stimulated sample to samples' own initial MFIs. The fold increase in ROS production in the OB experiments was not different between the patients and the controls (2.3 ± 0.2 fold for neutrophils OB; 2.1 ± 0.1 fold for monocyte OB in both groups).
FIGURE 2.
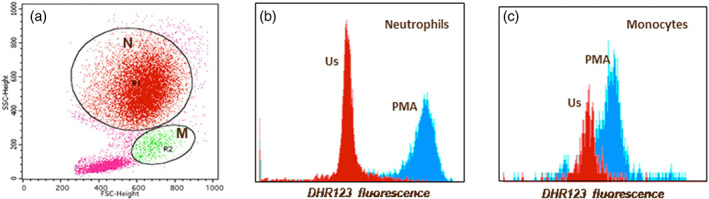
A representative figure for neutrophil and monocyte oxidative burst in a patient with COVID‐19. (a) Neutrophils (N) and monocytes (M) were gated on forward versus side scatter plot (b) neutrophil oxidative burst as DHR123 fluorescence (us: Unstimulated; PMA stimulated) (c) monocyte oxidative burst as DHR123 fluorescence (us: Unstimulated; PMA stimulated) [Color figure can be viewed at wileyonlinelibrary.com]
3.2.4. Apoptosis of monocytes and neutrophils
No difference has been found in the early and late apoptosis of monocytes and neutrophils between the patients with COVID‐19 and the controls (n = 13).
3.3. NK cells
As the bridging cells between innate and adaptive immune systems, the percentage and absolute numbers of NK cells (CD3−CD16+CD56+) were analyzed (Table 4, Figure 3a). No statistical difference was found among the percentages. In all groups, the absolute number of NK cells was found to be approximately 50% lower compared to the control group (187 ± 132 in the mild; 176 ± 140 cells/μl in the moderate; 178 ± 222 cells/μl in the severe group of patients versus 389 ± 296 cells/μl in controls, p = 0.024, Table 4).
TABLE 4.
Percentages and absolute numbers of the main lymphocyte subsets in various stages of patients with COVID‐19 and the controls
| COVID‐19 | |||||
|---|---|---|---|---|---|
| Mıld (n = 36) | Moderate (n = 42) | Severe (n = 25) | Healthy controls (n = 100) | p | |
| B cells (%) | 6 ± 5 | 6.7 ± 6.6 | 7 ± 6 | 10.8 ± 3.6* | *: p = 0.001 |
| CD19+ cells/μl | 94 ± 87 | 96 ± 246 | 60 ± 59 | 310 ± 242 | |
| (range in 95% CI) | (64–124) | (18–170) | (36–85) | (71–549)# | #: p = 0.016 |
| NK cells (%) | 13.4 ± 6.6 | 17.7 ± 11 | 18 ± 10 | 12.7 ± 9 | NS |
| CD3‐CD16+CD56+ cells/μl | 187 ± 132 | 176 ± 140 | 178 ± 222 | 389 ± 296 | |
| (range in 95% CI) | (142–232) | (131–220) | (86–269) | (98–680)* | *: p = 0.024 |
| T cells (%) | 74 ± 11*,* | 67 ± 15 | 60.7 ± 14.6* | 64.2 ± 12.8** | *,*: p = 0.002 |
| CD3+CD16‐CD56‐ cells/μl | 1186 ± 603 | 701 ± 531 | 551 ± 423 | 1835 ± 1209 | |
| (range in 95% CI) | (975–1396)# | (535–866)#,## | (376–726)#,### | (694–2976)##,### | #,##,###: p < 0.01 |
| T helper (%) | 42.5 ± 10 | 40.9 ± 14.2 | 35.9 ± 14.6 | 41.4 ± 11 | NS |
| CD3+CD4+ cells/μl | 714 ± 396 | 441 ± 364 | 329 ± 269 | 1203 ± 846 | |
| (range in 95% CI) | (576–852)* | (326–556)*,* | (219–440)*,** | (386–2020)**,** | *: p = 0.019, **,**: p < 0.01 |
| T cytotoxic (%) | 29.2 ± 11*,* | 24.1 ± 10 | 22.5 ± 11.5* | 22.9 ± 8** | *: p < 0.025, **: p < 0.01 |
| CD3+CD8+ cells/μl | 445 ± 247 | 243 ± 183 | 200 ± 201 | 550 ± 369 | |
| (range in 95% CI) | (359–531)* | (186–301)*,* | (117–283)*,** | (200–900)**,** | *,*,**: p < 0.01 |
Note: Comparisons were analyzed by ANOVA followed by Bonferroni test as post hoc. The results were given as mean values in 95% CI ± SD. One *or # indicates one significance, ** or ##: two different significance; *** or ### indicates the presence of three different significance asa result of post hoc test.
Abbreviation: NS, not significant.
FIGURE 3.
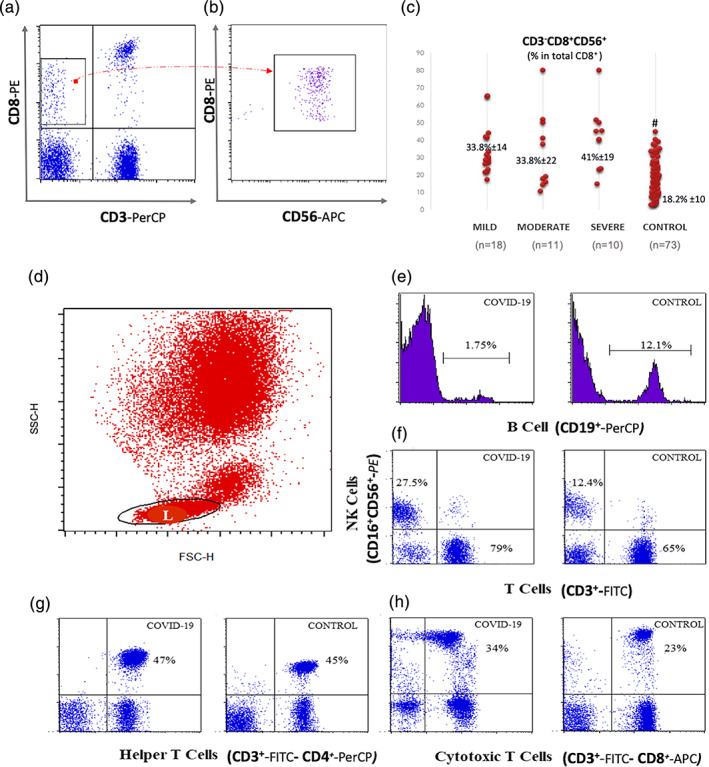
CD8+ NK cells and the main lymphocyte subsets in COVID‐19: (a) representative plots demonstrating NK (CD3−CD16+CD56+) and T (CD3+CD16−CD56−) cells in a COVID‐19 case and a control. (b) CD3−CD8+ cells were gated and when this gate was applied on CD8 versus CD56 plot, it was noticed that all CD3−CD8+ cells were CD56 positive. This group was thought to be as a subset of NK cells. (c) CD8+ NK cells: The percentage of CD8 was calculated as the percentage within CD3−CD56+ cells. This was significantly high in all COVID‐19 cases in comparison to control (*: p < 0.01). (d) Representative histograms for CD19+ B cells from a patient with COVID‐19 and a control. (e) Representative plots for T helper (CD3+CD4+) and (f) T cytotoxic/suppressor cells (CD3+CD8+) from a patient with COVID‐19 and a control. NK, natural killer [Color figure can be viewed at wileyonlinelibrary.com]
3.3.1. Increased CD8+ NK cell subset in COVID‐19
It was noticed that the CD3−CD8+ cell subset increased in COVID‐19 patients, and this subset was CD56+ as well (Figure 3b). Therefore, it was considered that killer NK cells may increase in COVID‐19. CD8 expression was then calculated on CD56 + CD3‐gated cells in all patient groups and controls to identify the CD8+ NK cell subset. This was 29.6% ±19 in the control group, 44% ± 17 in the mild; 37% ± 15 in the moderate, and 39% ± 23 in the severe group (p < 0.001 in comparison to control; Figure 3c). There was no difference between the groups. Thus, we demonstrated the increased CD8+ NK cells (CD3−CD8+CD56+) in patients with COVID‐19 (p < 0.001).
3.4. Phenotypic features of adaptive immune system cells in COVID‐19
A representative figure for flow cytometric evaluation of lymphocyte subsets is shown in Figure 3d–f. All percentages and the absolute numbers of lymphocyte subsets are given in Table 4.
3.4.1. The percentage and the absolute number of B lymphocytes were extremely low in all groups of COVID‐19 patients
Initially, the percentage of B lymphocytes was tested together with both CD19 and CD20 markers in 1/3 of the patients. No difference was observed, and the study was continued only with CD19. The percentage of B lymphocytes (CD19+) was lower in all the COVID‐19 patients compared to controls (6% ± 5 in the mild, 6.7% ± 6.6 in the moderate, 7% + ±6 in the severe group, and 10.8% ± 3.6 in the control group; p = 0.001, Figure 3d, Table 4). The absolute number of B lymphocytes was remarkably decreased in the patients with COVID‐19 (94 ± 87 cells/μl in the mild, 96 ± 246 cells/μl in the moderate, 60 ± 59 cells/μl in the severe groups of patients versus 310 ± 242 cells/μl, in the control group; p = 0.016, Table 4). In the severe group, the number of B lymphocytes decreased to approximately one‐fifth of the values in the control group. CD19 and CD138 were stained together in a few patients considering that the reason for extreme reduction may be the result of plasma cell differentiation. However, no CD138‐positive plasmablast was found in the periphery.
3.4.2. The absolute number of T cells gradually decreased according to the severity of the disease
A significant increase in the percentages of T cells (CD3+CD16−CD56−) was found in the mild group of patients with COVID‐19 (74% ± 11 in the mild, 67% ± 15 in the moderate, 60.7% ± 14.6 in the severe group vs. 64.2% ± 12.8 in the control group; p = 0.002, Table 4, Figure 3a). The absolute number of T cells was in the normal range only in the mild group (1186 ± 603 cells/μl), whereas this value was found to be decreased in both moderate (701 ± 531 cells/μl) and severe groups (551 ± 423 cells/μl) versus controls (1835 ± 1209 cells/μl; p < 0.01, Table 4).
3.4.3. No difference was found in the percentage of T helper cells, but their number sharply decreased in the moderate and severe groups
The percentage of CD3+CD4+ T cells of lymphocytes was not different among the groups (Table 4, Figure 3e). The absolute number of CD3+CD4+ T cells was significantly reduced in moderate and severe cases (714 ± 396 cells/μl in the mild, 441 ± 364 cells/μl in the moderate, 329 ± 269 cells/μl in the severe group vs. 1203 ± 846 cells/μl in the control group; p = 0.019; p < 0.01, respectively Table 4).
3.4.4. The number of T cytotoxic/suppressor cells decreased with the disease severity
The percentage of CD3 + CD8+ cytotoxic/suppressor T cells was found to be elevated in the mild group as compared to the patients in the severe group (29.2% ± 11 in the mild, 24.1% ± 10 in the moderate, 22.5% ± 11.5 in the severe group; p = 0.025) and the control group (22.9% ± 8; p < 0.01; Table 4, Figure 3f). The absolute number of CD3 + CD8+ T cells was decreased in the moderate and severe groups (445 ± 247 cells/μl in the mild, 243 ± 183 cells/μl in the moderate, 200 ± 201 cells/μl in the severe group vs. 550 ± 369 cells/μl in the control group; p < 0.01, Table 4).
No difference has been found in the ratio of CD4/CD8.
3.4.5. Activated CD4+ and CD8+ T cells in COVID‐19
CD69 expression on T lymphocytes without any stimulation demonstrated an increased baseline activation in COVID‐19. In the severe group, a significant increase has been found in the expression of CD69 on CD4+ in comparison to the mild group (9.4% ±6.8 and 3.7% ±4.9 respectively; p < 0.01; Figure 4a,b). The percentage of CD8+CD69+ T cells was significantly increased in the severe group (45% ±34.5) in comparison to the mild group (13.3% ±12.4; *: p = 0.01; Figure 4c,d).
FIGURE 4.
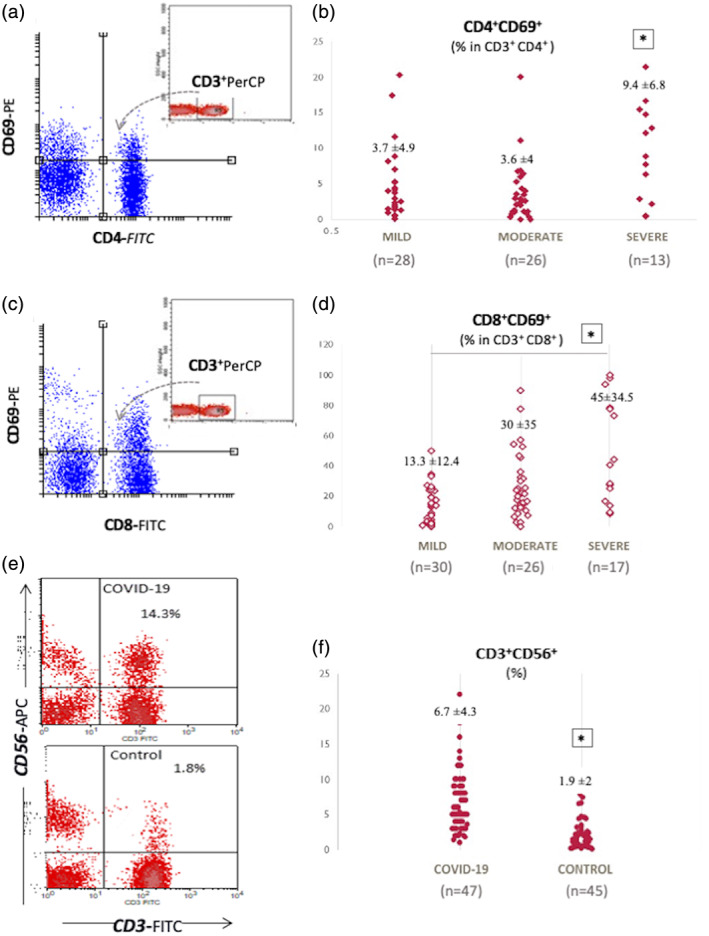
Expression of CD69 on CD4+ and CD8+ T cells and, increased CD56+ T cells in COVID‐19 (a and c) representative CD69 versus CD4 and CD8 graphs gated on CD3 plots demonstrating increased CD69 expression on T lymphocytes from a patient with a severe course of COVID‐19. The percentage of CD69 was calculated as the percentage within CD3+CD4+ and CD3+CD8+ gated cells (n = 67). (b) The percentage of CD69 on CD4+ T cells was significantly high in the severe patients (n = 13; 9.4% ±6.8) in comparison to the mild (n = 28; 3.7% ±4.9) and moderate patients (n = 26; 3.6% ±4; *: p < 0.01). (d) The percentage of CD8+CD69+ T cells was significantly increased in the severe group (n = 17; 45% ±34.5) compared to the mild group (n = 30; 13.3% ±12.4; *: p = 0.01). (e) Representative CD3 versus CD56 plots demonstrating increased CD56+ T cells from a patient with COVID‐19 versus a control. (f) The percentage of CD3+CD56+ T cells was significantly high in patients with COVID‐19. This was 6.7% ±4.3 in COVID‐19 cases (n = 47) whereas it was 1.9% ±2 in control cases (n = 45). *: p < 0.01 [Color figure can be viewed at wileyonlinelibrary.com]
3.4.6. An increase in CD56+ T cells (CD3+CD56+) in patients with COVID‐19
CD3+CD56+ T cells represent a group of T cells that are cytotoxic to tumors and pathogens (Gianchecchi et al., 2018; Meraviglia et al., 2011). The percentage of CD3+CD56+ population was found to be high in COVID‐19 patients as compared to controls (6.7% ±4.3 and 1.9% ±2, respectively; p < 0.01, Figure 4e,f).
3.4.7. Other lymphocyte subsets in COVID‐19
It has been suggested that CD3+CD4−CD8− double‐negative T cells are suppressive T cells (Voelkl et al., 2011). We have found a significant increase in the percentage of CD3+CD4−CD8− cell subset in both the moderate and severe groups (p < 0.01; Figure 5a–c). As an activation‐related suppression marker, HLA‐DR on T lymphocytes (CD3+ HLA‐DR+) was found to be elevated in all COVID‐19 patients (p < 0.01; Figure 5d–f). CD8+CD28− T cells are known as a subset of regulatory T cells (Liu et al., 2020). The percentage of CD8+CD28− T cells were found to be significantly increased in all the groups of COVID‐19 patients (p < 0.03; Figure 5g–i).
FIGURE 5.
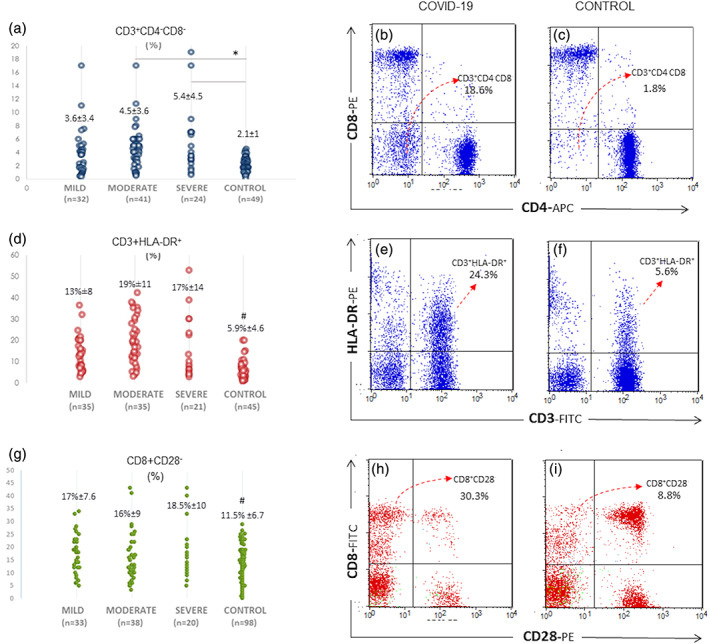
T lymphocyte subsets increased in patients with COVID‐19. (a) The ratio of double‐negative T cells (CD3+CD4−CD8−) was significantly increased in patients with COVID‐19 with moderate or severe courses in comparison to the control group (*: p < 0.01). (b) Representative CD4 versus CD8 plots gated on CD3+ T cells in a patient with COVID‐19 and (c) healthy control. The lower left quadrant indicates CD3+CD4−CD8− cells (d) #: p < 0.01: HLA‐DR expressing T cells were increased in patients with COVID‐19. (e and f) CD3 versus HLA‐DR plots from a patient with COVID‐19 and a control. (g) #: p < 0.03: The percentage of CD8+CD28− suppressive phenotype was prominent in COVID‐19 cases. (h and i) CD8 versus CD28 plots in a patient with COVID‐19 and a control. The upper left quadrant indicates CD28 negative CD8+ cells [Color figure can be viewed at wileyonlinelibrary.com]
3.4.8. Lymphocyte apoptosis in the periphery depends on the increased baseline activation of caspase‐3 in patients with COVID‐19
Special attention was focused on lymphocyte apoptosis. Lymphocyte early apoptosis ratio was high in patients with COVID‐19 (p = 0.02; Figure 6a). The percentages of lymphocyte late apoptosis and cell death were not different between the groups (Figure 6b). However, total cell death, calculated by summing late apoptotic cells and cell death was significantly high in Covid‐19 patients (42% ± 14.5 vs. 22.6% ± 12.3; p < 0.05; Figure 6a). The fold increase was calculated by dividing MFIs of PMA stimulated to the unstimulated samples for each case. COVID‐19 patients showed significantly lower fold increase than controls (2.3 ± 1.8 in COVID‐19, 6.7 ± 4.2 in controls; p < 0.01; Figure 6b). It was an intriguing question as to how they have significantly lower stimulation responses, while the percentage of early apoptosis was significantly higher. We compared initial activation levels in unstimulated samples from both the controls and patients with COVID‐19. We found that the initial fluorochrome conversion for caspase‐3 was significantly higher in patients that indicated increased baseline activation of caspase‐3 in COVID‐19 (17% ± 8 vs. 6.3% ± 4.6; p = 0.01; Figure 6c).
FIGURE 6.
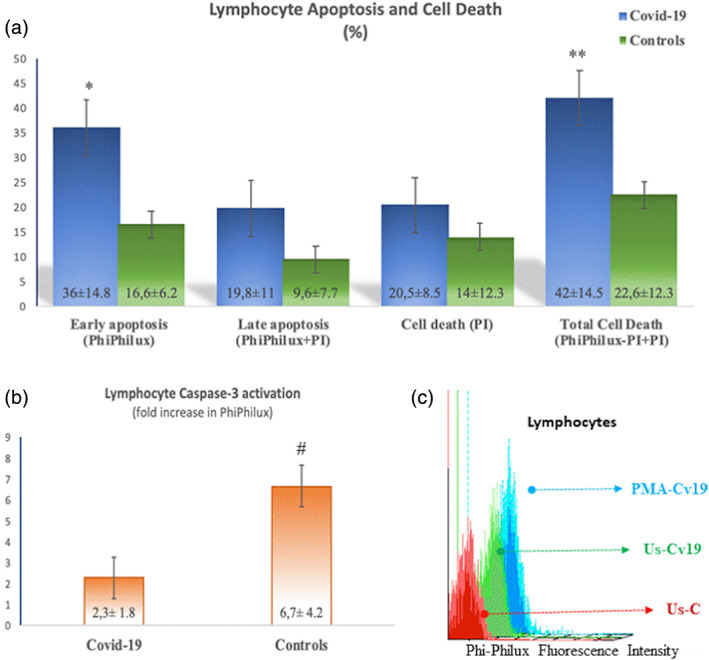
Lymphocyte early, late apoptosis, and cell death. (a) Early apoptosis measured by the percentage of Phiphilux fluorescence was high in patients with COVID‐19 (*: p = 0.02). Total cell death as a sum of Phiphilux and PI‐positive and PI‐only positive cells was elevated in patients with COVID‐19 in comparison to controls (**: p < 0.05). (b) Fold increase in PhiPhilux fluorescence as an indicator of caspase‐3 activation in lymphocytes was low in COVID‐19 patients (#: p < 0.01). (c) A representative histogram showing baseline caspase 3 activations (PhiPhilux fluorescence intensity) in lymphocytes from a healthy control (UsC: Unstimulated control), a COVID‐19 patient (UsCv19: Unstimulated Covid‐19), and same Covid‐19 patient following PMA stimulation (PMA‐Cv19) [Color figure can be viewed at wileyonlinelibrary.com]
4. DISCUSSION
In our study, we demonstrated that components of the innate immune system during COVID‐19 are well preserved. It has previously been shown to have reduced OB activity in patients with severe infections such as HIV and tuberculosis (Dobmeyer et al., 1995; Fiorenza et al., 2003; Zimmerman & Ringer, 1992). However, we found no defect in the ROS production and apoptosis in monocytes and neutrophils. There was a significant decrease in the absolute numbers of all lymphocyte subsets, particularly in B cell and CD4+ T cells, but also in NK and CD8+ T cells, which are associated with disease severity. CD8+ NK cell subset and CD56+ T cells and CD3+HLA‐DR+ and CD8+CD28− T cell subsets were increased in COVID‐19 patients. Moreover, increased lymphocyte apoptosis is demonstrated, which may be responsible for the development of lymphopenia (summarized in Figure 7).
FIGURE 7.
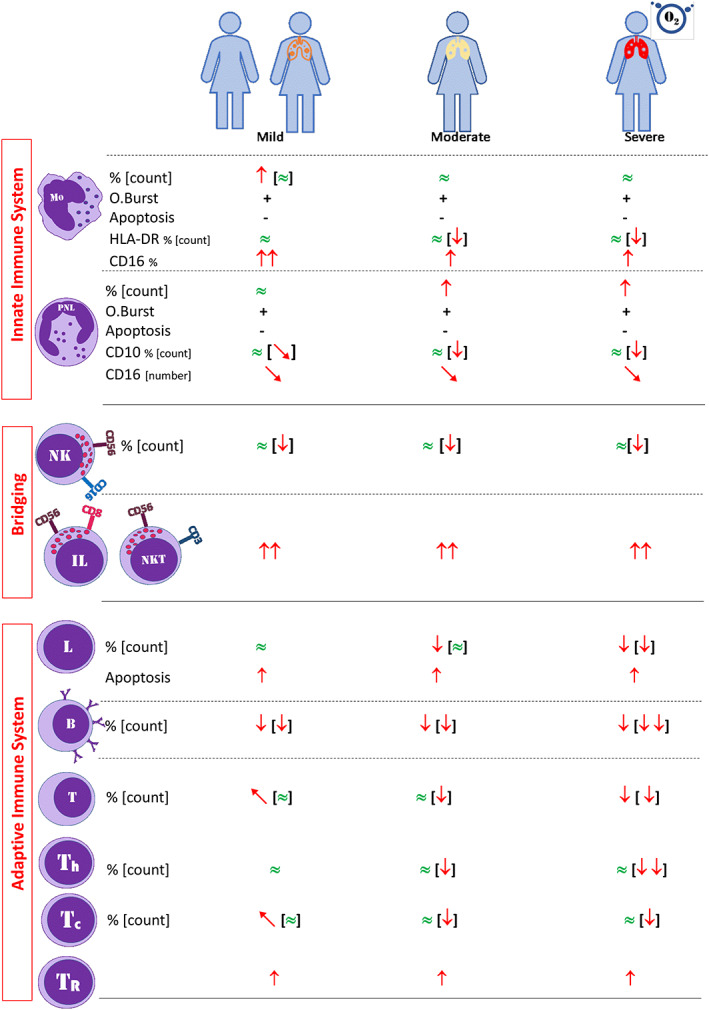
A graphical abstract of the study [Color figure can be viewed at wileyonlinelibrary.com]
The immune response is a complex process that includes first innate activation followed by adaptive activation, which in turn controls the innate system in order not to harm its own cells with sustained reactions. Therefore, a proper immune response against microorganisms depends on a fine‐tuned balance between innate and adaptive immune systems (Kim et al., 2007; Paul, 2013).
Constitutive expression of HLA‐DR on monocytes, which presents peptides to T cells, is a requirement for the communication between innate and adaptive systems. The decline of the expression of HLA‐DR on monocytes is generally accepted as a marker of immune paralysis (Monneret et al., 2006; Quadrini et al., 2021). We found a decreased expression of HLA‐DR on monocytes in all the clinical courses of COVID‐19 patients. The gradual decrease of HLA‐DR expression on monocytes in COVID‐19 can be considered as the gradual exhaustion of monocytes while the disease progresses. However, we did not have a diseased control group. A recent study showed that COVID‐19 patients exhibited a less pronounced decrease in HLA‐DR expression on monocytes in comparison to bacterial septic shock patients (Mehta et al., 2020). On the other hand, CD16+ monocytes are a well‐defined group known as non‐classical monocytes considered as pro‐inflammatory monocytes (Chimen et al., 2017). We demonstrated that more than 50% of monocytes were CD16+ in COVID‐19, especially in mild and moderate COVID 19 cases. This might be an indication of the active contribution of monocytes to inflammation. Paradoxically, this expression was found to be decreased in very severe cases. This might be a result of the cytokine storm in severe cases. In their study, Silvin et al. showed that CD14+ CD16+ non‐classical monocytes disappeared in COVID‐19 patients, which is a contradictive result to ours (Silvin et al., 2020). That contradiction might stem from the different test procedures used in the studies. We used freshly isolated cells in our study, while Silvin et al. used frozen–thawed cells. That process might cause the shedding of the aforementioned surface molecules from the monocytes.
Neutrophils have critical roles in acute inflammation. Mature neutrophils are CD10 and CD16 positive (Shipp et al., 1991). CD10+ neutrophils inhibit interferon‐γ release and help the proliferation of T lymphocytes (Marini et al., 2017). In our group of patients, CD10+CD16+ mature neutrophils were slightly decreased in the severe group. Consistent decline in CD16 and CD10 expression on the surface of neutrophils might be considered as an indicator of an increase in immature neutrophils and a left shift in severe cases of COVID‐19. Increased immature neutrophils in the severe group may be a result of increased neutrophil production, supporting no impairment in the myeloid series in COVID‐19.
We found a normal percentage of NK in contrast to the previous studies (Giamarellos‐Bourboulis et al., 2020; Qin et al., 2020). A decrease was observed in the number of NK cells, but this reduction was not as excessive as in B cells. Further studies on direct cytotoxicity or antibody‐mediated cytotoxicity of NK cells will help us to interpret this issue better. We identified a significant increase in CD8+ NK cell subset and CD56+ T cells (CD3+CD56+) in all the COVID‐19 patients. These subsets are known as potent cytotoxic and have a strong capacity to release IFN‐γ (Spits et al., 2016). We suggest that the decreased number of NK cells could be compensated by the increased number of cytotoxic cells.
We found that the absolute number of B lymphocytes was extremely reduced. A sufficient amount of immunoglobulin secretion from plasma cells in COVID‐19 with that reduced number of B lymphocytes may seem not to be expected. It has already been shown that there was no peripheral B cell memory in SARS during the 6 years of follow‐up (Tang et al., 2011; Yan et al., 2020). It has previously been demonstrated that plasmablasts were increased in the peripheral blood during the viral infection (Wrammert et al., 2012). However, we demonstrated that no plasmablast had been found in the periphery during the active infection. Hypothetically, the migration of B lymphocytes to the inflammation site might explain this excessive decrease of B lymphocytes. However, histopathological studies did not support this hypothesis, as they demonstrated the lack of lymphocytes in the lymph nodes and the spleen (Chen et al., 2020). Another possibility is that B lymphocytes may be one of the targets that are directly destroyed by SARS‐CoV‐2. The significant increase in the percentages of CD3+ and CD8+ T lymphocytes with their normal absolute numbers in the mild patients can be considered as a sign of a strong immune response at the beginning. In the mild group, while the absolute number of CD4+ T cells is still within normal limits, a decrease in both NK and B cell populations suggests that a careful phenotypic follow‐up can be used to predict disease progression. Furthermore, while the decrease in the absolute numbers of NK and B cells remained the same throughout the disease progression in all the patient groups, a sharper decrease in CD4 and CD8 T lymphocytes in the moderate and severe groups is noteworthy. The sharp decrease in the number of CD4+ T cells in the severe group almost approaches the decrease in B lymphocytes.
HLA‐DR expression on T lymphocytes has long been known to down‐regulate the activated T cells. CD8+CD28− T cells represent another group of regulatory T cells that inhibit CD4+ T cell proliferation (Liu et al., 2020). On the other hand, HLA‐DR on T cells has been used for a long time as one of the archetype markers on lymphocytes (along with CD38) to highlight T‐cell activation (Cotner et al., 1983). We found increased CD3+ HLA‐DR+, CD8+ CD28−, and CD3+CD4−CD8− T cell populations, especially in the moderate and severe groups. However, we could not demonstrate whether they have suppressive functions. These increases can be considered as an increase in regulatory T cell populations that down‐regulate the adaptive system in COVID‐19. However, functional assays are required for this issue. Another possibility is that the shift in these populations might be a result of the “over‐activation” of the immune system, which in the end could also lead to a form of immune paralysis.
Our finding concerning increased early apoptotic activation indicates that the virus leads to a process that initiates the caspase 3 activation in lymphocytes. Indeed, a recent study demonstrated that the ORF‐3a protein of SARS‐Cov‐2 induced apoptosis (Ren et al., 2020). We found that Caspase‐3 that was already active at the basal level, accelerates lymphocyte apoptosis in COVID‐19. This data can be interpreted as an indication that SARS‐Cov‐2 is destructive for peripheral lymphocytes. One of the causes of lymphopenia in COVID‐19 patients might be the elevated basal caspase‐3 activation in lymphocytes for an unknown reason.
In our study, we found significant differences in peripheral lymphocyte subgroups between COVID patients and healthy controls. We also described some associations of disease severity and peripheral subset analysis. However, when evaluating these findings, it should be kept in mind that historical control was used as the control group. Antibodies used for historical controls were purchased from the same company to use in the study samples. Both the historical control and patients' samples were tested with the same FACS instrument (FACSCalibur, Becton Dickinson Inc). Also, the same type of tube (EDTA tubes) was used in both the historical controls and our samples. For these reasons, we thought that the risk of variability and bias was minimized, and that historical control could be used with confidence. This is the main limitation of the study.
This study, in which we examine partially phenotypic and functional characteristics of innate and adaptive immune system cells, shows that the innate immune system functions are complete and competent; but the adaptive immune system is not adequate, which has a low number of half‐dead lymphocytes, to combat the viral infection in COVID‐19. We suggest that Sars‐Cov2 primarily targets lymphocytes, which then might impair the communication between innate‐adaptive immune systems. In this context, it will be very important to focus on additional functional studies related to apoptotic targets in explaining immune pathogenesis.
CONFLICT OF INTEREST
No conflict of interest exists for any of the authors.
AUTHOR CONTRIBUTIONS
Emel Ekşioğlu‐Demiralp has conceptualized and designed the study, performed part of the lab experiments, analyzed the data, wrote the manuscript, drafted the manuscript, revised the manuscript, and gave approval of the final version to be submitted. Servet Alan, Uluhan Sili, Dilek Bakan, İlhan Ocak, Nadir Alpay, and Serpil Görçin collected blood samples, collected clinical information, reviewed the manuscript, and gave approval of the final version to be submitted. Rayfe Yürekli performed lab experiments, analyzed the data, reviewed the manuscript, and gave approval of the final version to be submitted. Alaattin Yıldız contributed designation of the study, reviewed the manuscript, and gave approval of the final version to be submitted.
Supporting information
Appendix S1: Supporting information
ACKNOWLEDGMENTS
We acknowledge Dr. Semra Kayaoglu for the critical review of the manuscript. The study was funded in part personally by Dr. Ekşioğlu‐Demiralp, and in part by the Memorial Health Group. A special thanks to Berna Altun, DamlaKılıç, Gamze Ensar, and GözdeAkçin from Memorial Tissue Typing and Immunology Laboratory and MelekYıldız from Department of Infectious Disease for their valuable contributions to the lab works and collecting patient information.
Ekşioğlu‐Demiralp, E. , Alan, S. , Sili, U. , Bakan, D. , Ocak, İ. , Yürekli, R. , Alpay, N. , Görçin, S. , & Yıldız, A. (2022). Peripheral innate and adaptive immune cells during COVID‐19: Functional neutrophils, pro‐inflammatory monocytes, and half‐dead lymphocytes. Cytometry Part B: Clinical Cytometry, 102(2), 153–167. 10.1002/cyto.b.22042
REFERENCES
- Chen, Y. , Feng, Z. , Diao, B. , Wang, R. , Wang, G. , Wang, C. , Tan, Y., Liu, L., Wang, C., Liu, Y., Liu, Y., Yuan, Z., Ren, L., & Wu, Y. (2020). The novel severe acute respiratory syndrome coronavirus 2 (SARS‐CoV‐2) directly decimates human spleens and lymph nodes. medRxiv, 20045427. 10.1101/2020.03.27.20045427 [DOI] [Google Scholar]
- Chimen, M. , Yates, C. M. , McGettrick, H. M. , Ward, L. S. , Harrison, M. J. , Apta, B. , Dib, L. H. , Imof, B. A. , Harrison, P. , Nash, G. B. , & Rainger, G. E. (2017). Monocyte subsets coregulate inflammatory responses by integrated signaling through TNF and IL‐6 at the endothelial cell Interface. Journal of Immunology, 198(7), 2834–2843. [DOI] [PMC free article] [PubMed] [Google Scholar]
- Cotner, T. , Williams, J. M. , Christenson, L. , Shapiro, H. M. , Strom, T. B. , & Strominger, J. (1983). Simultaneous flow cytometric analysis of human T cell activation antigen expression and DNA content. The Journal of Experimental Medicine, 157(2), 461–472. [DOI] [PMC free article] [PubMed] [Google Scholar]
- Dobmeyer, T. S. , Raffel, B. , Dobmeyer, J. M. , Findhammer, S. , Klein, S. A. , Kabelitz, D. , Hoelzer, D. , Helm, E. B. , & Rossol, R. (1995). Decreased function of monocytes and granulocytes during HIV‐1 infection correlates with CD4 cell counts. European Journal of Medical Research, 1(1), 9–15. [PubMed] [Google Scholar]
- Fiorenza, G. , Bottasso, O. A. , Rateni, L. , Farroni, M. A. , & Dlugovitzky, D. (2003). Impaired neutrophil function in patients with pulmonary tuberculosis and its normalization in those undergoing specific treatment, except the HIV‐coinfected cases. FEMS Immunology and Medical Microbiology, 35(2), 159–164. [DOI] [PubMed] [Google Scholar]
- Giamarellos‐Bourboulis, E. J. , Netea, M. G. , Rovina, N. , Akinosoglou, K. , Antoniadou, A. , Antonakos, N. , Damoraki, G. , Gkavogianni, T. , Adami, M. E. , Katsaounou, P. , Ntaganou, M. , Kyriakopoulou, M. , Dimopoulos, G. , Koutsodimitropoulos, I. , Velissaris, D. , Koufargyris, P. , Karageorgos, A. , Katrini, K. , Lekakis, V. , … Koutsoukou, A. (2020). Complex immune dysregulation in COVID‐19 patients with severe respiratory failure. Cell Host & Microbe, 27(6), 992–1000. [DOI] [PMC free article] [PubMed] [Google Scholar]
- Gianchecchi, E. , Delfino, D. V. , & Fierabracci, A. (2018). NK cells in autoimmune diseases: Linking innate and adaptive immune responses. Autoimmunity Reviews, 17(2), 142–154. [DOI] [PubMed] [Google Scholar]
- Coronavirus disease 2019 (COVID‐19) situation report – 130. 2020. https://www.who.int/docs/default‐source/coronaviruse/situation‐reports/20200529‐covid‐19‐sitrep‐130.pdf?sfvrsn=bf7e7f0c_4.
- Kim, K. D. , Zhao, J. , Auh, S. , Yang, X. , Du, P. , Tang, H. , et al. (2007). Adaptive immune cells temper initial innate responses. Nature Medicine, 13(10), 1248–1252. [DOI] [PMC free article] [PubMed] [Google Scholar]
- Li, S. , Jiang, L. , Li, X. , Lin, F. , Wang, Y. , Li, B. , Jiang, T. , An, W. , Liu, S. , Liu, H. , Xu, P. , Zhao, L. , Zhang, L. , Mu, J. , Wang, H. , Kang, J. , Li, Y. , Huang, L. , Zhu, C. , … Zhao, J. (2020). Clinical and pathological investigation of severe COVID‐19 patients. JCI Insight, 5(12), e138070. [DOI] [PMC free article] [PubMed] [Google Scholar]
- Li, X. , Guan, B. , Su, T. , Liu, W. , Chen, M. , Bin Waleed, K. , Guan, X. , Gary, T. , & Zhu, Z. (2020). Impact of cardiovascular disease and cardiac injury on in‐hospital mortality in patients with COVID‐19: A systematic review and meta‐analysis. Heart, 106(15), 1142–1147. [DOI] [PMC free article] [PubMed] [Google Scholar]
- Liu, G. , Yu, Y. , Feng, F. , Zhu, P. , Zhang, H. , Zhang, D. , Feng, X. , Zhang, Z. , & Liu, Y. (2020). Human CD8. BMC Immunology, 21(1), 23. [DOI] [PMC free article] [PubMed] [Google Scholar]
- Lu, R. , Zhao, X. , Li, J. , Niu, P. , Yang, B. , Wu, H. , Wang, W. , Song, H. , Huang, B. , Zhu, N. , Bi, Y. , Ma, X. , Zhan, F. , Wang, L. , Hu, T. , Zhou, H. , Hu, Z. , Zhou, W. , Zhao, L. , … Tan, W. (2020). Genomic characterisation and epidemiology of 2019 novel coronavirus: Implications for virus origins and receptor binding. Lancet, 395(10224), 565–574. [DOI] [PMC free article] [PubMed] [Google Scholar]
- Marini, O. , Costa, S. , Bevilacqua, D. , Calzetti, F. , Tamassia, N. , Spina, C. , de Sabata, D. , Tinazzi, E. , Lunardi, C. , Scupoli, M. T. , Cavallini, C. , Zoratti, E. , Tinazzi, I. , Marchetta, A. , Vassanelli, A. , Cantini, M. , Gandini, G. , Ruzzenente, A. , Guglielmi, A. , … Scapini, P. (2017). Mature CD10. Blood, 129(10), 1343–1356. [DOI] [PubMed] [Google Scholar]
- Mehta, P. , McAuley, D. F. , Brown, M. , Sanchez, E. , Tattersall, R. S. , Manson, J. J. , & HLH Across Speciality Collaboration, UK . (2020). COVID‐19: Consider cytokine storm syndromes and immunosuppression. Lancet, 395(10229), 1033–1034. [DOI] [PMC free article] [PubMed] [Google Scholar]
- Meraviglia, S. , El Daker, S. , Dieli, F. , Martini, F. , & Martino, A. (2011). γδ T cells cross‐link innate and adaptive immunity in mycobacterium tuberculosis infection. Clinical & Developmental Immunology, 2011, 587315. [DOI] [PMC free article] [PubMed] [Google Scholar]
- Modrow, S. , Falke, D. , Truyen, U. , & Schätzl, H. (2013). Viruses with single‐stranded, positive‐sense RNA genomes. In Molecular Virology (pp. 185–349). Springer‐Verlag. [Google Scholar]
- Monneret, G. , Lepape, A. , Voirin, N. , Bohé, J. , Venet, F. , Debard, A. L. , Thizy, H. , Bienvenu, J. , Gueyffier, F. , & Vanhems, P. (2006). Persisting low monocyte human leukocyte antigen‐DR expression predicts mortality in septic shock. Intensive Care Medicine, 32(8), 1175–1183. [DOI] [PubMed] [Google Scholar]
- Palasca, O. , Santos, A. , Stolte, C. , Gorodkin, J. , & Jensen, L. J. (2018). TISSUES 2.0: An integrative web resource on mammalian tissue expression. Database: The Journal of Biological Databases and Curation, 2018, bay003. 10.1093/database/bay003 [DOI] [PMC free article] [PubMed] [Google Scholar]
- Park, A. , & Iwasaki, A. (2020). Type I and type III Interferons ‐ induction, signaling, evasion, and application to combat COVID‐19. Cell Host & Microbe, 27(6), 870–878. [DOI] [PMC free article] [PubMed] [Google Scholar]
- Paul, W. E. (2013). Fundamental immunology (Vol. xviii, 7th ed., p. 1283). Wolters Kluwer Health/Lippincott Williams & Wilkins. [Google Scholar]
- Qin, C. , Zhou, L. , Hu, Z. , Zhang, S. , Yang, S. , Tao, Y. , Xie, C. , Ma, K. , Shang, K. , Wang, W. , & Tian, D. S. (2020). Dysregulation of immune response in patients with COVID‐19 in Wuhan China. Clinical Infectious Diseases, 71(15), 762–768. [DOI] [PMC free article] [PubMed] [Google Scholar]
- Quadrini, K. J. , Patti‐Diaz, L. , Maghsoudlou, J. , Cuomo, J. , Hedrick, M. N. , & McCloskey, T. W. (2021). A flow cytometric assay for HLA‐DR expression on monocytes validated as a biomarker for enrollment in sepsis clinical trials. Cytometry. Part B, Clinical Cytometry, 100(1), 103–114. [DOI] [PubMed] [Google Scholar]
- Ren, Y. , Shu, T. , Wu, D. , Mu, J. , Wang, C. , Huang, M. , Han, Y. , Zhang, X. Y. , Zhou, W. , Qiu, Y. , & Zhou, X. (2020). The ORF3a protein of SARS‐CoV‐2 induces apoptosis in cells. Cellular & Molecular Immunology, 17(8), 881–883. [DOI] [PMC free article] [PubMed] [Google Scholar]
- Saksena, S. , & Chattopadhyay, P. (2021). Illuminating the immunopathology of SARS‐CoV‐2. Cytometry. Part B, Clinical Cytometry, 100(1), 33–41. 10.1002/cyto.b.21988 [DOI] [PubMed] [Google Scholar]
- Shang, J. , Ye, G. , Shi, K. , Wan, Y. , Luo, C. , Aihara, H. , Geng, Q. , Auerbach, A. , & Li, F. (2020). Structural basis of receptor recognition by SARS‐CoV‐2. Nature, 581(7807), 221–224. [DOI] [PMC free article] [PubMed] [Google Scholar]
- Shipp, M. A. , Stefano, G. B. , Switzer, S. N. , Griffin, J. D. , & Reinherz, E. L. (1991). CD10 (CALLA)/neutral endopeptidase 24.11 modulates inflammatory peptide‐induced changes in neutrophil morphology, migration, and adhesion proteins and is itself regulated by neutrophil activation. Blood, 78(7), 1834–1841. [PubMed] [Google Scholar]
- Silvin, A. , Chapuis, N. , Dunsmore, G. , Goubet, A. G. , Dubuisson, A. , Derosa, L. , Almire, C. , Hénon, C. , Kosmider, O. , Droin, N. , Rameau, P. , Catelain, C. , Alfaro, A. , Dussiau, C. , Friedrich, C. , Sourdeau, E. , Marin, N. , Szwebel, T. A. , Cantin, D. , … Solary, E. (2020). Elevated calprotectin and abnormal myeloid cell subsets discriminate severe from mild COVID‐19. Cell, 182(6), 1401–1418.e18. [DOI] [PMC free article] [PubMed] [Google Scholar]
- Spits, H. , Bernink, J. H. , & Lanier, L. (2016). NK cells and type 1 innate lymphoid cells: Partners in host defense. Nature Immunology, 17(7), 758–764. [DOI] [PubMed] [Google Scholar]
- Tan, Y. X. , Tan, T. H. , Lee, M. J. , Tham, P. Y. , Gunalan, V. , Druce, J. , Birch, C. , Catton, M. , Fu, N. Y. , Yu, V. C. , & Tan, Y. J. (2007). Induction of apoptosis by the severe acute respiratory syndrome coronavirus 7a protein is dependent on its interaction with the Bcl‐XL protein. Journal of Virology, 81(12), 6346–6355. [DOI] [PMC free article] [PubMed] [Google Scholar]
- Tang, F. , Quan, Y. , Xin, Z. T. , Wrammert, J. , Ma, M. J. , Lv, H. , Wang, T. B. , Yang, H. , Richardus, J. H. , Liu, W. , & Cao, W. C. (2011). Lack of peripheral memory B cell responses in recovered patients with severe acute respiratory syndrome: A six‐year follow‐up study. Journal of Immunology, 186(12), 7264–7268. [DOI] [PubMed] [Google Scholar]
- Targher, G. , Mantovani, A. , Wang, X. B. , Yan, H. D. , Sun, Q. F. , Pan, K. H. , Byrne, C. D. , Zheng, K. I. , Chen, Y. P. , Eslam, M. , George, J. , & Zheng, M. H. (2020). Patients with diabetes are at higher risk for severe illness from COVID‐19. Diabetes & Metabolism, 46(4), 335–337. [DOI] [PMC free article] [PubMed] [Google Scholar]
- Ulhaq, Z. S. , & Soraya, G. V. (2020). Interleukin‐6 as a potential biomarker of COVID‐19 progression. Médecine et Maladies Infectieuses, 50(4), 382–383. [DOI] [PMC free article] [PubMed] [Google Scholar]
- Voelkl, S. , Gary, R. , & Mackensen, A. (2011). Characterization of the immunoregulatory function of human TCR‐αβ+ CD4‐ CD8‐ double‐negative T cells. European Journal of Immunology, 41(3), 739–748. [DOI] [PubMed] [Google Scholar]
- Wang, F. , Hou, H. , Luo, Y. , Tang, G. , Wu, S. , Huang, M. , Liu, W. , Zhu, Y. , Lin, Q. , Mao, L. , Fang, M. , Zhang, H. , & Sun, Z. (2020). The laboratory tests and host immunity of COVID‐19 patients with different severity of illness. JCI Insight, 5(10), e137799. [DOI] [PMC free article] [PubMed] [Google Scholar]
- Wang, Q. , Zhang, Y. , Wu, L. , Niu, S. , Song, C. , Zhang, Z. , Lu, G. , Qiao, C. , Hu, Y. , Yuen, K. Y. , Wang, Q. , Zhou, H. , Yan, J. , & Qi, J. (2020). Structural and functional basis of SARS‐CoV‐2 entry by using human ACE2. Cell, 181(4), 894–904.e9. [DOI] [PMC free article] [PubMed] [Google Scholar]
- Wrammert, J. , Onlamoon, N. , Akondy, R. S. , Perng, G. C. , Polsrila, K. , Chandele, A. , Kwissa, M. , Pulendran, B. , Wilson, P. C. , Wittawatmongkol, O. , Yoksan, S. , Angkasekwinai, N. , Pattanapanyasat, K. , Chokephaibulkit, K. , & Ahmed, R. (2012). Rapid and massive virus‐specific plasmablast responses during acute dengue virus infection in humans. Journal of Virology, 86(6), 2911–2918. [DOI] [PMC free article] [PubMed] [Google Scholar]
- Wu, Z. , & McGoogan, J. M. (2020). Characteristics of and important lessons from the coronavirus disease 2019 (COVID‐19) outbreak in China: Summary of a report of 72 314 cases from the Chinese Center for Disease Control and Prevention. JAMA, 323(13), 1239–1242. [DOI] [PubMed] [Google Scholar]
- Xydakis, M. S. , Dehgani‐Mobaraki, P. , Holbrook, E. H. , Geisthoff, U. W. , Bauer, C. , Hautefort, C. , Herman, P. , Manley, G. T. , Lyon, D. M. , & Hopkins, C. (2020). Smell and taste dysfunction in patients with COVID‐19. The Lancet Infectious Diseases, 20(9), 1015–1016. [DOI] [PMC free article] [PubMed] [Google Scholar]
- Yan, X. , Li, F. , Wang, X. , Yan, J. , Zhu, F. , Tang, S. , Deng, Y. , Wang, H. , Chen, R. , Yu, Z. , Li, Y. , Shang, J. , Zeng, L. , Zhao, J. , Guan, C. , Liu, Q. , Chen, H. , Gong, W. , Huang, X. , … Li, D. (2020). Neutrophil to lymphocyte ratio as prognostic and predictive factor in patients with coronavirus disease 2019: A retrospective cross‐sectional study. Journal of Medical Virology, 92(11), 2573–2581. [DOI] [PMC free article] [PubMed] [Google Scholar]
- Yao, X. H. , Li, T. Y. , He, Z. C. , Ping, Y. F. , Liu, H. W. , Yu, S. C. , Mou, H. M. , Wang, L. H. , Zhang, H. R. , Fu, W. J. , Luo, T. , Liu, F. , Guo, Q. N. , Chen, C. , Xiao, H. L. , Guo, H. T. , Lin, S. , Xiang, D. F. , Shi, Y. , … Bian, X. W. (2020). A pathological report of three COVID‐19 cases by minimal invasive autopsies. Zhonghua Bing Li Xue Za Zhi, 49(5), 411–417. [DOI] [PubMed] [Google Scholar]
- Zimmerman, J. J. , & Ringer, T. V. (1992). Inflammatory host responses in sepsis. Critical Care Clinics, 8(1), 163–189. [PubMed] [Google Scholar]
Associated Data
This section collects any data citations, data availability statements, or supplementary materials included in this article.
Supplementary Materials
Appendix S1: Supporting information