

Abstract
Ageing is a complex process with common and distinct features across tissues. Unveiling the underlying processes driving ageing in individual tissues is indispensable to decipher the mechanisms of organismal longevity. Caenorhabditis elegans is a well‐established model organism that has spearheaded ageing research with the discovery of numerous genetic pathways controlling its lifespan. However, it remains challenging to dissect the ageing of worm tissues due to the limited description of tissue pathology and access to tissue‐specific molecular changes during ageing. In this study, we isolated cells from five major tissues in young and old worms and profiled the age‐induced transcriptomic changes within these tissues. We observed a striking diversity of ageing across tissues and identified different sets of longevity regulators therein. In addition, we found novel tissue‐specific factors, including irx‐1 and myrf‐2, which control the integrity of the intestinal barrier and sarcomere structure during ageing respectively. This study demonstrates the complexity of ageing across worm tissues and highlights the power of tissue‐specific transcriptomic profiling during ageing, which can serve as a resource to the field.
Keywords: ageing, Caenorhabditis elegans, tissue, transcription factor, transcriptomic change
Subject Categories: Chromatin, Transcription & Genomics; Methods & Resources
Expression profiling of worm ageing uncovers common and organ‐specific molecular pathways involved in health deterioration.

Introduction
Ageing causes a systematic decline in physiological functions across tissues of the body and therefore poses the main risk for various severe diseases in the aged population (Campisi et al, 2019). Over the past decades, the mechanisms underlying ageing and the cellular systems that protect the organism have been substantially charted by pioneering studies in model organisms (Kenyon, 2010; Riera et al, 2016; Campisi et al, 2019). The nematode Caenorhabditis elegans is among the foremost models in ageing research, with a short lifespan of only a few weeks, but displaying similar ageing phenotypes and causes as humans (Mack et al, 2018). It was first shown in C. elegans that longevity is regulated by evolutionarily conserved signalling with the identification of the insulin/IGF‐1 signalling (IIS) pathway (Johnson, 1990; Kenyon et al, 1993; Morris et al, 1996; Ogg et al, 1997; Kenyon, 2011). Mutations in critical IIS genes, such as FOXO3A, were later found to be associated with human longevity (Willcox et al, 2008). Since then, studies with C. elegans have also pioneered numerous other milestone findings in the biology of ageing (Kenyon, 2010; Mack et al, 2018; Campisi et al, 2019).
Ageing or longevity interventions induce evident transcriptomic changes in C. elegans and other organisms (Lund et al, 2002; McElwee et al, 2003; Murphy et al, 2003; Hou et al, 2016; Li et al, 2019). These changes are proposed to represent the molecular causes underlying longevity (Murphy et al, 2003). The transcriptional information in previous C. elegans ageing studies was mainly from whole animals of different ages or longevity mutants due to the technical difficulty of dissecting the tissues of interest from the tiny worm (Corsi et al, 2015). These datasets have provided key information and insights into ageing to researchers using C. elegans as well as other model organisms.
Nevertheless, ageing cannot be solely analysed at the level of whole animal, since each tissue has its characteristic ageing trajectory, driven by common and unique ageing processes (Rando & Wyss‐Coray, 2021). In addition, tissue–tissue communication also plays an essential role at the systemic level, but how this occurs and the relationship among such tissues remain elusive. In order to decipher autonomous and non‐autonomous ageing mechanisms in multicellular organisms, it is critical to profile tissue‐specific transcriptomic changes during ageing. Yet, the lack of age‐related transcriptomic information in the worm tissues poses a significant gap in our understanding.
By improving the protocol to isolate embryonic worm neurons by fluorescence‐activated cell sorting (FACS) (Von Stetina et al, 2007), the Murphy lab isolated GFP‐labelled cells, enabling transcriptomic profiling in adult tissues (Kaletsky et al, 2016, 2018). Following their technique, we further developed a method to isolate cells from body wall muscle by micromanipulation (Zhou et al, 2019). In the current study, we isolated cells from five key somatic tissues (i.e. neuron, intestine, body wall muscle, hypodermis and coelomocytes) from worms at different ages and thereby profiled tissue‐specific transcriptomic changes during worm ageing. From the perspective of differentially expressed genes, the biological pathways and the underlying regulators, our results indicate remarkable diversity and complexity of ageing across tissues. The various transcriptomic changes not only arise from tissue characteristic structures and functions but also from different regulations of the same biological processes across tissues. Following the atlas of transcriptomic changes among ageing tissues, we further identified two transcription factors, irx‐1 controlling the integrity of the intestine wall and myrf‐2 driving the deterioration of sarcomere. These datasets provide a foundation to further explore the tissue‐specific and systemic machinery of ageing.
Results
Sequencing of major somatic tissues in young and aged C. elegans
To profile the transcriptomes in various somatic tissues, worms labelled with tissue‐specific fluorescent markers were dissociated. The cells in intestine, body wall muscle (BWM), hypodermis and coelomocyte are of similar identities and were hand‐picked by micromanipulation (Zhou et al, 2019). Neurons are composed of distinct classes and were collected by FACS (Kaletsky et al, 2016). The worms at day 1 of adulthood (D1) were considered as young, whereas the post‐reproductive worms at day 8 of adulthood (D8) as aged. The isolated cells from both young and aged worms were subjected to Smart‐seq2 for the tissue‐specific transcriptomic changes with ageing (Picelli et al, 2013) (Fig 1A). Cell viability was validated by fluorescent indicators (Zhang et al, 2011) (Fig EV1A). A battery of tissue‐specific genes was examined by qRT–PCR to assess the purity of the analysed samples (Fig EV1B). In each type of manually picked cells from intestine, BWM, hypodermis and coelomocytes, the expression of corresponding tissue‐specific genes was detected, but not the genes expressed in other tissues (Fig EV1C–F), indicating that the isolated cells were largely devoid of contamination. With a similar purity to previous reports (Kaletsky et al, 2016, 2018), the FACS‐isolated neuron samples were highly enriched of neurons and devoid of other tissues (Fig EV1G).
Figure 1. Worm tissues undergo remarkable transcriptomic changes during ageing.

-
AThe flowchart depicting the transcriptomic profiling of isolated worm tissues. Isolated cells from each tissue were pooled for Smart‐seq2.
-
B, CPrincipal component analysis (B) and hierarchical clustering (C) of the transcriptomic datasets of different tissues from young and aged worms in three biological replicates. D1: day 1 of adulthood, D8: day 8 of adulthood. Neu: neuron, Int: intestine, BWM: body wall muscle, Hyp: hypodermis, Coel: coelomocyte.
-
DThe volcano plots showing the differentially expressed genes in ageing tissues. Genes with a fold change > 1.5 and a P‐value smaller than 0.05 were considered significantly changed by ageing. The numbers and percentages of Age‐DEGs in expressed genes are shown in the corresponding plots.
Figure EV1. The validation of isolated tissues for transcriptomic profiling.

-
ACell viability assay of isolated worm cells. Cells from neurons, intestine, body wall muscle and hypodermis were labelled with tissue‐specific GFP reporters. Dead cells in their preparations (RFP) were labelled by ethidium homodimer‐1 staining (RFP). In the preparation of coelomocytes, coelomocytes and live cells were labelled with RFP and Calcein AM (GFP) respectively. Arrow heads denote the cells of interest. Scale bar: 20 µm.
-
BThe list of tissue‐specific genes used.
-
C–FRT–qPCR of indicated tissue‐specific genes in the isolated intestine (C), body wall muscle (D), hypodermis (E) and coelomocytes (F). ND: Ct > 40. Mean ± SD. n = 3 biological replicates.
-
GRT–qPCR (left) or RNA‐Seq reads (right) of tissue‐specific genes indicate that the isolated neurons are of comparable purity as previously reported. ND: Ct > 40. D1: day 1 of adulthood. D8: day 8 of adulthood. Mean ± SD. n = 3 biological replicates. Unpaired t‐test, two‐tailed.
As expected, each tissue underwent significant and different transcriptomic changes during ageing (Figs 1B–D and EV2A). Principal component analysis and hierarchical clustering showed that the sequenced samples were clustered first by their tissue types and then by their ages (Fig 1B and C), highlighting the distinctive transcriptomes among worm tissues as reported (Kaletsky et al, 2018) and the remarkable effects of ageing on gene expression. When compared to their D1 counterparts, 3,744, 2,246, 1,189, 902 and 1,056 genes were differentially expressed in the D8 neurons, intestine, BWM, hypodermis and coelomocytes respectively (Fig 1D and Dataset EV1). These ageing‐regulated differentially expressed genes (Age‐DEGs) comprise 21.5, 18.4, 7.4, 11.5 and 7.7% of the expressed genes in these tissues (Fig 1D) respectively. 50.1% of Age‐DEGs have orthologs in mammals (Fig EV2B and Dataset EV1), further indicating that worms share similar ageing mechanisms with humans (Kenyon, 2010; Campisi et al, 2019).
Figure EV2. Ageing induces significant transcriptomic changes across C. elegans tissues.

- A heatmap depicting the transcriptomic changes in the indicated tissues during ageing.
- Age‐DEGs in worm tissues are highly conserved.
- A comparison of Age‐DEGs in the indicated tissues.
Different tissues exhibit distinct transcriptomic changes during ageing
Worm tissues have distinct structures and functions that deteriorate with ageing. To explore whether their ageing‐induced transcriptomic changes are also different from each other, we first compared Age‐DEGs from each tissue with those from the whole worm at D1 and D7. Only a small fraction of the Age‐DEGs in the tested tissues was also altered at the worm level during ageing (Figs 2A and B and EV3C). A comparison with a reported dataset from worms at D2 and D8 showed similar results (Hou et al, 2016) (Fig EV3A, B and D). Therefore, each tissue could have its transcriptional signature during ageing.
Figure 2. The ageing‐induced transcriptomic changes are highly variable across tissues.

-
A, BThe overlap of upregulated (A) and downregulated (B) ageing‐regulated differentially expressed genes (Age‐DEGs) in the worm and the analysed tissues. The number and ratio of Age‐DEGs are shown in the corresponding Venn diagrams. Hypergeometric test.
-
CThe overlap of Age‐DEGs among tissues.
-
DThe number of common upregulated (left) and downregulated (right) Age‐DEGs drops with the increase in analysed tissues. The X‐axis denotes the numbers of analysed tissues.
Figure EV3. Age‐DEGs in the whole worm have a limited overlap with those in individual tissues.

-
A, BThe overlap of upregulated (A) and downregulated (B) Age‐DEGs in the worm and the analysed tissues. The Age‐DEGs in the worm are from a previous report by Hou et al (2016), by comparing the transcriptomes of WT worms at day 2 and day 8 of adulthood. The number and ratio of Age‐DEGs are shown in the corresponding Venn diagrams. Hypergeometric test.
-
C, DThe comparison of Age‐DEGs in the indicated samples. (C): The analysis using the worm RNA‐Seq data obtained in this study (Worm). (D): The analysis using the reported worm RNA‐Seq data by Hou et al (2016). (Worm (H)). Red lines denote the common Age‐DEGs between the whole worm and individual tissues.
To pursue this hypothesis, we further compared the Age‐DEGs among the five tissues. As speculated, each tissue showed a substantial fraction of unique Age‐DEGs (Figs EV2C and EV3C and D). 82.8, 72.7, 61.7, 65.7 and 74.1% of the upregulated Age‐DEGs in neuron, intestine, BWM, hypodermis and coelomocyte were specific in corresponding tissues (Figs 2C and EV2C). The ratios of tissue‐specific downregulated Age‐DEGs were 74.1, 69.3, 67.2, 59.3 and 57.6%, respectively, in neuron, intestine, BWM, hypodermis and coelomocyte (Figs 2C and EV2C). The expression patterns of these tissue‐specific Age‐DEGs are not necessarily restricted to the corresponding tissues because most genes were found to express across tissues (Appendix Fig S1A–F). Therefore, ageing could regulate the same genes differently among various tissues. Following the high tissue specificities of Age‐DEGs, the common Age‐DEGs among tissues were limited (Fig 2C and D). The number of common Age‐DEGs exhibited a remarkable decrease with the increase in analysed tissues (Fig 2D). We surprisingly found that there were no upregulated Age‐DEGs shared by all five tissues, whereas there were only three common downregulated Age‐DEGs in these tissues (Fig 2C and D, Dataset EV1). Therefore, ageing is unlikely to alter a common core group of genes across various tissues. Taken together, these results indicate high tissue specificity in the ageing‐induced transcriptomic changes.
The transcriptomic changes portray the ageing processes among tissues
Following Age‐DEGs, we next used WormCat, a powerful tool for analysing and comparing multiple C. elegans gene datasets, to examine the functional changes in ageing worm tissues (Holdorf et al, 2020). WormCat categorises a gene first by its physiological function (Category 1) and then by molecular function or cellular location (Categories 2 and 3) (Holdorf et al, 2020). By Category 1, many of the ageing‐regulated biological processes (Age‐BPs) were shared among multiple examined tissues and the whole worm. 74.2% upregulated and 73.9% downregulated Age‐BPs were identified in at least two tissues (Fig 3A and B, and Dataset EV2). Among them are some well‐known ageing hallmarks, such as stress response and metabolism (Lopez‐Otin et al, 2013). Interestingly, many of these Age‐BPs were both up‐ and downregulated during ageing, implying a complex impact of ageing.
Figure 3. The enriched gene sets in the transcriptomes of ageing worms and worm tissues.

-
A, BThe enriched gene sets from upregulated (A) and downregulated (B) Age‐DEGs analysed by WormCat. Categories 1 and 2 are differentiated by capitalisation and bold fonts. Category 2 are shown below the corresponding Category 1. The numbers of tissues enriched with indicated WormCat Category 1 are shown in the cyan blocks.
When examined in more detailed Categories 2 and 3, different facets of these general biological functions were shown to change differently during ageing (Fig 3 and Dataset EV2). As Age‐DEGs exhibit high tissue specificities (Fig 2), each tissue consistently showed distinct sets of Age‐BPs at Categories 2 and 3. At Category 2, 62.0 and 58.2% of up‐ and downregulated Age‐BPs, respectively, were detected in only one tissue, whereas the corresponding ratios of tissue‐specific Age‐BPs at Category 3 were, respectively, 71.9 and 64.6% (Dataset EV2). Gene ontology (GO) analysis also showed that Age‐DEGs in each tissue were enriched in characteristic sets of biological processes, cellular components and molecular functions (Appendix Fig S2 and Datasets [Link], [Link], [Link]). Some of these tissue‐specific Age‐BPs correspond to the featured tissue functions. For example, neurotransmitter receptor was specifically downregulated in neurons (Fig 3 and Dataset EV2). Others belonged to more general biological processes, such as the specific regulation of mRNA methylation in the intestine (Fig 3 and Dataset EV2).
Nevertheless, tissue ageing is more similar from the perspective of Age‐BPs than of Age‐DEGs. 15.2% Age‐DEGs, whereas 31.8% Age‐BPs at Category 3 were shared in at least two tissues (Figs 2 and 3, Datasets EV1 and EV2). A number of Age‐BPs at Category 2 or 3 were shared by multiple tissues (Figs 3 and EV4A and B). Among them are well‐recognised Age‐BPs. For example, “mitochondria,” which is critical to metabolic homeostasis and tissue integrity, are downregulated with ageing in four tissues (Sun et al, 2016) (Fig 3 and Dataset EV2). Moreover, 1.3 and 1.9% Age‐BPs at Category 3 are, respectively, up‐ and downregulated in all five tissues, implying a joint core group of Age‐BPs in all tissues (Fig 3 and Dataset EV2). “Proteolysis” and “collagen,” which are recognised as critical to protein homeostasis and tissue integrity (Varani et al, 2006; Lopez‐Otin et al, 2013; Wolkow et al, 2017; Teuscher et al, 2019), were found in this core group of Age‐BPs (Fig 3 and Dataset EV2). Some less‐studied processes such as “solute carrier” are also altered with ageing in multiple tissues (Fig 3 and Dataset EV2), providing insights for future studies. Of note, the Age‐BPs upregulated by ageing do not necessarily promote ageing but could show an adaptation to ageing. For example, the age‐dependent upregulation of “pathogen” could protect against the increased bacterial infection during ageing (Garsin et al, 2003). Interestingly, the Age‐BPs common across tissues were represented by different Age‐DEGs (Fig EV4C–K and Dataset EV2). Taken together, these results suggest that tissues not only undergo complex tissue‐specific ageing processes but also converge on specific biological processes through distinct gene regulation.
Figure EV4. The common Age‐BPs are regulated in different manners across tissues.

-
A, BThe common Age‐BPs upregulated (A) or downregulated (B) in the indicated tissues. Age‐BPs were from the enriched gene sets analysed by WormCat. Categories 1 and 2 are differentiated by capitalisation and bold fonts. Category 2 are shown below the corresponding Category 1.
-
C–KVenn diagrams showing the number of Age‐DEGs of corresponding Age‐BPs across indicated tissues as labelled in (A) and (B).
Different sets of transcription factors control the transcriptomic changes in ageing tissues
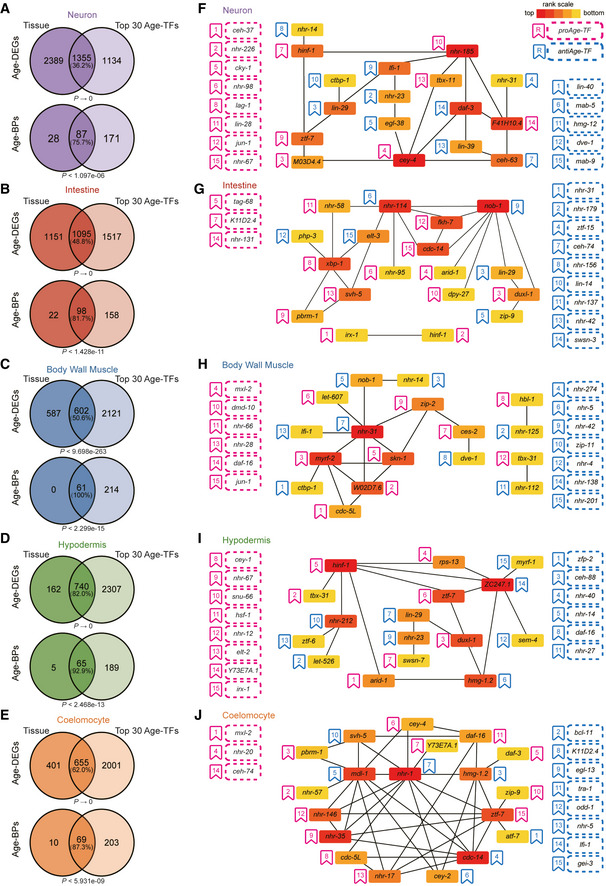
We next explored the transcription factors (TFs) regulating the transcriptomic changes in each tissue during ageing (Age‐TFs). Due to the limited information of the worm TFs‐binding sites, the TFs targets were inferred from the dependencies (mutual information) between the expression of TF and its target by ARACNe‐AP (Lachmann et al, 2016). TFs activities were analysed from the concerted differential expression of their ARACNe‐AP‐inferred targets by MARINa (Lefebvre et al, 2010). Interactions between Age‐TFs and their corresponding regulons were first identified by expression datasets from five tissues and then ranked by gene set enrichment (GSEA) on the corresponding regulons (Margolin et al, 2006; Lefebvre et al, 2010; Aytes et al, 2014). By their predicted regulation on the transcriptomes during ageing, Age‐TFs were divided into two categories: the proAge‐TFs driving and the antiAge‐TFs suppressing the transcriptomic changes. When measured by the leading‐edge subset of their regulons (Subramanian et al, 2005), the top‐ranked 30 Age‐TFs (15 proAge‐TFs and 15 antiAge‐TFs) in each tissue regulated 36.2–82.0% of Age‐DEGs and 75.7–100.0% of Age‐BPs (Fig 4A–E). 74.1% of the Age‐TFs are well‐conserved in mammals (Datasets [Link], [Link], [Link], [Link], [Link]). Numerous TFs uncharacterised in ageing were identified (Fig 4F–J and Datasets [Link], [Link], [Link], [Link], [Link]), whereas multiple well‐known transcription factors in ageing, namely daf‐16, hsf‐1, mxl‐2, pha‐4 and skn‐1 (Kenyon, 2010), did not always show high ranking among Age‐TFs across tissues (Appendix Fig S3). We next analysed potential synergistic interactions among the top 15 proAge‐TFs and 15 antiAge‐TFs in each tissue inferred by the significant overlap of their predicted regulons (Shannon et al, 2003), and visualised them in a network. As expected, many Age‐TFs in each tissue functioned in a synergetic manner (Fig 4F–J).
Figure 4. The transcriptomic changes in distinct tissues are driven by various groups of transcription factors.
-
A–EThe top 30 Age‐TFs regulating the ageing‐induced transcriptomic changes control a substantial part of Age‐DEGs and Age‐BPs in analysed tissues. Only the core Age‐TFs targets (leading‐edge targets), which account for the gene sets enrichment signal, were analysed for the Age‐DEGs and Age‐BPs regulated by corresponding Age‐TFs. Hypergeometric test.
-
F–JMany Age‐TFs function in a synergetic manner. Synergetic interactions networks were generated from top 30 Age‐TFs by synergy analysis, filtered by P < 0.001. The hub genes selected from the synergetic network using the MCC algorithm of CytoHubba plugin in Cytoscape. The Age‐TFs are ranked by the P‐values from MARINa. The Age‐TFs in the synergetic network are coloured by their MCC values. proAge‐TFs are defined as those promoting the transcriptomic changes (up‐ and downregulation) during ageing, whereas antiAge‐TFs are those inhibiting these changes. proAge‐TFs promote, whereas antiAge‐TFs suppress the ageing‐induced transcriptomic changes. Please note that these two classes of TFs are not necessarily pro‐ or anti‐ageing by their names. The transcriptomic changes triggered by a proAge‐TF could be adaptive for ageing and induce longevity.
In accordance with the diversity of Age‐DEGs, the sets of Age‐TFs also varied across tissues, with no Age‐TFs shared among four examined tissues (Fig 5A), indicating the high tissue specificity in ageing. Moreover, several Age‐TFs were shown to play opposite roles in different tissues (Fig 5B and Appendix Fig S4A). For example, CEH‐74 promoted the transcriptomic changes in coelomocyte, whereas suppressed the changes in intestine (Appendix Fig S4A). For those common Age‐TFs, their targets differed among their modulated tissues (Fig 5C–I and Appendix Fig S4B), suggesting that the epigenetic regulation could vary across tissues.
Figure 5. The comparison of Age‐TFs across tissues.

-
AThe Venn diagrams showing the distribution of Age‐TFs across tissues.
-
BThe Age‐TFs common in three tissues. The red and blue lines, respectively, denote promoting and inhibiting the transcriptomic changes during ageing. The thickness of the lines shows the power of the regulation. In the circles representing Age‐TFs, green, yellow and red sectors, respectively, indicate downregulation, no change and upregulation of the corresponding Age‐TFs in the tissue facing the sector.
-
C–IThe same Age‐TF regulates different sets of Age‐DEGs and Age‐BPs across tissues. The distribution of Age‐DEGs and Age‐BPs modulated by the Age‐TFs shared in three tissues is shown by Venn diagrams.
irx‐1/IRX controls the intestinal permeability during ageing
By profiling the tissue‐specific transcriptomic changes during ageing, we identified a group of Age‐TFs, which have not been reported in ageing yet (Fig 4F–J). Among them, irx‐1 is the ortholog of mammal IRX transcription factor and the top pro‐Age‐TF by inferred activity in intestine ageing (Fig 4G), controlling a set of Age‐BPs critical to intestine functions (Fig 6A). During ageing, its transcription was upregulated by 3.6‐fold in the intestine (Dataset EV1). At the worm level, irx‐1 was mildly upregulated by 1.8‐fold in the IIS mutant of daf‐2, whereas unchanged in the dietary restriction (DR) mutant of eat‐2 (Kenyon, 2010) (Fig EV5A). However, a GFP transgene driven by irx‐1 promoter was remarkably decreased in the intestine of daf‐2 and eat‐2 mutants (Fig EV5B and C), indicating that irx‐1 is under the regulation of IIS and DR in the intestine. To examine its functions in the ageing of intestine, we specifically knocked down its expression in the intestine of adult worms and examined the intestinal permeability using the Smurf assay. The gradual breakdown of the intestinal barrier is a hallmark of intestine ageing, leading to increased intestinal permeability and in turn, facilitating bacterial invasion, an important cause of mortality in C. elegans (Gelino et al, 2016; Branca et al, 2019). The blue dye in the Smurf assay passes through the broken intestinal barrier, making the whole worm blue (Dambroise et al, 2016). 56.6% of worms with control RNAi treatment exhibited Smurf phenotype at D8. An intestine‐specific inhibition of irx‐1 reduced the chance of Smurf to 34.3% (Fig 6B and C). We further performed intestine‐specific RNAi against irx‐1 in adult worms and found that suppressing irx‐1 in the intestine had little effect on worm lifespan (Fig 6D and Appendix Table S1). Therefore, the intestinal irx‐1 is critical to ageing‐induced disruption of the intestinal barrier but had a limited role in the ageing of the whole worm.
Figure 6. irx‐1 promotes the breakdown of intestinal barrier in aged worms.

-
AThe Age‐BPs under irx‐1 control in intestine. Age‐BPs with more than five regulated genes were listed. Categories 1 and 2 are differentiated by capitalisation and bold fonts. Category 2 are shown below the corresponding Category 1.
-
B, CThe intestine‐specific RNAi against irx‐1 reduces the Smurf phenotype at day 8 of adulthood. Mean ± SD. Scale bar: 100 µm. Unpaired t‐test, two‐tailed. More than 30 worms analysed in each of the three biological replicates.
-
DThe survival curves of the worms under indicated RNAi treatments.
Figure EV5. The expression of irx‐1 and myrf‐2 upon the suppression of IIS or the treatment of dietary restriction.

-
AThe mRNA levels of irx‐1 from the whole worm of the indicated strains. n = 3 biological replicates.
-
B, CMutating daf‐2 or eat‐2 decreases the expression of irx‐1 in the intestine. The GFP is driven by the native promoter of irx‐1. Dotted lines outline the intestine. Scale Bar: 50 µm. n ≥ 60 worms.
-
DRT–qPCR of myrf‐2 in the indicated strains. n = 3 biological replicates.
-
E, FThe expression of a GFP reporter driven by myrf‐2 promoter in BWM upon the indicated treatment. Arrowheads denote the myocytes. Scale Bar: 10 µm. n ≥ 53 worms in the daf‐2 RNAi assay. n = 60 worms in the eat‐2 mutants assay.Data information: In all panels, Mean ± SD, unpaired t‐test, two‐tailed.
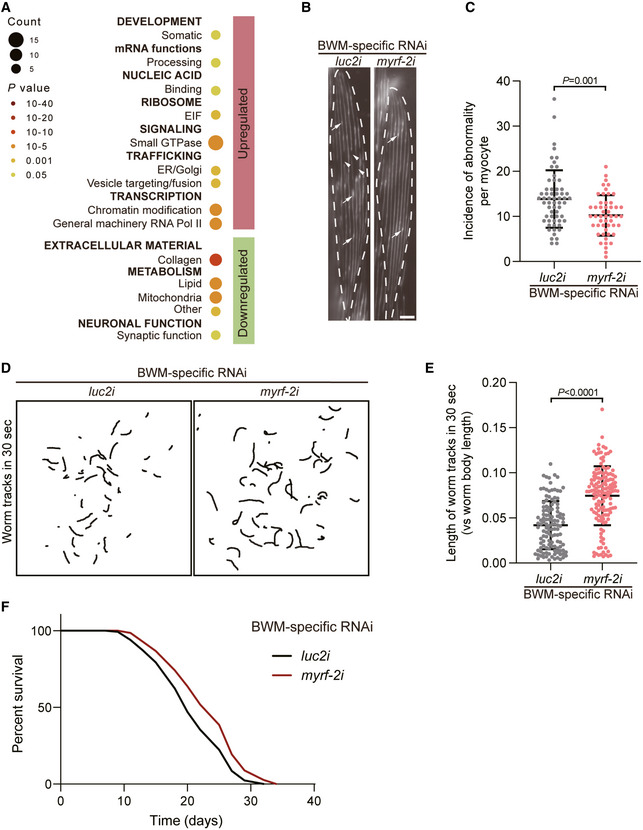
myrf‐2/MYRF promotes the ageing of body wall muscle
The deterioration of BWM is among the first ageing phenotypes discovered in worm tissues (Herndon et al, 2002). With ageing, sarcomeres become disorganised with increasing gaps and aggregates in myofilaments (Herndon et al, 2002; Zhang et al, 2021b). myrf‐2 is an ortholog of mammal myelin regulatory factor and a BWM‐specific proAge‐TF with a high ranking in our analysis (Fig 4H). Downstream of myrf‐2/MYRF are several Age‐BPs critical to BWM functions, including mitochondria and extra‐cellular matrix (Ackema et al, 2014; Gaffney et al, 2018) (Fig 7A and Dataset EV8). myrf‐2 was increased by 2.6‐fold in aged BWM (Dataset EV1). Sarcopenia is a typical ageing phenotype in various organisms (Herndon et al, 2002). Mutating eat‐2 did not affect myrf‐2 expression in the whole worm or in BWM (Fig EV5D–F). However, whereas daf‐2 did not alter the mRNA level of myrf‐2 in the whole worm (Fig EV5D), RNAi against daf‐2 decreased the expression of a GFP transgene driven by myrf‐2 promoter by ~50% in BWM (Fig EV5E and F), showing that myrf‐2 in BWM is under IIS regulation. Knocking down myrf‐2 in BWM reduced the gaps and aggregates in the aged sarcomeres (Fig 7B and C). The disruption of sarcomeres is closely related to the decreasing motility of animals (Frumkin et al, 2014). Consistent with its effect on sarcomere structure, BWM‐specific RNAi against myrf‐2 also improved the motility of aged worms (Fig 7D and E and Movie EV1). Moreover, suppressing myrf‐2 in BWM also significantly extended worms’ lifespan by 18.2% (Fig 7F and Appendix Table S1). Taken together, these results indicate that myrf‐2/MYRF drives ageing from BWM.
Figure 7. myrf‐2 is a master regulator of the ageing in body wall muscle.
-
AThe Age‐BPs regulated by myrf‐2 in body wall muscle (BWM). Age‐BPs with more than five regulated genes were listed. Categories 1 and 2 are differentiated by capitalisation and bold fonts. Category 2 is shown below the corresponding Category 1.
-
B, CThe BWM‐specific RNAi against myrf‐2 improves sarcomere in the worms at day 8 of adulthood. Arrowheads and arrows, respectively, denote the gaps of myofilaments and the disorganised myofilaments with GFP aggregations. Scale Bar: 10 µm. Mean ± SD. Unpaired t‐test, two‐tailed. n ≥ 50.
-
D, ESuppressing myrf‐2 in BWM increases worms’ motility at day 5 of adulthood. The tracks were from worms’ movement in 30 s (D). The speed of worm movement was measured by the ratio of track length versus body length (E). Mean ± SD. n ≥ 120. Unpaired t‐test, two‐tailed.
-
FBWM‐specific RNAi against myrf‐2 extends worms’ lifespan.
Discussion
Ageing entails a systematic dysfunction across multiple tissues. Compared with the numerous genetic pathways discovered to control lifespan and healthspan, the study of molecular mechanisms driving ageing in distinct tissues remains rather limited (Kenyon, 2010; Mack et al, 2018; Campisi et al, 2019). One reason for this issue is the lack of transcriptomic profiling in individual ageing tissues. Recent studies in mice retrieved age‐related transcriptomic changes in different organs, providing critical systemic information into ageing (Schaum et al, 2020; Tabula Muris, 2020). Yet, the results from bulk RNA‐Seq are veiled by the complex cell compositions in mice organs, whereas the data from single‐cell RNA‐Seq are of limited sensitivity (Schaum et al, 2020; Tabula Muris, 2020).
Caenorhabditis elegans is a premier model organism in ageing research, with a short lifespan as well as a series of ageing hallmarks similar to mammals, such as sarcopenia, memory loss and increased intestinal infection (Kenyon, 2010; Mack et al, 2018; Campisi et al, 2019). Compared to mouse organs, worm tissues have much more homogenous cell compositions but exhibit similar ageing phenotypes, making them an excellent model for deciphering the fundamental mechanisms driving tissue ageing. However, little is known about the ageing‐induced transcriptomic changes in specific worm tissues, although bulk RNA‐Seq datasets from whole worms (i.e. a mixture of tissues) are available for various longevity mutants and WT animals at different ages (Halaschek‐Wiener et al, 2005; Hou et al, 2016). The Murphy lab profiled tissue‐specific transcriptomes from young adult WT worms by FACS, validating the similarities between worm and human tissues at the transcriptional level (Kaletsky et al, 2018). Although this study compared targets of the long‐lived mutant, daf‐2(‐), with genes expressed in distinct tissues (Tepper et al, 2013; Kaletsky et al, 2018), the tissue‐specific transcriptomic changes during the ageing of WT worms remain unknown.
Based on the cell sorting protocol developed by the Murphy lab (Kaletsky et al, 2018), we developed a method to isolate cells from adult worm tissues with high purity by micromanipulation (Zhou et al, 2019) (Fig EV1). The sensitivity of Smart‐seq2 on the pooled cells is comparable to that of bulk RNA‐Seq of whole worms or mammal organs (Picelli et al, 2013; Zhang et al, 2021a). Due to the simple cell compositions in worm tissues, these isolated cells enable us to analyse the ageing‐induced transcriptomic changes in five major worm somatic tissues (i.e. neurons, intestine, body wall muscle, hypodermis and coelomocytes) with little obscurity from mixed cell types and rich details of transcriptional differences (Figs 1 and EV1). These tissues are also largely responsible for the regulation of ageing. Our datasets, therefore, enable comparative ageing studies of tissues.
Each tissue contains specific (e.g. muscle contraction for BWM) and common biological processes (e.g. autophagy in all tissues), which are both affected by ageing. Consistently, a large portion of the Age‐BPs corresponding to more general biological processes are shared across tissues (Fig 3 and Dataset EV2). Many universal Age‐BPs are consistent with our knowledge of ageing, such as the general downregulation of mitochondria‐related functions and lipid metabolism and upregulation of ribosome (Bratic & Larsson, 2013; Steffen & Dillin, 2016; Mutlu et al, 2021). Meanwhile, our datasets also highlight biological processes less appreciated in previous studies. For example, we observed a general decrease in solute carriers (SLCs) in all five examined tissues (Fig 3 and Dataset EV2). SLCs consist of different transporters, crucial to inter‐cellular transport and signalling (Pizzagalli et al, 2021). As ageing is systematically controlled among cells and tissues (Rando & Wyss‐Coray, 2021), the downregulation of SLCs could be a critical cause for the dysregulation of inter‐cellular/inter‐tissue communication. SLCs are also involved in cellular metabolism and are linked to related human diseases, including obesity and type 2 diabetes (Schumann et al, 2020). Therefore, the decrease in SLCs could also lead to the impaired metabolic homeostasis in aged animals.
The tissue‐specific Age‐BPs are mainly consistent with the characteristic functions of the corresponding tissues (Fig 3 and Dataset EV2), such as a remarkable change in GPCRs in neurons which could result in the decline in chemosensory in aged worms (Cai & Sesti, 2009; Zhang et al, 2021b). However, some are more general biological activities, such as mRNA methylation specifically altered in the aged intestine (Fig 3 and Dataset EV2). This could reflect a tissue‐specific temporal dysfunction of these Age‐BPs. As our data are from only two worm ages, these Age‐BPs may also be disrupted in other tissues during the progression of ageing. It will be interesting to pursue the transcriptomic changes in older worm tissues in future studies.
Although the similarities of Age‐BPs across tissues are as expected, we surprisingly found strikingly distinct Age‐DEGs in each tissue. Whereas the expressed genes are largely overlapping in the examined tissues as reported (Kaletsky et al, 2018) (Appendix Fig S1), Age‐DEGs exhibit strong tissue specificities (Fig 2). The vast difference in Age‐DEGs across tissues first comprise the tissue‐specific Age‐BPs. Moreover, it also makes the universal Age‐BPs regulated by discrete sets of genes in various tissues (Fig EV4). This complexity in tissue ageing has been long overlooked because previous studies mainly rely on genetic mutants affecting multiple tissues.
The Age‐TFs predicted to regulate the transcriptomic changes are consistently different in various tissues (Fig 4). Unlike Age‐DEGs, the Age‐TFs exhibit remarkable overlap across tissues. However, the same Age‐TFs are found to regulate different sets of genes among tissues (Fig 5 and Appendix Fig S4), implying tissue‐specific epigenetic regulation during ageing. Therefore, the distinct Age‐DEG sets could be caused by the various combinations of Age‐TFs and epigenetic regulators.
Because Age‐TFs were analysed from the correlated expression changes in TF/target, our study fails to highlight TFs with little changes in mRNA levels during ageing. With the increasing information of worm TFs‐binding sites, it will be interesting to analyse TFs by their physical interactions with Age‐DEGs in the future. This limit of our analysis may also explain why many well‐known longevity TFs are only highly represented in the Age‐TFs of a subset of tissues (Appendix Fig S3). For example, daf‐16/FOXO exhibits a mild and insignificant increase in the ageing intestine (Dataset EV1) and is ranked 89 in the intestinal Age‐TFs (Appendix Fig S3). Meanwhile, as these ageing regulators are all identified from longevity mutants (Kenyon, 2010), they may not be so critical to the transcriptomic changes during WT ageing as to longevity mutants. Furthermore, their longevity effect could also be tissue specific, as implied by their different rankings across tissues (Appendix Fig S3).
In addition to the known longevity regulators, most Age‐TFs have not been studied in the context of ageing. Among them, irx‐1/IRX was further shown to promote the ageing of the intestine (Fig 6). The downregulation of irx‐1 in the intestine of daf‐2 and eat‐2 mutants suggests that it could be a target of IIS and DR to counteract the ageing‐dependent deterioration of the intestinal barrier (Gelino et al, 2016) (Fig EV5). Interestingly, the mRNA level of irx‐1 from the whole worm is upregulated by mutating daf‐2 (Fig EV5), further highlighting the importance of tissue‐specific transcriptomic datasets. irx‐1 is predicted to downregulate a group of vacuolar ATPases and acid phosphatase in lysosome (Dataset EV7). Therefore, it could impair lysosomal function and consequently, the intestinal barrier in ageing (Sun et al, 2020). Since irx‐1 is well conserved across taxa and the loss of intestinal barrier integrity is a hallmark of human ageing (Branca et al, 2019), it will be interesting to explore its role in the health of the elderly population in the future.
Worms and many other organisms, including humans, suffer from sarcopenia during ageing (Herndon et al, 2002). Inhibiting a conserved MYRF transcription factor, myrf‐2, in BWM alleviated the ageing‐induced disruption of myosin filaments (Fig 7), highlighting its importance in the ageing of muscle. In BWM, myrf‐2 is upregulated in aged worms and downregulated upon daf‐2 RNAi, suggesting that it could be involved in IIS‐controlled longevity (Fig EV5 and Dataset EV1). Downstream of myrf‐2 are a wide range of biological processes, including mitochondria and extra‐cellular matrix, which are essential to muscle ageing across taxa (Dataset EV8) (Bratic & Larsson, 2013; Schuler et al, 2021). It will be interesting to pursue whether myrf‐2 drives muscular ageing through these two pathways in the future. Besides, suppressing myrf‐2 in BWM improves the motility of aged worms and extends worms’ lifespan (Fig 7). As the regulation of motility and lifespan is not restricted in BWM (Gelino et al, 2016), myrf‐2 could also have a non‐autonomous ageing effect on other tissues, such as neurons or intestine. Our datasets could therefore be a valuable resource to explore the inter‐tissue regulation of ageing. The different effects of irx‐1 and myrf‐2 on lifespan also indicate that Age‐TFs could regulate ageing either specifically in a tissue or broadly across the body.
In summary, we have provided tissue‐specific transcriptomic information from worms at different ages. By profiling the transcriptomic changes across tissues, we reveal the diversity and complexity of ageing in an unprecedented manner and correctly predict master regulators of tissue ageing. Moreover, the majority of Age‐TFs and their regulated Age‐DEGs and Age‐BPs are well conserved in higher organisms. Therefore, these datasets provide a rich resource for understanding the ageing of worms and other multicellular organisms.
Materials and Methods
Reagents and Tools table
| Reagent/Resource | Reference or Source | Identifier or Catalog Number |
|---|---|---|
|
Experimental Models |
||
| HT115 (E. coli) | Caenorhabditis Genetics Center | N/A |
| OP50 (E. coli) | Caenorhabditis Genetics Center | N/A |
| N2 Bristol (C. elegans) | Caenorhabditis Genetics Center | N/A |
| NR350 (C. elegans) | Caenorhabditis Genetics Center | N/A |
| RW1596 (C. elegans) | Caenorhabditis Genetics Center | N/A |
| SJ4144 (C. elegans) | Caenorhabditis Genetics Center | N/A |
| TU3310 (C. elegans) | Caenorhabditis Genetics Center | N/A |
| VP303 (C. elegans) | Caenorhabditis Genetics Center | N/A |
| SYD0600 (C. elegans) | This study | N/A |
| SYD0848 (C. elegans) | This study | N/A |
| SYD1115 (C. elegans) | This study | N/A |
| CB1370 (C. elegans) | Caenorhabditis Genetics Center | N/A |
| DA465 (C. elegans) | Caenorhabditis Genetics Center | N/A |
| SYD1299 (C. elegans) | This study | N/A |
| SYD1303 (C. elegans) | This study | N/A |
| SYD1315 (C. elegans) | This study | N/A |
| SYD1317 (C. elegans) | This study | N/A |
| SYD1325 (C. elegans) | This study | N/A |
|
Recombinant DNA |
||
| coel::RFP | Addgene | Cat # 8938 |
| semo‐1p::gfp | This study | N/A |
| egl‐17p::Myri‐mCherry | Guangshuo Ou Lab, Tsinghua University | N/A |
| irx‐1p::gfp | This study | N/A |
| myrf‐2p::gfp | This study | N/A |
|
Antibodies |
||
| NA in this study | ||
|
Oligonucleotides and other sequence‐based reagents |
||
| Sequences of oligonucleotides | This study | Table 2 |
|
Chemicals, Enzymes and other reagents |
||
| AMPure XP | Beckman Coulter | Cat # A63881 |
| RNeasy Mini | QIAGEN | Cat # 74104 |
| NEBNext Ultra™ Directional RNA Library Prep Kit for Illumina | New England Biolabs | Cat # E7420L |
| Betaine | Sigma‐Aldrich | Cat # 61962 |
| Betaine solution | Sigma‐Aldrich | Cat# B0300‐1VL |
| Collagenase, Type 4 | Worthington Biochemical Corporation | Cat# LS004188 |
| DTT | ABCOne | Cat# D85571‐5g |
| FUdR | Adamas | Cat# 61000B |
| IPTG, Dioxane Free | GBCBIO Technologies Inc. | Cat# 1758‐1700‐100g |
| KAPA HiFi HotStart ReadyMix | KAPA Biosystems | Cat # KK2601 |
| KOD ‐Plus‐ Neo | TOYOBA | Cat # KOD‐401 |
| NovoStart® SYBR qPCR SuperMix Plus | Novoprotein | Cat# E096 |
| PrimeScript™ RT reagent Kit (Perfect Real Time) | Takara | Cat# RR037A |
| Protease from Streptomyces griseus | Sigma‐Aldrich | Cat# P6911 |
| ProtoScript II Reverse Transcriptase | New England Biolabs | Cat # M0368L |
| Q5® High‐Fidelity DNA Polymerase | New England Biolabs | Cat# M0491L |
| RiboLock RNase Inhibitor | Thermo Fisher | Cat # EO0381 |
| RNaseOUT™ Recombinant Ribonuclease Inhibitor | Invitrogen | Cat# 10777019 |
| Sodium citrate dihydrate | Shanghai Experment Reagent | Cat# 174000AR |
| Tn5 | Picelli et al (2014) | |
| TRIzol™ Reagent | Invitrogen | Cat# 15596018 |
|
Software |
||
| ARACNe‐AP | Lachmann et al (2016) | |
| Cytoscape v3.8.2 | http://www.cytoscape.org | |
| featureCounts | Liao et al (2014) | |
| GraphPad Prism 8 | https://www.graphpad.com/ | |
| MARINa | Aytes et al (2014) | |
| scikit‐learn v0.24.2 | http://scikit‐learn.org/ | |
| STAR v2.6.0c | Dobin et al (2013) | |
| TBtools | Chen et al (2020) | |
| Fiji | https://imagej.net/imagej‐wiki‐static/Fiji | |
|
Other |
||
| 2200 TapeStation system | Agilent | |
| Agilent D1000 ScreenTape | Agilent | |
| Agilent High Sensitivity D5000 ScreenTape | Agilent | |
| Agilent High Sensitivity RNA ScreenTape | Agilent | |
| Illumina HiSeq X Ten | Illumina | |
| Illumina NovaSeq 6000 | Illumina | |
| Illumina HiSeq2500 | Illumina | |
| The Qubit 2.0 Fluorometer | Thermo Fisher | |
| Nikon D4 camera with a Nikon AF Zoom‐Nikkor 24–85 mm lens | Nikon | |
| Olympus SZX16 stereo microscope | Olympus | |
| Olympus BX53 microscope | Olympus | |
| Olympus IXplore SpinSR microscope | Olympus |
Table 2.
Sequences of oligonucleotides.
| >Name | Sequence (5′–3′) |
|---|---|
| semo‐1p‐Forward | TTGCATGCCTGCAGGGTTGCAGAAAAATATTTCACTGTTTCAC |
| semo‐1p‐Reverse | CTCACTATAGGGCACGGGATTTTTGATCTGCAAATATTGAC |
| irx‐1p‐Forward | GGCCGCTGTACACCCGTATGAGTTGATCGATGTGTTTTG |
| irx‐1p‐Reverse | CACTATAGGGCACCCATCATTGTGATGGTGTAGTAGAAG |
| myrf‐2p‐Forward | GGCCGCTGTACACCCATGGTTATATCAGTATGGTTACACAG |
| myrf‐2p‐Reverse | CACTATAGGGCACCCAGCATCTTCACTTCATTCGC |
| Oligo‐dT30VN primer | AAGCAGTGGTATCAACGCAGAGTACT30VN |
| TSO primer | AAGCAGTGGTATCAACGCAGAGTACATrGrG+G |
| A‐IS PCR primer | AAGCAGTGGTATCAACGCAGAGT |
| ISPCR oligo | AAGCAGTGGTATCAACGCAGAGT |
| act‐1‐qPCR‐Forward | CCCACTCAATCCAAAGGCTA |
| act‐1‐qPCR‐Reverse | ATCTCCAGAGTCGAGGACGA |
| myo‐3‐qPCR‐Forward | ATCACCAGATGTAACAAGACCC |
| myo‐3‐qPCR‐Reverse | CAAGAATAGAGATGATACCGAGTG |
| rab‐3‐qPCR‐Forward | ACTGTGTTCCGTGGAGAC |
| rab‐3‐qPCR‐Reverse | TAGTAGGCGGTGGTGATG |
| rgef‐1‐qPCR‐Forward | GCTAAACAGACTGCCTTCTC |
| rgef‐1‐qPCR‐Reverse | GAACAAACTTCACAAGGATCTC |
| semo‐1‐qPCR‐Forward | TTTTAGAATTCATCCTGTTGAGGAG |
| semo‐1‐qPCR‐Reverse | AAGAGCCCATCCACTTACTTTTT |
| unc‐122‐qPCR‐Forward | ACTATCATTCCAAGAAACGTCC |
| unc‐122‐qPCR‐Reverse | CACATACAGATCAGGAAACGG |
| vha‐6‐qPCR‐Forward | CAAGAGCAGAGATGCAAG |
| vha‐6‐qPCR‐Reverse | AGGATAAGTTCAACGAGGG |
For Oligo‐dT30VN primer primer, “N” is any base and “V” is A, C or G. For LNA‐TSO primer, at the 3′ end, there are two riboguanosines (rGs) and one LNA‐modified guanosine (+G). For A‐IS PCR primer, amine (NH2) modification was added to the 5′ end with a C6 linker during synthesis.
Methods and Protocols
Caenorhabditis elegans strains and culture
Worm strains used in this study are listed in Table 1. Some strains were provided by CGC, which is funded by NIH Office of Research Infrastructure Programs (P40 OD010440). All assayed worms were cultured with standard technique at 20°C (Brenner, 1974).
Table 1.
C. elegans Strains used in this study.
| Strain | Genotype |
|---|---|
| N2 Bristol | Wild type |
| NR350 | rde‐1(ne219) V; kzIs20 [pDM#715(hlh‐1p::rde‐1) + pTG95(sur‐5p::nls::GFP)] |
| RW1596 | myo‐3(st386) V; stEx30[myo‐3p::GFP::myo‐3 + rol‐6(su1006)] |
| SJ4144 | zcIs18 [ges‐1::GFP(cyt)] |
| TU3310 | uIs59 [unc‐119p::YFP] |
| VP303 | rde‐1(ne219) V; kbIs7 [nhx‐2p::rde‐1 + rol‐6(su1006)] |
| SYD0600 | sydEx143[coel::RFP] |
| SYD0848 | sydEx211[semo‐1p::GFP, myo‐2::mCherry] |
| SYD1115 | rde‐1(ne219) V; myo‐3(st386) V; kzIs20; stEx30 |
| CB1370 | daf‐2(e1370) III |
| DA465 | eat‐2(ad465) II |
| SYD1299 | sydEx319 [irx‐1p::gfp + egl‐17p::Myri‐mCherry] |
| SYD1325 | daf‐2(e1370) III; sydEx319 |
| SYD1315 | eat‐2(ad465) II; sydEx319 |
| SYD1303 | sydEx321 [myrf‐2p::gfp + egl‐17p::Myri‐mCherry] |
| SYD1317 | eat‐2(ad465) II; sydEx321 |
For RNA‐Seq of worms at different ages, synchronised WT worms were hand‐picked onto fresh plates every other day since the fourth larval stage. For each biological replicate, around 200–400 young adult worms without bearing eggs, and 130–300 worms at day 7 of adulthood were, respectively, collected.
For Smart‐Seq2 of isolated cells from specific worm tissues, ~2,000 synchronised WT worms of day 1 adulthood were collected. For day 8 samples, ~14,000 synchronised worms were raised on regular NGM until L4 stage and subsequently transferred to FUdR‐containing plates supplemented with 25 μM FUdR (Adamas) (Mitchell et al, 1979; Gandhi et al, 1980). Worms were washed three times with M9 to deplete remaining bacteria and then transferred onto fresh NGM plates containing FUdR every other day from L4 to day 8 of adulthood.
Plasmid construction
To generate semo‐1p::gfp, 2,912 bp of semo‐1 promoter was amplified from N2 genomic DNA and cloned into L3781. The Fire Lab C. elegans Vector Kit was a gift from Andrew Fire.
To generate irx‐1p::gfp, 2,505 bp of irx‐1 promoter was amplified from N2 genomic DNA and cloned into L3781 (Reece‐Hoyes et al, 2013).
To generate myrf‐2p::gfp, 1,504 bp of myrf‐2 promoter was amplified from N2 genomic DNA and cloned into L3781 (Reece‐Hoyes et al, 2013).
The plasmid have been submitted to BRICS (http://www.brics.ac.cn/plasmid/template/article/about.html).
Transgenes
The extra‐chromosomal transgenic line of semo‐1p::gfp was generated by co‐injecting the plasmids of semo‐1p::GFP and myo‐2::mCherry into N2. Plasmids concentrations for microinjections were 50 ng/μl for the gene of interest and 2.5 ng/μl for injection marker, respectively.
The extra‐chromosomal transgenic line of coel::RFP was generated by injecting 50 ng/μl coel::RFP plasmid (Addgene) into N2.
The extra‐chromosomal transgenic line of irx‐1p::gfp was generated by co‐injecting the plasmids of irx‐1p::gfp and egl‐17p::Myri‐mCherry into N2. Plasmids concentrations for microinjections were 50 ng/μl for the gene of interest and 30 ng/μl for injection marker respectively.
The extra‐chromosomal transgenic line of myrf‐2p::gfp was generated by co‐injecting the plasmids of myrf‐2p::gfp and egl‐17p::Myri‐mCherry into N2. Plasmids concentrations for microinjections were 50 ng/μl for the gene of interest and 30 ng/μl for injection marker, respectively.
Cell isolation
Worms with tissue‐specific fluorescent markers (ges‐1::GFP(cyt) for intestine, myo‐3p::GFP::MYO‐3 for body wall muscle, semo‐1p::GFP for hypodermis, coel::RFP for coelomocyte and unc‐119p::YFP for neuron) were dissociated by SDS–DTT treatment and proteolysis with mechanical disruption as reported (Kaletsky et al, 2018; Zhou et al, 2019). For intestine, body wall muscle, hypodermis and coelomocyte, 20–40 fluorescent cells from the tissue of interest were manually picked using an Eppendorf TransferMan 4r on an Olympus IX73 microscope and pooled together for each biological replicate, as previously described (Zhou et al, 2019). For neurons, dissociated worms were first filtered with 5 μm cell strainer and isolated by FACS following as reported (Kaletsky et al, 2018). N2 worms at corresponding age were used as negative control to eliminate auto‐fluorescence. Around 8,000 neurons were collected for each biological replicate. The samples purity was validated by qRT–PCR of tissue‐specific genes before RNA library construction. Three biological replicates were collected for each tissue at each age.
Cell viability assay
Cell viability assays were performed as reported with minor modifications (Zhang et al, 2011). Isolated neurons, intestine, body wall muscle and hypodermis cells were resuspended in 1 ml PBS with 1 µM ethidium homodimer‐1 (Proteintech) and incubated for 20 min at room temperature. Isolated coelomocytes were resuspended in 1 ml PBS with 1 μM Calcein AM (Proteintech) and incubated for 20 min at room temperature. Ethidium homodimer‐1 and Calcein AM label dead and live cells respectively. Cell viability was examined by fluorescence microscopy on an Olympus BX53 microscope.
RNA preparation
RNA from whole worms was prepared by RNeasy Mini kit (QIAGEN) as reported (Shen et al, 2012). RNA form FACS‐sorted neurons was isolated as reported (Kaletsky et al, 2016), with minor modifications. In brief, RNA was extracted using standard TRIzol/chloroform/isopropanol method. When incubating the aqueous phase with isopropanol overnight at −20°C, 50 µl of NaAc (3 M) and 3 µl LPA (linear polyacrylamide, 5 μg/µl) per 500 µl aqueous phase were added to facilitate RNA precipitation.
Quantitative PCR
RT–qPCR was performed as reported (Shen et al, 2012). cDNA from whole worms was generated by PrimeScript™ RT reagent kit for RT–qPCR (Takara). To analyse the purity of isolated cells except neuron cells, cDNA was prepared as previously described (Zhou et al, 2019). cDNA of neurons was obtained from mRNA library construction. RT–qPCR was performed with 2xNovoStart®SYBR qPCR SuperMix Plus (Novoprotein) on a QuantStudioTM 6 Flex Real‐time PCR System (Applied Biosystems) or a CFX384 TouchTM Real‐Time PCR Detection System (Bio‐Rad). Four technical replicates were performed in each reaction. The results were from at least three biological replicates. The sequences of all reported and self‐designed primers are either reported or as listed in Table 2 (Jovanovic et al, 2010; Wurmthaler et al, 2019; Zhou et al, 2019).
mRNA library construction and RNA‐Seq
mRNA libraries from isolated cells were constructed based on Smart‐seq2 with some modifications (Picelli et al, 2013; Zhang et al, 2021a). Briefly, extracted RNA or cell lysates were incubated at 72°C for 3min, followed by reverse transcription using ProtoScript II Reverse Transcriptase (NEB) and pre‐amplification. The amplified cDNA was then purified by Agencourt AMPure XP beads (Beckman Coulter) and 2 ng of cDNA was used for next tagmentation reaction (Picelli et al, 2014). After final amplification, mRNA libraries were purified by Agencourt AMPure XP beads, and analysed on a 2200 Tapestation System (Aligent Technologies, Santa Clara, CA) for quality control. All libraries were sequenced 2 × 150 bp on an Illumina HiSeq X Ten or a NovaSeq 6000 platform (Illumina, USA).
mRNA libraries from whole worms were prepared using NEBNext Ultra Directional RNA Library Prep kit for Illumina (New England Biolabs) and sequenced on a HiSeq2500 at the Max Planck Genome Center (Cologne, Germany) as reported (Nakamura et al, 2016).
RNA‐Seq data analysis
RNA‐Seq reads were mapped to WBcel235 by STAR (v2.6.0c) (Dobin et al, 2013). Mapped reads were quantified by featureCounts (Liao et al, 2014) and normalised by TPM (Transcripts Per Million). Quantile normalisation was performed on log2TPM. Total genes were used to calculate Pearson correlation coefficient and perform principal component analysis by scikit‐learn (Pedregosa et al, 2011). Genes with more than five reads in each tissue were defined as expressed genes. Differential expression of genes was analysed by t‐test (P‐value < 0.05 and fold‐change > 1.5 or < 0.67) after Box–Cox transformation.
Homology annotation
Mammalian homology of worm genes was annotated by SimpleMine in the Alliance of Genome Resources with default stringent mode.
Pathway analysis
Gene ontology of C. elegans was from Wormbase. GO enrichment analysis was conducted by Fisher's exact test with Bonferroni correction. WormCat (http://wormcat.com/) is a nematode‐specific gene ontology enrichment analysis and visualisation tool allowing for drilled‐down analysis of specific pathways (Holdorf et al, 2020). For DEGs functional analysis, significantly up‐ and downregulated genes were input to WormCat using default settings. Terms were considered as Age‐BPs when the WormCat reported P‐value < 0.05. For pathway analysis of Age‐TFs, the leading‐edge subset of target genes for Age‐TFs was input to WormCat using default settings. Significance scores were reported as Fisher’s exact test P‐values.
Transcription factor analysis
The C. elegans transcription factor (TF) list was obtained from a previous report (Narasimhan et al, 2015). To identify TF master regulators, we first inferred the targets with expression data using ARACNe‐AP (with P‐value 1E‐8) (Lachmann et al, 2016). Given the inferred networks, the MARINa (ssmarina package available from http://dx.doi.org/10.6084/m9.figshare.785718) was used to infer Age‐TFs based on the comparison between D1 and D8 samples and to analyse the targets and interactions of the Age‐TFs. Inferred Age‐TFs regulons were ranked by gene set enrichment analysis (GSEA). The core Age‐TFs targets, which account for the gene sets’ enrichment signal, were defined as the leading‐edge subset, which appear in the ranked list at or before the point at which the running sum reaches its maximum deviation from zero. The synergy analysis of Age‐TFs was performed with default parameters with P < 0.001 (Aytes et al, 2014).
Network construction and hub Age‐TFs ranking
The Age‐TFs with synergetic interaction identified using MARINa were chosen to construct a network visualised by Cytoscape (v3.8.2) (Shannon et al, 2003). To find hub Age‐TFs in the network, maximal clique centrality (MCC) of each node was calculated by CytoHubba (plugin for Cytoscape). Hub Age‐TFs in each tissue were ranked by MCC value. MCC algorithm was reported to be the most effective method of finding hub nodes (Chin et al, 2014).
RNA interference
RNAi experiments were performed according to reported protocol (Kamath et al, 2001). Briefly, worms were grown on HT115‐expressing dsRNA against indicated genes from day 1 until indicated ages. HT115‐expressing dsRNA against luc2, a real but irrelevant gene to worm biology, served as control to minimise off‐target phenotypes. The strain of HT115 [L4440::luc2] was a gift from Adam Antebi lab in Max Planck Institute for Biology of Ageing. For intestine‐specific RNAi, VP303 worms were used (Espelt et al, 2005). For body wall muscle‐specific RNAi, NR350 worms were used directly or after crossed with indicated strains (Qadota et al, 2007).
Smurf assay
Smurf assay was performed to observe intestinal barrier function as reported (Gelino et al, 2016). VP303 worms were subjected to RNAi treatment from day 1 to day 8 of adulthood. ~30 D8 worms were collected and incubated for 3 h in liquid cultures of OP50 mixed with 5% (w/v) Erioglaucine disodium salt (Sangon Biotech) at 20°C. Afterwards, worms were transferred to unseeded NGM plates and immobilised with 0.1% sodium azide. Worms were scored for the presence of blue dye in the body cavity using an Olympus SZX16 stereo microscope with a SPOT Insight digital camera. Animals with blue dye in the germline were not considered as Smurf animals unless the dye was also observed in the body cavity.
Abnormalities analysis of body wall muscle
Worms carrying myo‐3p::GFP::myo‐3 transgene were treated with body wall muscle‐specific RNAi from day 1 to day 8 of adulthood. Worms were subsequently examined on an Olympus BX53 microscope. The abnormalities were characterised into two types: a general disorganisation of the myofilaments with GFP aggregations and gaps in the lattice (Meissner et al, 2009).
Motility assay
NR350 worms were subjected to control or myrf‐2i from day 1 to day 5 of adulthood and subsequently transferred to the fresh RNAi plates and movements were recorded using a Nikon D4 camera equipped with a Nikon AF Zoom‐Nikkor 24–85 mm lens for 30 s. Recorded movies were analysed by ImageJ and wrMTrck (plugin for ImageJ: www.phage.dk/plugins).
Analysis of the transcriptional reporter
Synchronised worms at day 1 of adulthood were anaesthetised using 0.1% NaN3 and mounted on 5% agar pads. Images were collected using an Olympus BX53 microscope or an Olympus IXplore SpinSR microscope. Fluorescent intensities were measured by Adobe Photoshop.
Ageing assays
All ageing assays were performed at 20°C. Worms were transferred away from progeny to fresh plates every other day during the reproductive period. Worm survival was scored every 2 or 3 days. Worms undergoing internal hatching, bursting vulva or crawling off the plates were censored. Worms not responding to prodding were scored as dead. Graphpad Prism (GraphPad Software) was used to plot survival curves and calculate median lifespan. Statistical analysis was performed with the Mantel–Cox log rank method.
Statistical analysis
Results are presented as Mean ± SD unless otherwise noted. Statistical tests were performed as indicated using GraphPad Prism (GraphPad software). Venn diagrams and Upset plots were generated using TBtools (Chen et al, 2020). Statistical significance of the overlapping between two gene sets was calculated by hypergeometric test (http://nemates.org/MA/progs/overlap_stats.cgi). Detailed statistics for experiments were listed in Appendix Table S1.
Author contributions
Yidong Shen: Conceptualization; Data curation; Formal analysis; Supervision; Funding acquisition; Validation; Investigation; Methodology; Writing—original draft; Project administration; Writing—review & editing. Xueqing Wang: Resources; Data curation; Formal analysis; Validation; Investigation; Visualization; Methodology; Writing—original draft; Writing—review & editing. Quanlong Jiang: Data curation; Software; Formal analysis; Validation; Investigation; Visualization; Writing—original draft; Writing—review & editing. Yuanyuan Song: Data curation; Formal analysis; Investigation. Zhidong He: Investigation. Hongdao Zhang: Data curation; Formal analysis; Investigation. Mengjiao Song: Investigation; Visualization. Xiaona Zhang: Investigation. Yumin Dai: Investigation. Oezlem Karalay: Investigation. Christoph Dieterich: Data curation; Software; Formal analysis; Investigation. Adam Antebi: Data curation; Formal analysis; Supervision; Writing—original draft. Ligang Wu: Supervision; Funding acquisition; Validation; Writing—original draft; Project administration. Jing‐Dong J Han: Supervision; Funding acquisition; Validation; Writing—original draft; Project administration.
In addition to the CRediT author contributions listed above, the contributions in detail are:
XW, LW, J‐DJH and YS conceived the project and designed the experiments. XW, ZH, MS, XZ and YD collected worms for sequencing and performed worm‐related experiments and analysed the data, with the assistance of YS. YS constructed RNA libraries under the supervision of HZ and LW. QJ and XW performed bioinformatics analysis under the supervision of J‐DJH and YS. YS, OK, CD and AA profiled the transcriptomic changes in whole worms at different ages. YS wrote the manuscript. All authors contributed to manuscript editing.
Supporting information
Appendix
Expanded View Figures PDF
Dataset EV1
Dataset EV2
Dataset EV3
Dataset EV4
Dataset EV5
Dataset EV6
Dataset EV7
Dataset EV8
Dataset EV9
Dataset EV10
Movie EV1
Acknowledgements
The authors thank the institutional core facilities for cell biology and molecular biology for instrumental and technical supports, Drs Franziska Metge and Jorge Boucas (MPI‐AGE) for uploading RNA‐Seq results to SRA. The depictions in Fig 1A were created with BioRender.com. This research was supported by the Strategic Priority Research Program of the Chinese Academy of Sciences, Grant No. XDB19000000 to Y.S., and grants from China Ministry of Science and Technology (2020YFA0804000), National Natural Science Foundation of China (91749205, 92049302 and 32088101) and Shanghai Municipal Science and Technology Major Project (2017SHZDZX01) to J.D.J.H.
Disclosure and competing interests statement
The authors declare that they have no conflict of interest. Prof. Adam Antebi is an EMBO Member. This has no bearing on the editorial consideration of this article for publication.
The EMBO Journal (2022) 41: e109633.
Contributor Information
Ligang Wu, Email: lgwu@sibcb.ac.cn.
Jing‐Dong J Han, Email: jackie.han@pku.edu.cn.
Yidong Shen, Email: yidong.shen@sibcb.ac.cn.
Data availability
The RNA‐Seq data from this publication have been deposited to the SRA database (https://www.ncbi.nlm.nih.gov/sra) and assigned the links as below:
Whole worm RNA‐Seq: https://www.ncbi.nlm.nih.gov/sra/?term=PRJNA759704.
Tissues Smart‐Seq2: https://www.ncbi.nlm.nih.gov/sra/?term=PRJNA759083.
References
- Ackema KB, Hench J, Bockler S, Wang SC, Sauder U, Mergentaler H, Westermann B, Bard F, Frank S, Spang A (2014) The small GTPase Arf1 modulates mitochondrial morphology and function. EMBO J 33: 2659–2675 [DOI] [PMC free article] [PubMed] [Google Scholar]
- Almanzar N, Antony J, Baghel AS, Bakerman I, Bansal I, Barres BA, Beachy PA, Berdnik D, Bilen B, Brownfield D et al (2020) A single‐cell transcriptomic atlas characterizes ageing tissues in the mouse. Nature 583: 590–595 [DOI] [PMC free article] [PubMed] [Google Scholar]
- Aytes A, Mitrofanova A, Lefebvre C, Alvarez M, Castillo‐Martin M, Zheng T, Eastham J, Gopalan A, Pienta K, Shen M et al (2014) Cross‐species regulatory network analysis identifies a synergistic interaction between FOXM1 and CENPF that drives prostate cancer malignancy. Cancer Cell 25: 638–651 [DOI] [PMC free article] [PubMed] [Google Scholar]
- Branca JJV, Gulisano M, Nicoletti C (2019) Intestinal epithelial barrier functions in ageing. Ageing Res Rev 54: 100938 [DOI] [PubMed] [Google Scholar]
- Bratic A, Larsson NG (2013) The role of mitochondria in aging. J Clin Invest 123: 951–957 [DOI] [PMC free article] [PubMed] [Google Scholar]
- Brenner S (1974) The genetics of Caenorhabditis elegans . Genetics 77: 71–94 [DOI] [PMC free article] [PubMed] [Google Scholar]
- Cai SQ, Sesti F (2009) Oxidation of a potassium channel causes progressive sensory function loss during aging. Nat Neurosci 12: 611–617 [DOI] [PMC free article] [PubMed] [Google Scholar]
- Campisi J, Kapahi P, Lithgow GJ, Melov S, Newman JC, Verdin E (2019) From discoveries in ageing research to therapeutics for healthy ageing. Nature 571: 183–192 [DOI] [PMC free article] [PubMed] [Google Scholar]
- Chen C, Chen H, Zhang Y, Thomas HR, Frank MH, He Y, Xia R (2020) TBtools: an integrative toolkit developed for interactive analyses of big biological data. Mol Plant 13: 1194–1202 [DOI] [PubMed] [Google Scholar]
- Chin CH, Chen SH, Wu HH, Ho CW, Ko MT, Lin CY (2014) cytoHubba: identifying hub objects and sub‐networks from complex interactome. BMC Syst Biol 8(Suppl 4): S11 [DOI] [PMC free article] [PubMed] [Google Scholar]
- Corsi AK, Wightman B, Chalfie M (2015) A transparent window into biology: a primer on Caenorhabditis elegans . Genetics 200: 387–407 [DOI] [PMC free article] [PubMed] [Google Scholar]
- Dambroise E, Monnier L, Ruisheng L, Aguilaniu H, Joly JS, Tricoire H, Rera M (2016) Two phases of aging separated by the Smurf transition as a public path to death. Sci Rep 6: 23523 [DOI] [PMC free article] [PubMed] [Google Scholar]
- Dobin A, Davis CA, Schlesinger F, Drenkow J, Zaleski C, Jha S, Batut P, Chaisson M, Gingeras TR (2013) STAR: ultrafast universal RNA‐seq aligner. Bioinformatics 29: 15–21 [DOI] [PMC free article] [PubMed] [Google Scholar]
- Espelt MV, Estevez AY, Yin X, Strange K (2005) Oscillatory Ca2+ signaling in the isolated Caenorhabditis elegans intestine: role of the inositol‐1,4,5‐trisphosphate receptor and phospholipases C beta and gamma. J Gen Physiol 126: 379–392 [DOI] [PMC free article] [PubMed] [Google Scholar]
- Frumkin A, Dror S, Pokrzywa W, Bar‐Lavan Y, Karady I, Hoppe T, Ben‐Zvi A (2014) Challenging muscle homeostasis uncovers novel chaperone interactions in Caenorhabditis elegans . Front Mol Biosci 1: 21 [DOI] [PMC free article] [PubMed] [Google Scholar]
- Gaffney CJ, Pollard A, Barratt TF, Constantin‐Teodosiu D, Greenhaff PL, Szewczyk NJ (2018) Greater loss of mitochondrial function with ageing is associated with earlier onset of sarcopenia in C. elegans . Aging 10: 3382–3396 [DOI] [PMC free article] [PubMed] [Google Scholar]
- Gandhi S, Santelli J, Mitchell DH, Stiles JW, Sanadi DR (1980) A simple method for maintaining large, aging populations of Caenorhabditis elegans . Mech Ageing Dev 12: 137–150 [DOI] [PubMed] [Google Scholar]
- Garsin DA, Villanueva JM, Begun J, Kim DH, Sifri CD, Calderwood SB, Ruvkun G, Ausubel FM (2003) Long‐lived C. elegans daf‐2 mutants are resistant to bacterial pathogens. Science 300: 1921 [DOI] [PubMed] [Google Scholar]
- Gelino S, Chang JT, Kumsta C, She X, Davis A, Nguyen C, Panowski S, Hansen M (2016) Intestinal autophagy improves healthspan and longevity in C. elegans during dietary restriction. Plos Genet 12: e1006135 [DOI] [PMC free article] [PubMed] [Google Scholar]
- Halaschek‐Wiener J, Khattra JS, McKay S, Pouzyrev A, Stott JM, Yang GS, Holt RA, Jones SJ, Marra MA, Brooks‐Wilson AR et al (2005) Analysis of long‐lived C. elegans daf‐2 mutants using serial analysis of gene expression. Genome Res 15: 603–615 [DOI] [PMC free article] [PubMed] [Google Scholar]
- Herndon LA, Schmeissner PJ, Dudaronek JM, Brown PA, Listner KM, Sakano Y, Paupard MC, Hall DH, Driscoll M (2002) Stochastic and genetic factors influence tissue‐specific decline in ageing C. elegans . Nature 419: 808–814 [DOI] [PubMed] [Google Scholar]
- Holdorf AD, Higgins DP, Hart AC, Boag PR, Pazour GJ, Walhout AJM, Walker AK (2020) WormCat: an online tool for annotation and visualization of Caenorhabditis elegans genome‐scale data. Genetics 214: 279–294 [DOI] [PMC free article] [PubMed] [Google Scholar]
- Hou L, Wang D, Chen DI, Liu YI, Zhang Y, Cheng H, Xu C, Sun NA, McDermott J, Mair W et al (2016) A systems approach to reverse engineer lifespan extension by dietary restriction. Cell Metab 23: 529–540 [DOI] [PMC free article] [PubMed] [Google Scholar]
- Johnson TE (1990) Increased life‐span of age‐1 mutants in Caenorhabditis elegans and lower Gompertz rate of aging. Science 249: 908–912 [DOI] [PubMed] [Google Scholar]
- Jovanovic M, Reiter L, Picotti P, Lange V, Bogan E, A Hurschler B, Blenkiron C, J Lehrbach N, C Ding X, Weiss M et al (2010) A quantitative targeted proteomics approach to validate predicted microRNA targets in C.elegans . Nat Methods 7: 837–842 [DOI] [PMC free article] [PubMed] [Google Scholar]
- Kaletsky R, Lakhina V, Arey R, Williams A, Landis J, Ashraf J, Murphy CT (2016) The C.elegans adult neuronal IIS/FOXO transcriptome reveals adult phenotype regulators. Nature 529: 92–96 [DOI] [PMC free article] [PubMed] [Google Scholar]
- Kaletsky R, Yao V, Williams A, Runnels AM, Tadych A, Zhou S, Troyanskaya OG, Murphy CT (2018) Transcriptome analysis of adult Caenorhabditis elegans cells reveals tissue‐specific gene and isoform expression. Plos Genet 14: e1007559 [DOI] [PMC free article] [PubMed] [Google Scholar]
- Kamath RS, Martinez‐Campos M, Zipperlen P, Fraser AG, Ahringer J (2001) Effectiveness of specific RNA‐mediated interference through ingested double‐stranded RNA in Caenorhabditis elegans . Genome Biol 2: RESEARCH0002 [DOI] [PMC free article] [PubMed] [Google Scholar]
- Kenyon CJ (2010) The genetics of ageing. Nature 464: 504–512 [DOI] [PubMed] [Google Scholar]
- Kenyon C (2011) The first long‐lived mutants: discovery of the insulin/IGF‐1 pathway for ageing. Philos Trans R Soc Lond B Biol Sci 366: 9–16 [DOI] [PMC free article] [PubMed] [Google Scholar]
- Kenyon C, Chang J, Gensch E, Rudner A, Tabtiang R (1993) A C. elegans mutant that lives twice as long as wild type. Nature 366: 461–464 [DOI] [PubMed] [Google Scholar]
- Lachmann A, Giorgi FM, Lopez G, Califano A (2016) ARACNe‐AP: gene network reverse engineering through adaptive partitioning inference of mutual information. Bioinformatics 32: 2233–2235 [DOI] [PMC free article] [PubMed] [Google Scholar]
- Lefebvre C, Rajbhandari P, Alvarez MJ, Bandaru P, Lim WK, Sato M, Wang K, Sumazin P, Kustagi M, Bisikirska BC et al (2010) A human B‐cell interactome identifies MYB and FOXM1 as master regulators of proliferation in germinal centers. Mol Syst Biol 6: 377 [DOI] [PMC free article] [PubMed] [Google Scholar]
- Li ST, Zhao HQ, Zhang P, Liang CY, Zhang YP, Hsu AL, Dong MQ (2019) DAF‐16 stabilizes the aging transcriptome and is activated in mid‐aged Caenorhabditis elegans to cope with internal stress. Aging Cell 18: e12896 [DOI] [PMC free article] [PubMed] [Google Scholar]
- Liao Y, Smyth GK, Shi W (2014) featureCounts: an efficient general purpose program for assigning sequence reads to genomic features. Bioinformatics 30: 923–930 [DOI] [PubMed] [Google Scholar]
- Lopez‐Otin C, Blasco MA, Partridge L, Serrano M, Kroemer G (2013) The hallmarks of aging. Cell 153: 1194–1217 [DOI] [PMC free article] [PubMed] [Google Scholar]
- Lund J, Tedesco P, Duke K, Wang J, Kim SK, Johnson TE (2002) Transcriptional profile of aging in C. elegans . Curr Biol 12: 1566–1573 [DOI] [PubMed] [Google Scholar]
- Mack HID, Heimbucher T, Murphy CT (2018) The nematode Caenorhabditis elegans as a model for aging research. Drug Discov Today: Dis Models 27: 3–13 [Google Scholar]
- Margolin AA, Nemenman I, Basso K, Wiggins C, Stolovitzky G, Dalla Favera R, Califano A (2006) ARACNE: an algorithm for the reconstruction of gene regulatory networks in a mammalian cellular context. BMC Bioinformatics 7(Suppl 1): S7 [DOI] [PMC free article] [PubMed] [Google Scholar]
- McElwee J, Bubb K, Thomas JH (2003) Transcriptional outputs of the Caenorhabditis elegans forkhead protein DAF‐16. Aging Cell 2: 111–121 [DOI] [PubMed] [Google Scholar]
- Meissner B, Warner A, Wong K, Dube N, Lorch A, McKay SJ, Khattra J, Rogalski T, Somasiri A, Chaudhry I et al (2009) An integrated strategy to study muscle development and myofilament structure in Caenorhabditis elegans . Plos Genet 5: e1000537 [DOI] [PMC free article] [PubMed] [Google Scholar]
- Mitchell DH, Stiles JW, Santelli J, Sanadi DR (1979) Synchronous growth and aging of Caenorhabditis elegans in the presence of fluorodeoxyuridine. J Gerontol 34: 28–36 [DOI] [PubMed] [Google Scholar]
- Morris JZ, Tissenbaum HA, Ruvkun G (1996) A phosphatidylinositol‐3‐OH kinase family member regulating longevity and diapause in Caenorhabditis elegans . Nature 382: 536–539 [DOI] [PubMed] [Google Scholar]
- Murphy CT, McCarroll SA, Bargmann CI, Fraser A, Kamath RS, Ahringer J, Li H, Kenyon C (2003) Genes that act downstream of DAF‐16 to influence the lifespan of Caenorhabditis elegans . Nature 424: 277–283 [DOI] [PubMed] [Google Scholar]
- Mutlu AS, Duffy J, Wang MC (2021) Lipid metabolism and lipid signals in aging and longevity. Dev Cell 56: 1394–1407 [DOI] [PMC free article] [PubMed] [Google Scholar]
- Nakamura S, Karalay O, Jager PS, Horikawa M, Klein C, Nakamura K, Latza C, Templer SE, Dieterich C, Antebi A (2016) Mondo complexes regulate TFEB via TOR inhibition to promote longevity in response to gonadal signals. Nat Commun 7: 10944 [DOI] [PMC free article] [PubMed] [Google Scholar]
- Narasimhan K, Lambert SA, Yang AWH, Riddell J, Mnaimneh S, Zheng H, Albu M, Najafabadi HS, Reece‐Hoyes JS, Fuxman Bass JI et al (2015) Mapping and analysis of Caenorhabditis elegans transcription factor sequence specificities. Elife 4: e6967 [DOI] [PMC free article] [PubMed] [Google Scholar]
- Ogg S, Paradis S, Gottlieb S, Patterson GI, Lee L, Tissenbaum HA, Ruvkun G (1997) The Fork head transcription factor DAF‐16 transduces insulin‐like metabolic and longevity signals in C. elegans . Nature 389: 994–999 [DOI] [PubMed] [Google Scholar]
- Pedregosa F, Varoquaux G, Gramfort A, Michel V, Thirion B, Grisel O, Blondel M, Prettenhofer P, Weiss R, Dubourg V et al (2011) Scikit‐learn: machine learning in python. J Mach Learn Res 12: 2825–2830 [Google Scholar]
- Picelli S, Bjorklund AK, Faridani OR, Sagasser S, Winberg G, Sandberg R (2013) Smart‐seq2 for sensitive full‐length transcriptome profiling in single cells. Nat Methods 10: 1096–1098 [DOI] [PubMed] [Google Scholar]
- Picelli S, Bjorklund AK, Reinius B, Sagasser S, Winberg G, Sandberg R (2014) Tn5 transposase and tagmentation procedures for massively scaled sequencing projects. Genome Res 24: 2033–2040 [DOI] [PMC free article] [PubMed] [Google Scholar]
- Pizzagalli MD, Bensimon A, Superti‐Furga G (2021) A guide to plasma membrane solute carrier proteins. FEBS J 288: 2784–2835 [DOI] [PMC free article] [PubMed] [Google Scholar]
- Qadota H, Inoue M, Hikita T, Koppen M, Hardin JD, Amano M, Moerman DG, Kaibuchi K (2007) Establishment of a tissue‐specific RNAi system in C. elegans . Gene 400: 166–173 [DOI] [PMC free article] [PubMed] [Google Scholar]
- Rando TA, Wyss‐Coray T (2021) Asynchronous, contagious and digital aging. Nature Aging 1: 29–35 [DOI] [PMC free article] [PubMed] [Google Scholar]
- Reece‐Hoyes JS, Pons C, Diallo A, Mori A, Shrestha S, Kadreppa S, Nelson J, Diprima S, Dricot A, Lajoie BR et al (2013) Extensive rewiring and complex evolutionary dynamics in a C. elegans multiparameter transcription factor network. Mol Cell 51: 116–127 [DOI] [PMC free article] [PubMed] [Google Scholar]
- Riera CE, Merkwirth C, De Magalhaes Filho CD, Dillin A (2016) Signaling networks determining life span. Annu Rev Biochem 85: 35–64 [DOI] [PubMed] [Google Scholar]
- Schaum N, Lehallier B, Hahn O, Pálovics R, Hosseinzadeh S, Lee SE, Sit R, Lee DP, Losada PM, Zardeneta ME et al (2020) Ageing hallmarks exhibit organ‐specific temporal signatures. Nature 583: 596–602 [DOI] [PMC free article] [PubMed] [Google Scholar]
- Schuler SC, Kirkpatrick JM, Schmidt M, Santinha D, Koch P, Di Sanzo S, Cirri E, Hemberg M, Ori A, von Maltzahn J (2021) Extensive remodeling of the extracellular matrix during aging contributes to age‐dependent impairments of muscle stem cell functionality. Cell Rep 35: 109223 [DOI] [PubMed] [Google Scholar]
- Schumann T, Konig J, Henke C, Willmes DM, Bornstein SR, Jordan J, Fromm MF, Birkenfeld AL (2020) Solute carrier transporters as potential targets for the treatment of metabolic disease. Pharmacol Rev 72: 343–379 [DOI] [PubMed] [Google Scholar]
- Shannon P, Markiel A, Ozier O, Baliga NS, Wang JT, Ramage D, Amin N, Schwikowski B, Ideker T (2003) Cytoscape: a software environment for integrated models of biomolecular interaction networks. Genome Res 13: 2498–2504 [DOI] [PMC free article] [PubMed] [Google Scholar]
- Shen Y, Wollam J, Magner D, Karalay O, Antebi A (2012) A steroid receptor‐microRNA switch regulates life span in response to signals from the gonad. Science 338: 1472–1476 [DOI] [PMC free article] [PubMed] [Google Scholar]
- Steffen KK, Dillin A (2016) A ribosomal perspective on proteostasis and aging. Cell Metab 23: 1004–1012 [DOI] [PubMed] [Google Scholar]
- Subramanian A, Tamayo P, Mootha VK, Mukherjee S, Ebert BL, Gillette MA, Paulovich A, Pomeroy SL, Golub TR, Lander ES et al (2005) Gene set enrichment analysis: a knowledge‐based approach for interpreting genome‐wide expression profiles. Proc Natl Acad Sci USA 102: 15545–15550 [DOI] [PMC free article] [PubMed] [Google Scholar]
- Sun N, Youle RJ, Finkel T (2016) The mitochondrial basis of aging. Mol Cell 61: 654–666 [DOI] [PMC free article] [PubMed] [Google Scholar]
- Sun Y, Li M, Zhao D, Li X, Yang C, Wang X (2020) Lysosome activity is modulated by multiple longevity pathways and is important for lifespan extension in C. elegans . Elife 9: e55745 [DOI] [PMC free article] [PubMed] [Google Scholar]
- Tepper RG, Ashraf J, Kaletsky R, Kleemann G, Murphy CT, Bussemaker HJ (2013) PQM‐1 complements DAF‐16 as a key transcriptional regulator of DAF‐2‐mediated development and longevity. Cell 154: 676–690 [DOI] [PMC free article] [PubMed] [Google Scholar]
- Teuscher AC, Statzer C, Pantasis S, Bordoli MR, Ewald CY (2019) Assessing collagen deposition during aging in mammalian tissue and in Caenorhabditis elegans . Methods Mol Biol 1944: 169–188 [DOI] [PMC free article] [PubMed] [Google Scholar]
- Varani J, Dame MK, Rittie L, Fligiel SE, Kang S, Fisher GJ, Voorhees JJ (2006) Decreased collagen production in chronologically aged skin: roles of age‐dependent alteration in fibroblast function and defective mechanical stimulation. Am J Pathol 168: 1861–1868 [DOI] [PMC free article] [PubMed] [Google Scholar]
- Von Stetina SE, Watson JD, Fox RM, Olszewski KL, Spencer WC, Roy PJ, Miller DM (2007) Cell‐specific microarray profiling experiments reveal a comprehensive picture of gene expression in the C. elegans nervous system. Genome Biol 8: R135 [DOI] [PMC free article] [PubMed] [Google Scholar]
- Willcox BJ, Donlon TA, He Q, Chen R, Grove JS, Yano K, Masaki KH, Willcox DC, Rodriguez B, Curb JD (2008) FOXO3A genotype is strongly associated with human longevity. Proc Natl Acad Sci USA 105: 13987–13992 [DOI] [PMC free article] [PubMed] [Google Scholar]
- Wolkow C, Herndon LA, Hall DH (2017) WormAtlas aging handbook ‐ the aging cuticle. Bronx, NY: WormAtlas; [Google Scholar]
- Wurmthaler LA, Sack M, Gense K, Hartig JS, Gamerdinger M (2019) A tetracycline‐dependent ribozyme switch allows conditional induction of gene expression in Caenorhabditis elegans . Nat Commun 10: 491 [DOI] [PMC free article] [PubMed] [Google Scholar]
- Zhang H, Zhang F, Chen Q, Li M, Lv X, Xiao Y, Zhang Z, Hou LI, Lai Y, Zhang Y et al (2021a) The piRNA pathway is essential for generating functional oocytes in golden hamsters. Nat Cell Biol 23: 1013–1022 [DOI] [PubMed] [Google Scholar]
- Zhang S, Banerjee D, Kuhn JR (2011) Isolation and culture of larval cells from C. elegans . PLoS One 6: e19505 [DOI] [PMC free article] [PubMed] [Google Scholar]
- Zhang Y, Zhang X, Dai Y, Song M, Zhou Y, Zhou J, Yan X, Shen Y (2021b) The decrease of intraflagellar transport impairs sensory perception and metabolism in ageing. Nat Commun 12: 1789 [DOI] [PMC free article] [PubMed] [Google Scholar]
- Zhou Y, Wang X, Song M, He Z, Cui G, Peng G, Dieterich C, Antebi A, Jing N, Shen Y (2019) A secreted microRNA disrupts autophagy in distinct tissues of Caenorhabditis elegans upon ageing. Nat Commun 10: 4827 [DOI] [PMC free article] [PubMed] [Google Scholar]