Abstract
Background
Oral glucose tolerance test (OGTT)-based measures of insulin secretory response have not been validated in pregnancy.
Methods
In a secondary analysis of a longitudinal study, participants were studied prepregnancy (n = 40), in early pregnancy (n = 36; 12-14 weeks’ gestation), and in late pregnancy (n = 36; 34-36 weeks’ gestation). Participants underwent an OGTT, an intravenous glucose tolerance test (IVGTT), and a hyperinsulinemic-euglycemic clamp at each timepoint. We calculated homeostatic model assessment of beta-cell function (HOMA-2B), insulinogenic index (IGI), corrected insulin response (CIR), ratio of the area under the insulin curve and the area under the glucose curve (AUCins/AUCglu), and Stumvoll first-phase estimate (Stumvoll) from OGTT insulin and glucose levels. We used Pearson correlation to compare measures from OGTT and IVGTT. We used mixed effects models to examine longitudinal changes in insulin secretory response.
Results
Stumvoll was the only OGTT-based measure that was significantly correlated with first-phase insulin response prior to and across gestation (prepregnancy: r = 0.44, P = 0.01; early pregnancy: r = 0.67, P = 0.0001; late pregnancy: r = 0.67, P = 0.0001). In early and late pregnancy, AUCins/AUCglu had the strongest correlation with first-phase insulin response (early pregnancy: r = 0.79, P < 0.0001; late pregnancy: r = 0.69, P < 0.0001) but was not significantly correlated prepregnancy. IGI and CIR were significantly correlated with first-phase insulin response prepregnancy (IGI: r = 0.50, P = 0.005; CIR r = 0.47, P = 0.008) and in late pregnancy (IGI: r = 0.68, P = 0.0001; CIR r = 0.57, P = 0.002) but not in early pregnancy. HOMA-2B was the weakest correlate of first-phase insulin response. Stumvoll and AUCins/AUCglu recapitulated the longitudinal changes in insulin secretory response observed by IVGTT.
Conclusions
Stumvoll and AUCins/AUCglu are valid OGTT-based insulin secretory response measures for pregnancy studies.
Keywords: pregnancy, gestational diabetes, insulin, glucose
Pregnancy produces a dramatic increase in insulin secretory response (1-4). We recently demonstrated that this marked augmentation of insulin secretion occurs in early pregnancy in the setting of a slight increase in insulin sensitivity (5). This suggests that augmentation of insulin secretory response is independent of the well-known pregnancy-induced insulin resistance that emerges later in gestation. In contrast to the augmentation of insulin secretory response in early pregnancy, the additional increase in insulin secretory response between early pregnancy and late pregnancy is compensatory for this pregnancy-induced insulin resistance (5). Studies in rodent models confirm that there is a positive effect of pregnancy on beta-cell mass, beta-cell proliferation, and insulin secretion (6-10), but the presumed hormonal mediators of this effect are yet to be elucidated in humans (5). Additional study of the insulin secretory response in pregnant women could lead to novel insights on beta-cell function in humans relevant to the study of diabetes. Yet, validated feasible measures to evaluate insulin secretory response in pregnant women are not available.
While intravenous glucose tolerance tests (IVGTTs) and clamp studies are gold-standard methods for assessing insulin physiology, these procedures are onerous and expensive to perform. As a result, they cannot be feasibly implemented in large epidemiologic studies. Recognizing this issue, past investigators have developed several indices for beta-cell function or insulin secretory response that can be applied to glucose and insulin levels from the fasting state or during an oral glucose tolerance test (OGTT) in nonpregnant individuals (11-15). These measures, which have been validated outside of pregnancy, include homeostatic model assessment of beta-cell function (HOMA-2B; based on fasting measures) (15,16), the insulinogenic index (IGI) (13), the corrected insulin response (CIR) (14), the Stumvoll first-phase estimate (Stumvoll) (11,12), and the ratio of the area under the insulin curve and the area under the glucose curve (AUCins/AUCglu). With the exception of HOMA-2B and AUCins/AUCglu, these measures capture the initial insulin secretory response to glucose (within 30 minutes), the loss of which is an early sign of pancreatic beta-cell dysfunction and the development of diabetes (13). We previously validated the OGTT-based Matsuda insulin sensitivity (resistance) index against a euglycemic-hyperinsulinemic clamp measure of insulin sensitivity but did not include OGTT measures of insulin secretory response in that prior analysis (17,18). To our knowledge, none of the fasting or OGTT-based measures for insulin secretory response have been previously been validated in pregnancy.
The goal of the present study was to determine the extent to which fasting (HOMA-2B) and OGTT-based measures of insulin secretory response (IGI, CIR, Stumvoll, and AUCins/AUCglu) approximate first-phase insulin secretory response (as measured by IVGTT) in pregnant women. We utilized data from a previously conducted longitudinal study of glucose metabolism in pregnant women, which, to our knowledge, is the only published study of its kind (1-3). We first tested the correlation of OGTT-based measures with first-phase insulin response cross-sectionally at each study timepoint (pre-, early, and late pregnancy). We then assessed how well the OGTT-based measures recapitulated longitudinal changes in insulin secretory response during gestation observed previously using IVGTT measures (5).
Methods
Participants in the study were women planning pregnancy and were enrolled prior to conception. Participants were recruited in 4 strata based on diabetes risk factors (presence vs absence) and body fat percentage (≥27.5% or <27.5% based on fat mass as determined by underwater weighing) (1-3). Women with diabetes risk factors, including family history, previous gestational diabetes mellitus (GDM), or previous abnormal glucose testing in pregnancy, were considered likely to develop GDM. Women from each of the 4 strata were enrolled in the study in approximately equal numbers.
Women were studied prepregnancy, in early pregnancy (at 12-14 weeks’ gestation), and in late pregnancy (at 34-36 weeks’ gestation). At each timepoint on separate days, after overnight fasts, an IVGTT, an OGTT, and a euglycemic-hyperinsulinemic clamp was performed. No participants were on pharmacologic treatment for GDM at the time of testing.
The IVGTT consisted of measurement of fasting glucose and insulin followed by intravenous administration of a 0.5 g/kg glucose load (or 19 g/m2 body surface area if weight was greater than 120% ideal body weight). Glucose and insulin values were measured 1, 3, 5, and 10 minutes after the intravenous glucose infusion. The first-phase insulin response (from IVGTT) was calculated as the incremental area under the curve during the first 10 minutes after intravenous administration of the glucose load.
The OGTT consisted of measurement of fasting glucose and insulin followed by oral administration of a 75-g oral glucose load prior to pregnancy or a 100-g glucose load in pregnancy.
The euglycemic-hyperinsulinemic clamp was performed using the methods of DeFronzo et al (19). In brief, after an 11-hour fast, an infusion of [6,6-2H2] glucose was initiated. After 2 hours, an insulin infusion was initiated to achieve an approximate plasma insulin concentration of 600 pmol m−2 mL−1. An infusion of 20% glucose was used to keep the blood concentration of glucose at 90 mg/dL (5.0 mmol/l), as assessed by every 5-minute blood sampling. The insulin sensitivity index was calculated as the glucose infusion rate plus residual endogenous glucose production per kilogram of fat-free mass, divided by the mean insulin concentration during the clamp. Fat-free mass was assessed using under water weighing, with correction for residual lung volume using a nitrogen washout technique (1-3,20).
We used homeostatic model assessment (HOMA-2) to estimate beta-cell function (HOMA-2B) using fasting glucose and insulin measurements prior to the OGTT (15,16). A calculator, available at https://www.dtu.ox.ac.uk/homacalculator/, was used to obtain HOMA-2B values.
The IGI (13) was calculated using insulin (in µU/mL) and glucose (in mg/dL) values obtained during the OGTT as
where insulintime 30 and glucosetime 30 represent the values 30 minutes after ingestion of the oral glucose load.
The CIR (14) was calculated using insulin (in µU/mL) and glucose (in mg/dL) values obtained during the OGTT as
The Stumvoll (11) was calculated using insulin (in pmol/L) and glucose (in mmol/L) as
We also examined a modified Stumvoll based on only fasting and 60-minute measures (12).
AUCins/AUCglu was calculated using the trapezoidal rule with the fasting and 30-, 60-, 90-, 120-, and 180-minute glucose (in mg/dL) and insulin (in µU/mL) values during the OGTT. The total (rather than incremental) area under the curve was used. We also examined a modified AUCins/AUCglu based on insulin and glucose measured fasting and every 60 minutes.
Data from all participants were analyzed together. We used Pearson correlation to assess the relationship between insulin secretory response indices obtained from OGTT glucose and insulin values, with the first-phase insulin response from the IVGTT as the reference method. We used linear mixed effects models to examine insulin secretory in early as compared to pre- and late pregnancy (P-values adjusted for 2 comparisons using Bonferroni). Participant was modeled as a random effect, and time was modeled as a fixed effect. In adjusted models, we included insulin sensitivity, as measured with the clamp, as a time-dependent covariate. Findings are reported as unadjusted means on the dependent variable or covariate-adjusted means ± SE.
Results
Participants
Characteristics of participants at the prepregnancy visit are shown in Table 1. Forty women were studied prepregnancy; 36 returned in early (12-14 weeks’ gestation) and late pregnancy (34-36 weeks’ gestation). Seventeen participants developed GDM, which was diagnosed routinely at 24 to 28 weeks’ gestation. All of the women identified as White race, none used tobacco or marijuana, and none had a history of hypertension.
Table 1.
Characteristics of study participants prior to pregnancy
| Characteristic | Result |
|---|---|
| n | 40a |
| Age, years | 30.8 (4.0) |
| Gravidity | 1.6 (1.0) |
| Body mass index, kg/m2 | 23.3 (5.0) |
| Activity metabolic index, kcal/day (n = 31)b | 199.4 (279.3) |
| Gestational diabetes, n (%) | 17 (43) |
| First-phase insulin response, by IVGTT | 465.2 (295.6) |
| HOMA-2B | 95.9 (43.0) |
| Insulinogenic index (n = 30) | 1.27 (0.75) |
| Corrected insulin response (n = 31) | 0.76 (0.41) |
| Stumvoll first-phase estimate (n = 31) | 1221.8 (587.3) |
| AUCins/AUCglu(n = 31) | 0.47 (0.27) |
Data are given as mean (SD) unless otherwise noted.
Abbreviations: AUCins/AUCglu, ratio of the area under the insulin curve and the area under the glucose curve; HOMA-2B, homeostatic model assessment of beta-cell function; IVGTT, intravenous glucose tolerance test.
aUnless otherwise noted. Some glucose and insulin data were missing due to loss of intravenous access, nausea/vomiting, or laboratory analysis error.
bCalculated from the Minnesota Leisure Time Physical Activity Questionnaire.
HOMA-2B
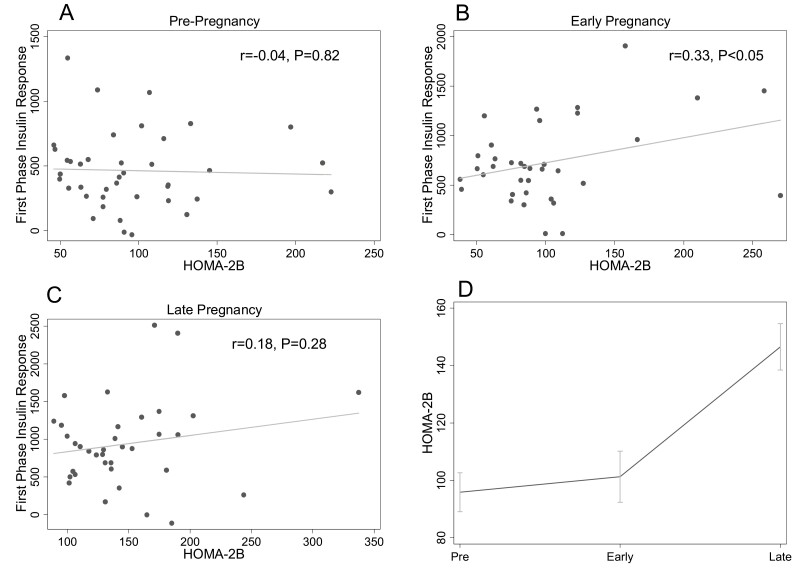
HOMA-2B was not associated with first-phase insulin response prepregnancy (r = −0.04, P = 0.82) (Fig. 1A) or in late pregnancy (r = 0.18, P = 0.28) (Fig. 1C). In early pregnancy there was a modest positive correlation between HOMA-2B and first-phase insulin response that reached statistical significance (r = 0.33, P < 0.05) (Fig. 1B). In the longitudinal analysis, there was a nonsignificant trend toward increase in HOMA-2B from prepregnancy to early pregnancy (95.9 ± 6.8 to 105.9 ± 8.5, P = 0.05). HOMA-2B increased between early and late (149.5 ± 7.9) pregnancy (P < 0.0001). After adjustment for insulin sensitivity, the increase in HOMA-2B between pre- and early pregnancy was significant (prepregnancy: 99.2 ± 6.9 vs early pregnancy: 114.2 ± 8.7, P = 0.002), and the increase between early and late (138.1 ± 8.4) pregnancy was attenuated relative to what was found for the unadjusted analysis but remained statistically significant (P = 0.04).
Figure 1.
Relationship between homeostatic model assessment of beta-cell function (HOMA-2B) and first- phase insulin response at each study timepoint. The relationships between HOMA-2B and first-phase insulin response (by intravenous glucose tolerance test) prepregnancy (A), in early pregnancy (B), and late pregnancy (C) are shown. Panel D shows the change in HOMA-2B across pre-, early, and late pregnancy timepoints. The mean at each timepoint is plotted; the error bars depict the standard error of the mean.
Insulinogenic Index
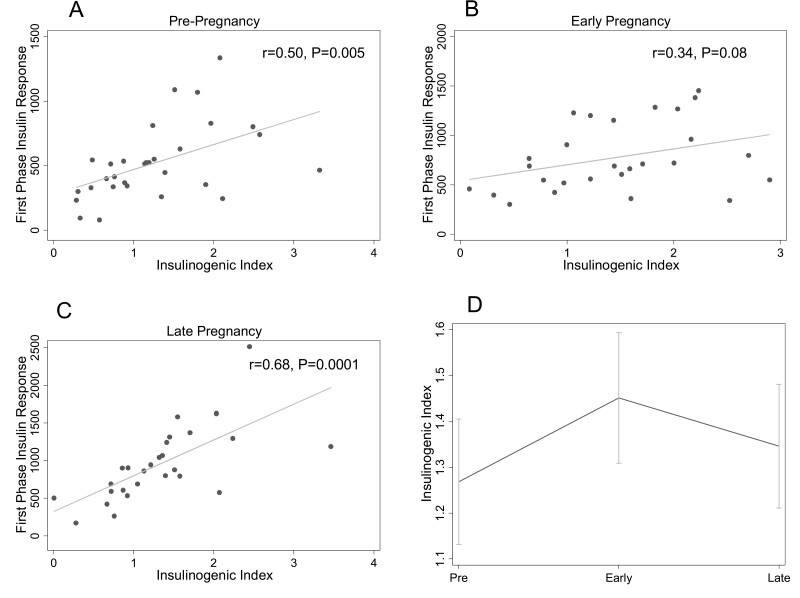
The IGI was associated with first-phase insulin response prepregnancy (r = 0.50, P = 0.005) (Fig. 2A) and in late pregnancy (r = 0.68, P = 0.0001) (Fig. 2C). In early pregnancy, there was no significant correlation between IGI and first-phase insulin response (r = 0.34, P = 0.08) (Fig. 2B). Figure 3D shows longitudinal changes in IGI. IGI increased between pre- and early pregnancy (1.25 ± 0.13 to 1.52 ± 0.15, P = 0.046) and remained stable between early and late pregnancy (1.41 ± 0.14, P = 0.84). Findings did not change after adjustment for insulin sensitivity (prepregnancy:1.29 ± 0.13 vs early pregnancy: 1.59 ± 0.16, P = 0.03; early vs late pregnancy: 1.31 ± 0.16, P = 0.32).
Figure 2.
Relationship between the insulinogenic index (IGI) and first-phase insulin response at each study timepoint. The relationships between IGI and first-phase insulin response (by intravenous glucose tolerance test) prepregnancy (A), in early pregnancy (B), and late pregnancy (C) are shown. Panel D shows the change in IGI across pre-, early, and late pregnancy timepoints. The mean at each timepoint is plotted; the error bars depict the standard error of the mean.
Figure 3.
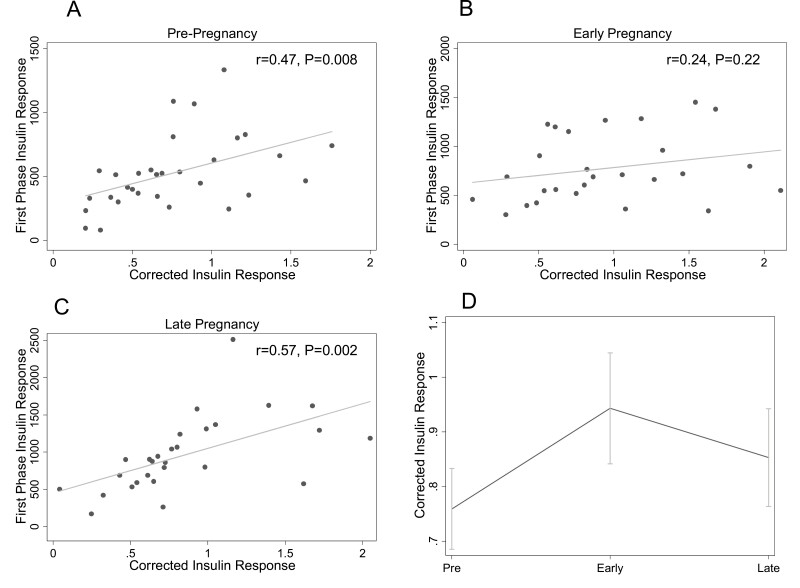
Relationship between the corrected insulin response (CIR) and first-phase insulin response at each study timepoint. The relationships between CIR and first-phase insulin response (by intravenous glucose tolerance test) prepregnancy (A), in early pregnancy (B), and in late pregnancy (C) are shown. Panel D shows the change in CIR across pre-, early, and late pregnancy timepoints. The mean at each timepoint is plotted; the error bars depict the standard error of the mean.
Corrected Insulin Response
The results for CIR were similar to those for IGI. CIR was associated with first-phase insulin response prepregnancy (r = 0.47, P = 0.008) (Fig. 3A) and in late pregnancy (r = 0.57, P = 0.002) (Fig. 3C) but not in early pregnancy (r = 0.24, P = 0.22) (Fig. 3B). Figure 3D shows longitudinal changes in CIR. CIR increased from prepregnancy (0.75 ± 0.07) to early (0.97 ± 0.10) pregnancy (P = 0.03) and was stable from early to late (0.88 ± 0.09) pregnancy (P = 0.71). After adjustment for insulin sensitivity, the increase from pre- (0.76 ± 0.07) to early (1.00 ± 0.11) pregnancy remained statistically significant (P = 0.03). There was no difference in CIR between early and late (0.85 ± 0.10) pregnancy in insulin sensitivity-adjusted analyses (P = 0.51).
Stumvoll First-Phase Estimate
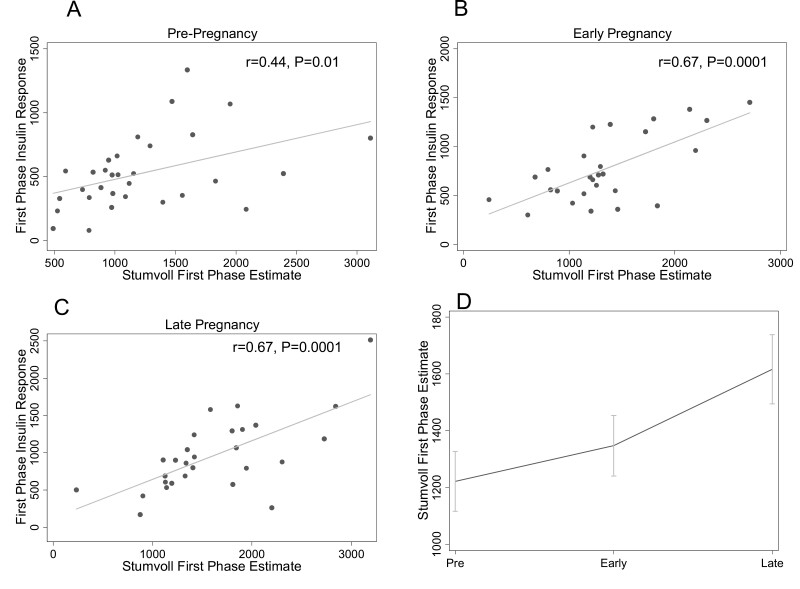
Stumvoll was associated with first-phase insulin response at each of the 3 study timepoints (Fig. 4A-4C), with equivalent strong associations in early (r = 0.67, P = 0.0001) and late (r = 0.67, P = 0.0001) pregnancy and a moderate correlation prepregnancy (r = 0.44, P = 0.01). The modified Stumvoll (with 60-minute instead of 30-minute insulin and glucose measures) was moderately associated with first-phase insulin response in early (r = 0.52, P = 0.001) and late (r = 0.43, P = 0.009) but not pre- (r = 0.24, P = 0.13) pregnancy. Figure 4D shows longitudinal changes in Stumvoll. Stumvoll increased from pre- (1211.4 ± 104.5) to early (1371.9 ± 102.3) pregnancy (P = 0.03) and increased further in late pregnancy (1648.7 ± 119.7, P = 0.008). The change in Stumvoll between prepregnancy and early pregnancy was independent of changes in insulin sensitivity (1262.7 ± 91.1 to 1534.5 ± 94.0, P = 0.0002), but the increase from early to late (1443.3 ± 123.5) pregnancy was not significant after insulin sensitivity adjustment (P = 0.93).
Figure 4.
Relationship between the Stumvoll first-phase estimate (Stumvoll) and first-phase insulin response at each study timepoint. The relationships between Stumvoll and first-phase insulin response (by intravenous glucose tolerance test) prepregnancy (A), in early pregnancy (B), and in late pregnancy (C) are shown. Panel D shows the change in Stumvoll across pre-, early, and late pregnancy timepoints. The mean at each timepoint is plotted; the error bars depict the standard error of the mean.
Ratio of the Area Under the Insulin Curve and the Area Under the Glucose Curve
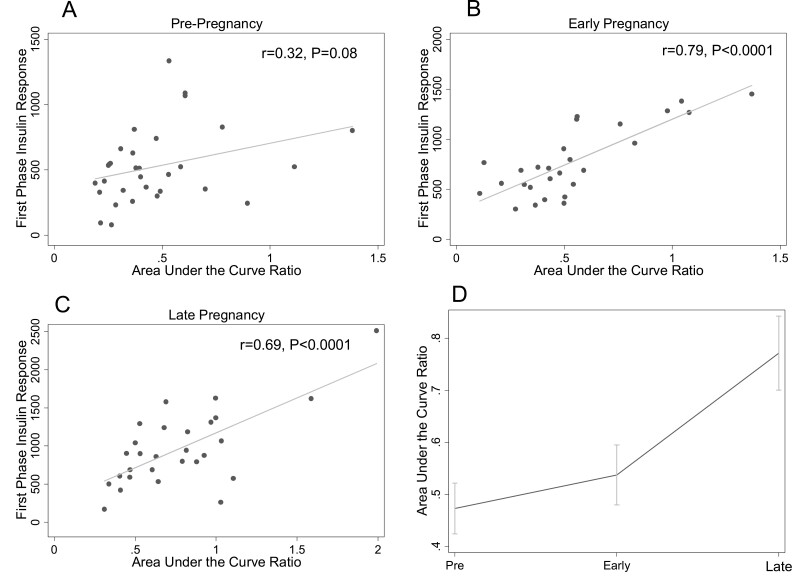
AUCins/AUCglu was strongly associated with first-phase insulin response in early (r = 0.79, P < 0.0001) (Fig. 5B) and late (r = 0.69, P < 0.0001) (Fig. 5C) pregnancy but not prepregnancy (r = 0.32, P = 0.08) (Fig. 5A). The modified AUCins/AUCglu (without 30-minute insulin and glucose measures) was also moderately associated with first-phase insulin response in early (r = 0.50, P = 0.002) and late (r = 0.52, P = 0.001) but not pre- (r = 0.24, P = 0.14) pregnancy. Figure 5D shows longitudinal changes in AUCins/AUCglu. AUCins/AUCglu increased from pre- to early pregnancy (0.47 ± 0.05 to 0.55 ± 0.05, P = 0.03) and increased further from early to late pregnancy (0.79 ± 0.07, P < 0.0002). The increase between pre- and early pregnancy was independent of changes in insulin sensitivity (0.50 ± 0.04 vs 0.66 ± 0.05, P < 0.0002), but the increase between early and late pregnancy (0.65 ± 0.07) was not apparent after adjusting for insulin sensitivity (P > 0.99).
Figure 5.
Relationship between ratio of the insulin area under the curve to the glucose area under the curve (AUCins/AUCglu) and first-phase insulin response at each study timepoint. The relationships between AUCins/AUCglu and first-phase insulin response (by intravenous glucose tolerance test) prepregnancy (A), in early pregnancy (B), and in late pregnancy (C) are shown. Panel D shows the change in AUCins/AUCglu across pre-, early, and late pregnancy timepoints. The mean at each timepoint is plotted; the error bars depict the standard error of the mean.
Discussion
Here, in a secondary analysis of a longitudinal study of glucose metabolism in pregnancy, we show that most OGTT-based insulin secretory response indices capture the insulin sensitivity-independent augmentation of insulin secretory response in early pregnancy that we previously characterized using IVGTT (5). However, OGTT-based measures of insulin secretion do not have a consistent relationship with first-phase insulin response measured by IVGTT across pregnancy. Our findings suggest that the Stumvoll is the best available estimate to use in OGTT-based investigations of insulin secretory response in pregnancy, particularly in studies that include both pregnant and nonpregnant individuals. For cross-sectional studies limited to pregnancy, Stumvoll or AUCins/AUCglu can be used. In addition to showing strong correlations with first-phase insulin response during pregnancy, both Stumvoll and AUCins/AUCglu recapitulate the longitudinal changes seen in first-phase insulin response across gestation (5). To our knowledge, no previous studies in pregnancy have examined the relationship between OGTT-based measures of insulin secretory response against insulin secretory response as measured by IVGTT or hyperglycemic clamp.
Estimation of beta-cell function using HOMA relies only on fasting measures, making it easy to employ in epidemiologic studies (15,21,22). HOMA-based beta-cell function was originally reported to be associated with IVGTT measures of insulin secretory response in a small number individuals with diabetes (15). In contrast, we found that HOMA-2B was not well correlated with first-phase insulin secretory responses derived using IVGTT in pregravid and pregnant women. We only found a significant relationship between first-phase insulin response and HOMA-2B in early pregnancy, when insulin secretory response increases so robustly that it may become evident in fasting measures. Despite this, HOMA-2B did appear to recapitulate longitudinal changes in beta-cell function across pre-, early, and late pregnancy to some extent. Given our findings, and the widespread use of OGTTs during pregnancy, we suggest that HOMA-2B is a nonpreferred method to assess beta-cell function in the pregnant state.
The IGI and CIR measure the initial beta-cell response to oral glucose (13,14). This early response to glucose is known to be reduced in individuals with prediabetes and diabetes, despite more insulin secretion overall in response to an oral glucose load in those in the early course of the disease (13). These measures were not specifically designed to emulate first-phase insulin response as measured by IVGTT or clamp but rather to capture the physiology of insulin response to glucose load, which is compromised in diabetes. Both the IGI and CIR increased between prepregnancy and early pregnancy but not between early and late pregnancy. Despite appearing to capture the robust increase in beta-cell function that occurs in early gestation, these measures did not adequately capture interindividual differences in insulin secretory response in early pregnancy as demonstrated by their lack of correlation with first-phase insulin response across our study population.
Outside of pregnancy, Stumvoll et al derived a first-phase estimate using stepwise regression procedures and first-phase insulin response measures from hyperglycemic clamps (11). In this initial study, the Stumvoll (r = 0.78 with clamp) outperformed a HOMA-based measure (r = 0.57) and IGI (r = 0.25) and was similar to AUCins/AUCglu (r = 0.71). In contrast to Stumvoll et al, our results in pregravid women suggested that IGI outperformed Stumvoll and AUCins/AUCglu outside of pregnancy. Despite this, Stumvoll was the only OGTT-based insulin secretory response measure that was significantly correlated with IVGTT-determined insulin secretory response prior to pregnancy and across gestation. Thus, we suggest that it should be the measure of choice in studies of beta-cell function during pregnancy, particularly in longitudinal studies that have measures that span the pregnant and nonpregnant state. While AUCins/AUCglu performed even better than Stumvoll during pregnancy, its association with first-phase insulin response prior to pregnancy was weaker, diminishing enthusiasm for its use in studies that include both pregnant and nonpregnant participants. In addition, obtaining measurements to calculate AUCins/AUCglu is more burdensome, requiring multiple additional timepoints beyond the 30-minute timepoint needed for Stumvoll. Both Stumvoll and AUCins/AUCglu appeared to capture the longitudinal changes in insulin secretory response observed in our prior analysis based on IVGTT, making them both acceptable measures for epidemiologic studies of beta-cell function limited to pregnancy.
Strengths of our study include the use of multiple measures of insulin secretory response in the same participants at 3 study timepoints (pre-, early, and late pregnancy), the longitudinal design, and the focus on pregnancy physiology, an understudied area. Our study is limited by its small sample size, although conducting IVGTTs or clamp studies in a large number of pregnant women would be infeasible. The study is also limited by it being a secondary analysis of data collected more than 20 years ago, with a different method for insulin measurement than that which is most commonly used today. We could not calculate every index in every participant at every timepoint due to missing glucose or insulin levels for various reasons, including participant dropout, loss of intravenous access, and nausea/vomiting. Finally, we did not measure C-peptide levels, which might have provided additional information about endogenous insulin secretion.
In conclusion, we have validated OGTT-based insulin secretory response measures for use in pregnancy studies by comparing these measures to first -phase insulin response assessed by IVGTT. Our analysis provides evidence supporting the use of the Stumvoll first-phase index as the most accurate and easily performed measure of insulin secretory response during pregnancy, with AUCins/AUCglu providing similar accuracy but a lengthier protocol. Researchers planning future studies of beta-cell function during pregnancy should preferentially use these dynamic measures over others when fasting and postload insulin and glucose levels are available.
Acknowledgments
We thank the clinical staff of the Clinical Research Unit of the Clinical Translational Science Center at MetroHealth Medical Center for their support in performing the laboratory assays and for research, nutritional and nursing support.
Financial Support
This work was supported in part by NICHD HD22965-19 (P.M.C.) and NCRR CTSA Ul1 RR 024989. C.E.P. is supported by career development awards from the National Institute of Diabetes and Digestive and Kidney Diseases (NIDDK) (K23DK113218) and the Robert Wood Johnson Foundation’s Harold Amos Medical Faculty Development Program. The data analysis was supported by Harvard Catalyst/Harvard University’s Clinical and Translational Science Center (National Center for Advancing Translational Sciences, National Institutes of Health Award UL 1TR002541) and financial contributions from Harvard University and its affiliated academic healthcare centers.
Author Contributions
C.E.P. and P.M.C. conceptualized the study. P.M.C. and L.H.G. collected the data. C.E.P. and J.J.L. planned and executed the analysis. C.E.P., J.J.L., J.C.F., and P.M.C. interpreted the results. C.E.P. wrote the manuscript. All authors reviewed and edited the manuscript.
Disclosure Summary
The authors disclose no conflict of interest.
Data Availability
Restrictions apply to the availability of some or all data generated or analyzed during this study to preserve patient confidentiality or because they were used under license. The corresponding author will on request detail the restrictions and any conditions under which access to some data may be provided.
References
- 1. Catalano PM, Tyzbir ED, Roman NM, Amini SB, Sims EA. Longitudinal changes in insulin release and insulin resistance in nonobese pregnant women. Am J Obstet Gynecol. 1991;165(6 Pt 1):1667-1672. [DOI] [PubMed] [Google Scholar]
- 2. Catalano PM, Tyzbir ED, Wolfe RR, et al. Carbohydrate metabolism during pregnancy in control subjects and women with gestational diabetes. Am J Physiol. 1993;264(1 Pt 1):E60-E67. [DOI] [PubMed] [Google Scholar]
- 3. Catalano PM, Huston L, Amini SB, Kalhan SC. Longitudinal changes in glucose metabolism during pregnancy in obese women with normal glucose tolerance and gestational diabetes mellitus. Am J Obstet Gynecol. 1999;180(4):903-916. [DOI] [PubMed] [Google Scholar]
- 4. Buchanan TA, Metzger BE, Freinkel N, Bergman RN. Insulin sensitivity and B-cell responsiveness to glucose during late pregnancy in lean and moderately obese women with normal glucose tolerance or mild gestational diabetes. Am J Obstet Gynecol. 1990;162(4):1008-1014. [DOI] [PubMed] [Google Scholar]
- 5. Powe CE, Huston Presley LP, Locascio JJ, Catalano PM. Augmented insulin secretory response in early pregnancy. Diabetologia. 2019;62(8):1445-1452. [DOI] [PMC free article] [PubMed] [Google Scholar]
- 6. Parsons JA, Brelje TC, Sorenson RL. Adaptation of islets of Langerhans to pregnancy: increased islet cell proliferation and insulin secretion correlates with the onset of placental lactogen secretion. Endocrinology. 1992;130(3):1459-1466. [DOI] [PubMed] [Google Scholar]
- 7. Rieck S, White P, Schug J, et al. The transcriptional response of the islet to pregnancy in mice. Mol Endocrinol. 2009;23(10):1702-1712. [DOI] [PMC free article] [PubMed] [Google Scholar]
- 8. H K, Toyofuku Y, Lynn FC, et al. Serotonin regulates pancreatic beta cell mass during pregnancy. Nat Med. 2010;16(7):804-808. [DOI] [PMC free article] [PubMed] [Google Scholar]
- 9. Ohara-Imaizumi M, H K, Yoshida M, et al. Serotonin regulates glucose-stimulated insulin secretion from pancreatic beta cells during pregnancy. Proc Natl Acad Sci U S A. 2013;110(48):19420-19425. [DOI] [PMC free article] [PubMed] [Google Scholar]
- 10. Karnik SK, Chen H, McLean GW, et al. Menin controls growth of pancreatic beta-cells in pregnant mice and promotes gestational diabetes mellitus. Science. 2007;318(5851):806-809. [DOI] [PubMed] [Google Scholar]
- 11. Stumvoll M, Mitrakou A, Pimenta W, et al. Use of the oral glucose tolerance test to assess insulin release and insulin sensitivity. Diabetes Care. 2000;23(3):295-301. [DOI] [PubMed] [Google Scholar]
- 12. Stumvoll M, Haeften T V, Fritsche A, Gerich J. Oral glucose tolerance test indexes for insulin sensitivity and secretion based on various availabilities of sampling times. Diabetes Care. 2001;24(4):796-797. [DOI] [PubMed] [Google Scholar]
- 13. Seltzer HS, Allen EW, Herron AL Jr, Brennan MT. Insulin secretion in response to glycemic stimulus: relation of delayed initial release to carbohydrate intolerance in mild diabetes mellitus. J Clin Invest. 1967;46(3):323-335. [DOI] [PMC free article] [PubMed] [Google Scholar]
- 14. Sluiter WJ, Erkelens DW, Reitsma WD, Doorenbos H. Glucose tolerance and insulin release, a mathematical approach I. Assay of the beta-cell response after oral glucose loading. Diabetes. 1976;25(4):241-244. [DOI] [PubMed] [Google Scholar]
- 15. Matthews DR, Hosker JP, Rudenski AS, Naylor BA, Treacher DF, Turner RC. Homeostasis model assessment: insulin resistance and beta-cell function from fasting plasma glucose and insulin concentrations in man. Diabetologia. 1985;28(7):412-419. [DOI] [PubMed] [Google Scholar]
- 16. Levy JC, Matthews DR, Hermans MP. Correct homeostasis model assessment (HOMA) evaluation uses the computer program. Diabetes Care. 1998;21(12):2191-2192. [DOI] [PubMed] [Google Scholar]
- 17. Matsuda M, DeFronzo RA. Insulin sensitivity indices obtained from oral glucose tolerance testing: comparison with the euglycemic insulin clamp. Diabetes Care. 1999;22(9):1462-1470. [DOI] [PubMed] [Google Scholar]
- 18. Kirwan JP, Huston-Presley L, Kalhan SC, Catalano PM. Clinically useful estimates of insulin sensitivity during pregnancy: validation studies in women with normal glucose tolerance and gestational diabetes mellitus. Diabetes Care. 2001;24(9):1602-1607. [DOI] [PubMed] [Google Scholar]
- 19. DeFronzo RA, Tobin JD, Andres R. Glucose clamp technique: a method for quantifying insulin secretion and resistance. Am J Physiol. 1979;237(3):E214-E223. [DOI] [PubMed] [Google Scholar]
- 20. Catalano PM, Wong WW, Drago NM, Amini SB. Estimating body composition in late gestation: a new hydration constant for body density and total body water. Am J Physiol. 1995;268(1 Pt 1):E153-E158. [DOI] [PubMed] [Google Scholar]
- 21. Haffner SM, Miettinen H, Stern MP. The homeostasis model in the San Antonio Heart Study. Diabetes Care. 1997;20(7):1087-1092. [DOI] [PubMed] [Google Scholar]
- 22. Tabak AG, Jokela M, Akbaraly TN, Brunner EJ, Kivimaki M, Witte DR. Trajectories of glycaemia, insulin sensitivity, and insulin secretion before diagnosis of type 2 diabetes: an analysis from the Whitehall II study. Lancet. 2009;373(9682):2215-2221. [DOI] [PMC free article] [PubMed] [Google Scholar]
Associated Data
This section collects any data citations, data availability statements, or supplementary materials included in this article.
Data Availability Statement
Restrictions apply to the availability of some or all data generated or analyzed during this study to preserve patient confidentiality or because they were used under license. The corresponding author will on request detail the restrictions and any conditions under which access to some data may be provided.


