

Abstract
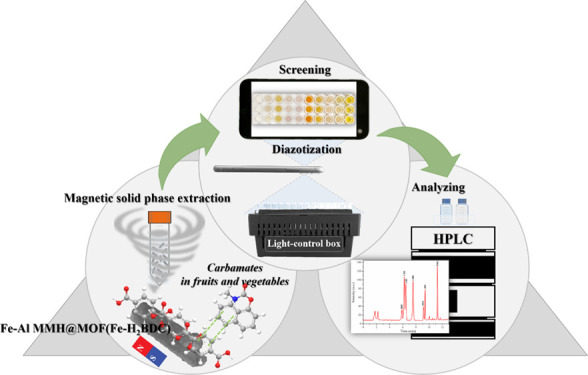
Magnetic sorbents based on iron–aluminum-mixed metal hydroxides composited with metal–organic frameworks (MOFs) were designed and synthesized using different benzoate ligands, including terephthalic acid, 2-aminoterephthalic acid, 2,5-dihydroxyterephthalic acid, 1,3,5-benzenetricarboxylic acid, and 1,2,4,5-benzenetetracarboxylic acid. The magnetic MOF derived from terephthalic acid ligand exhibited an excellent extraction efficiency, with adsorption capacities in the range of 2193–4196 mg kg–1, and was applied for magnetic solid-phase extraction (MSPE) of carbamate pesticides, that is, bendiocarb, carbosulfan, carbofuran, carbaryl, propoxur, isoprocarb, and promecarb. Simple digital image colorimetry based on the diazotization reaction and high-performance liquid chromatography (HPLC) were utilized for fast screening and quantification purposes, respectively. A good analytical performance for a simple screening approach using portable equipment was obtained with detection limits in the range of 1.0–18.0 μg L–1. Under the optimized MSPE-HPLC conditions, the entire developed procedure provided a wide linear range between 0.015 and 1000 μg L–1, low limits of detection, and limits of quantitation ranging from 0.005 to 0.090 and 0.015–0.300 μg L–1, respectively. Enrichment factors up to 184 were achieved. The intra- and interday relative standard deviations were below 6.7 and 9.4%, respectively. The proposed MSPE-digital image colorimetry and MSPE-HPLC methods were successfully applied for screening and determining carbamate pesticides in fruits and vegetables. The recoveries were obtained in a satisfactory range of 71.5–122.8%. This discovery has led to the development of integration methods using newly synthesized sorbent materials for the enrichment of carbamate pesticides prior to their analysis in complicated samples. The developed MSPE coupled with digital image colorimetry was efficient for fast carbamate contamination screening, while MSPE-HPLC offered a sensitive analytical methodology for quantifying contaminated samples.
1. Introduction
Carbamate pesticides have been widely employed to control and protect agricultural products from diseases and destruction caused by pests, insects, fungi, weeds, and rodents. They have been applied across an enormous area of agricultural production in some developing countries, with no regard for health risks or safety. Carbamate pesticides can potentially impact humans via inhibition of acetyl cholinesterase enzyme activity.1,2 Their toxicities have an impact not only on pests but also on humans, animals, and the environment. In some reports, severe pollution was discovered in water supplies, sediment, and the surface of fruits and vegetables.1−4 Due to their toxicities, the World Health Organization (WHO) and Food and Agriculture Organization (FAO) have categorized carbamate pesticides as high hazards.1 In addition, the U.S. Environmental Protection Agency (USEPA), the U.S. Food and Drug Administration (US-FDA), and the European Union (EU) have set the maximum residue limits (MRLs) of carbamates in different fruits and vegetables in the range from 0.01 to 0.20 mg kg–1.5
Instrumental techniques, such as high-performance liquid chromatography (HPLC), gas chromatography (GC), and spectrophotometry, have been employed in carbamate pesticide analytical assays.6−8 These techniques offer a high sensitivity and precision; however, expensive equipment and complicated operating processes are disadvantages. A screening test based on colorimetry is an attractive choice because of its speed, simplicity, portability, and low cost. This method offers a rapid way to check for the presence of an ostensibly target analyte in a sample.9 The diazotization reaction has been employed for the colorimetric detection of carbamate pesticides by converting a primary aromatic amine into the corresponding diazonium salt and subsequently exhibiting azo dye,10 which can be easily detected using a smartphone-assisted digital image coupled with a mobile application. Even though colorimetric screening tests are unable to detect specific chemical components in samples, they are sufficient for detecting target analytes. Only contaminated samples might be subjected to advanced analytical instruments for further identification and quantification.
Because carbamate pesticides are found in trace amounts in plants, vegetables, and fruits, determining their presence via direct instrumental analysis is difficult, and some are undetectable due to instrument limitations and a strong interference. Therefore, the preconcentration technique is needed. Recently, magnetic solid-phase extraction (MSPE) has become an intriguing extraction technology that relies on the use of magnetic sorbents to enrich trace analytes from large sample volumes to detectable levels. Sensitivity, selectivity, less organic solvent usage, easy and rapid extraction, sorbent reusability, and energy savings are the benefits of MSPE over traditional extraction methods.11,12 One of the most important parameters influencing MSPE efficiency is the choice of magnetic sorbent. Numerous magnetic sorbents have been reported for determining pesticides, such as magnetic carbon-based materials,13 magnetic inorganic nanomaterials,14 magnetic metal–organic frameworks (MOFs),15 polymeric coating magnetic materials,16 and magnetic ionic liquids.17
Due to their potential properties, such as extremely high surface areas, multiple interacting sites, uniform pore sizes, ease of synthesis, a tunable structure and pore size, and stability, MOFs have received much attention in terms of sample preparation technology.18 The multifunctional groups involved in ligand structures have a significant potential in the adsorption of target analytes due to the characteristics of π–π interactions, hydrogen bonding, electrostatic interactions, and nonpolar interactions. The type of metal ions and organic ligands, as well as the network structure layout, determine the characteristics and properties of MOFs.19 Therefore, incorporating MOFs with other materials can play an important role in the selective extraction of target analytes.18 The benzoate-based structure is one of the most attractive ligands for MOF construction because it can increase MOF stability while also offering an excellent active site. Over the past decade, several benzoate ligand-based MOFs have been extensively applied in various fields, such as the Zr-based MOF of UiO-66 and UiO-67, HKUST-1 ([Cu3(1,3,5-benzenetricarboxylate)2(H2O)3]), MIL-53(Al)–NH2, MIL-101(Fe)–NH2, MIL-100, MIL-47, MOF-74, MIL-125, MOF-76, and MOF-5 ([Zn4O(1,4-benzenedicarboxylate)3]).18,20 Recently, the integration of magnetic functionality with MOFs has been proposed to improve the solid-phase separation and increase the applicability of MOFs in the MSPE approach.21 Several types of magnetic MOFs (MMOFs) have been produced and employed in MSPE for the enrichment of various organic contaminants in environmental samples, with a few studies on carbamate residues being published.15,22
In this work, we aimed to develop a new magnetic sorbent for applications in the MSPE of carbamate pesticides, including bendiocarb (BDC), carbosulfan (CBS), carbofuran (CBF), carbaryl (CBR), propoxur (PPX), isoprocarb (IPC), and promecarb (PMC). Prior to fast screening by digital image colorimetry and quantification by high-performance liquid chromatography coupled with UV detection (HPLC-UV), a variety of MMOFs were designed using different benzoate ligands and composited with iron–aluminum-mixed metal hydroxides (Fe–Al MMHs) via solvothermal reactions. The synthesized materials were characterized, and their adsorptive performances toward the target analytes were compared. Herein, the recommended integration methodologies for analyzing carbamate pesticides in fruits and vegetables have been successfully implemented.
2. Results and Discussion
2.1. Characterization of Fe–Al MMH@MOF Composites
The crystalline structures of the as-prepared magnetic sorbents were studied using XRD. In Figure 1a, the diffraction peaks of bare Fe–Al MMH were clearly observed at 2θ values of 21.3, 30.3, 35.6, 37.2, 43.3, 57.2, and 62.8°, belonging to the (110), (220), (311), (311), (422), (511), and (440) crystal planes of both the γ-Fe2O3 and γ-Al(OH)3 phases, respectively, which were in accordance with JCPDS no. 39-1346 for γ-Fe2O3 and JCPDS card no. 7-0324 for γ-Al(OH)3. The measured diffraction peaks of the MMOF composites were quite similar to those of bare Fe–Al MMH (Figure 1b–f). In addition, three characteristic peaks at 2θ values of 9.0, 18.0, and 33.0° were present in the XRD patterns of Fe–Al MMH@MOF(Fe–H2BDC) and Fe–Al MMH@MOF(Fe–H2BDC-NH2) (Figure 1b,c),23,24 while the XRD pattern of Fe–Al MMH@MOF(Fe–H3BTC) exhibited a peak at a 2θ value of 9.0° (Figure 1e).25 There was no additional peak in the pattern of Fe–Al MMH@MOF(Fe–H2BDC-DH). This could be explained by the broadened XRD diffraction originating from the presence of a magnetic material, which hindered framework formation between the H2BDC-DH ligand and the metal center, resulting in low crystallinity. The XRD pattern of Fe–Al MMH@MOF(Fe–H4BTtC) was clearly visible at 2θ values of 8.0, 9.0, 10.5, 20.0, and 33.0°, as shown in Figure 1f, which corresponded to an earlier study.26 As a result, the Fe–Al MMH and MOF composites were successfully synthesized using the described approach.
Figure 1.
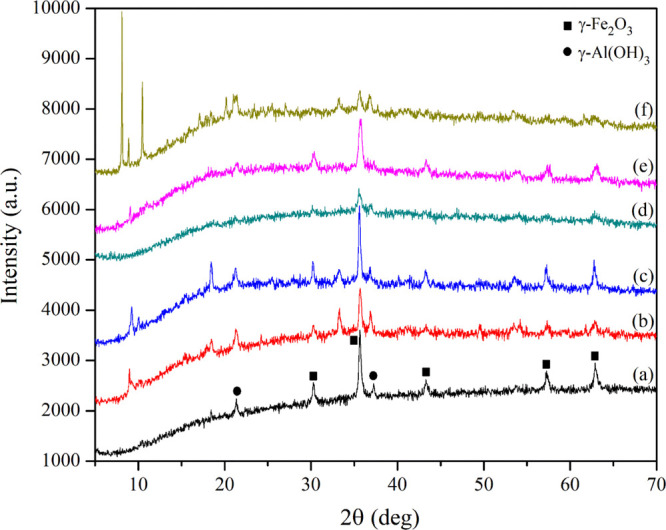
XRD patterns of (a) bare Fe–Al MMH, (b) Fe–Al MMH@MOF(Fe–H2BDC), (c) Fe–Al MMH@MOF(Fe–H2BDC-NH2), (d) Fe–Al MMH@MOF(Fe–H2BDC-DH), (e) Fe–Al MMH@MOF(Fe–H3BTC), and (f) Fe–Al MMH@MOF(Fe–H4BTtC).
The functional groups of the as-prepared magnetic sorbents were investigated via FTIR. As illustrated in Figure 2a, the characteristic vibration peaks of Fe–Al MMH were clearly observed at 1622 and below 1000 cm–1, corresponding to the −OH bending of water molecules and the metal–oxygen stretching and bending modes of Fe–Al MMH, respectively. After being composited with benzoate ligand MOFs, the FTIR spectra presented in Figure 2b–f showed two peaks located in the range of 1570–1590 and 1380–1420 cm–1, which were assigned to the vibration mode of −COOH and the stretching vibration of the C=C bond of the aromatic ring in the benzoate ligand, respectively.23,24,27−29 In addition, three vibration peaks due to the primary amine-substituted aromatic ring could be found at 3498 and 3382 cm–1 for the N–H stretching mode and 1257 cm–1 for the stretching mode of aromatic C–N (Figure 2c).24 The vibrations of the C–OH (Ar–OH) groups of the H2BDC-DH ligand were observed at 1200 cm–1 (Figure 2d). The characteristic vibration peaks of Fe–Al MMH were likewise detected in the same position after being composited with MOFs. Consequently, it was concluded that Fe–Al MMH could be composited well with benzoate ligand MOFs using the described method.
Figure 2.
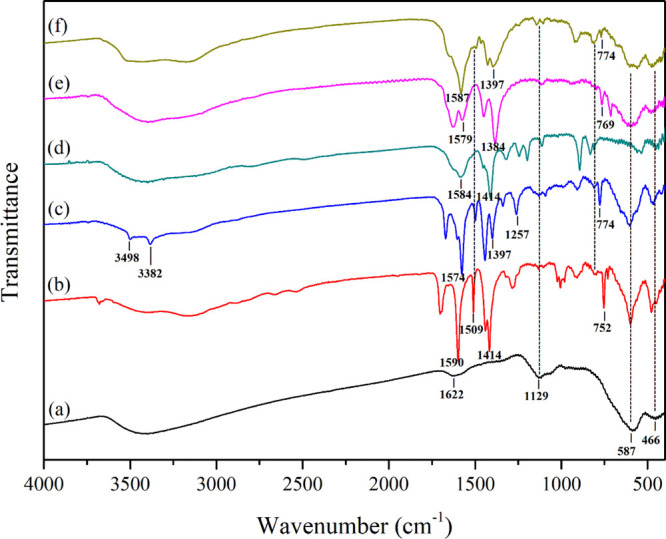
FTIR spectra of (a) bare Fe–Al MMH, (b) Fe–Al MMH@MOF(Fe–H2BDC), (c) Fe–Al MMH@MOF(Fe–H2BDC-NH2), (d) Fe–Al MMH@MOF(Fe–H2BDC-DH), (e) Fe–Al MMH@MOF(Fe–H3BTC), and (f) Fe–Al MMH@MOF(Fe–H4BTtC).
The morphological characteristics of bare Fe–Al MMH and magnetic MOF composites were investigated using SEM and TEM techniques. The SEM image of Fe–Al MMH in Figure S1a shows mixed morphologies of rod-like shapes with lengths of 60–80 nm and widths of 200–250 nm and spherical-like shapes with a particle size of 85 nm. After compositing with MOFs, Fe–Al MMH nanoparticles were connected to the surface of MOF, resulting in agglomeration (Figure S1b–f). The H2BDC and H2BDC-NH2 ligands produced stick-like morphologies with particle sizes of 74 × 216 and 122 × 125 nm, respectively. On the other hand, the inclusion of H2BDC-DH, H3BTC, and H4BTtC ligands resulted in irregular shapes with substantial aggregation, as illustrated in Figure S1d–f. The existence of a nonuniform structure could be explained by the obstruction of framework formation due to Fe–Al MMH.
Figure S2 shows the TEM images of bare Fe–Al MMH and Fe–Al MMH@MOF composites. An individual Fe–Al MMH exhibited a mixed morphology with a low dispersion (Figure S2a). The magnetic particles were well dispersed on the surface of MOF(Fe–H2BDC) and MOF(Fe–H2BDC-NH2), as shown in Figure S2b,c, respectively. Partial aggregation of Fe–Al MMH on nonuniform MOFs produced from H2BDC-DH, H3BTC, and H4BTtC ligands was observed, as shown in Figure S2d,e. As a result, the acquired TEM images demonstrated the existence of a composite material between Fe–Al MMH and MOFs in its as-prepared procedure.
The composition of the synthesized materials was investigated using an elemental analysis. The percentage ratios of C/H/N were obtained as 20.29:1.48:0.90 for Fe–Al MMH@MOF(Fe–H2BDC), 17.80:1.62:3.58 for Fe–Al MMH@MOF(Fe–H2BDC-NH2), 9.46:1.49:1.39 for Fe–Al MMH@MOF(Fe–H2BDC-DH), 13.95:1.75:1.15 for Fe–Al MMH@MOF(Fe–H3BTC), and 17.09:1.82:1.74 for Fe–Al MMH@MOF(Fe–H4BTtC). The existence of C, H, and N was due to the benzoate ligand self-assembled framework on Fe–Al MMH.
The BET surface area was calculated to be 54.25, 126.94, 51.35, 42.18, 184.67, and 28.82 m2 g–1 for Fe–Al MMH, Fe–Al MMH@MOF(Fe–H2BDC), Fe–Al MMH@MOF(Fe–H2BDC-NH2), Fe–Al MMH@MOF(Fe–H2BDC-DH), Fe–Al MMH@MOF(Fe–H3BTC), and Fe–Al MMH@MOF(Fe–H4BTtC), respectively. The surface areas of most composite materials were diminished, except for the usage of H2BDC and Fe–H3BTC as ligands due to the unique structure of 1,4-benzenedicarboxylic acid and 1,3,5-benzenetricarboxylic acid ligands fabricating porous networks with metal centers in MOF structures.30,31 The reduced specific surface area of composite materials could be due to the partial pore cavities being blocked by the Fe–Al MMH nanoparticles. TGA and the magnetic properties of the as-prepared sorbents were studied, and the data obtained are shown in Figures S3 and S4, respectively. A discussion is provided in the Supporting Information.
2.2. Optimization of the MSPE Conditions
Several parameters influencing the extraction efficiencies of the MSPE were examined, including the type of the sorbent and amount, desorption time, adsorption time, desorption solvent and its volume, sample volume, and pH. The diazotization colorimetry of a single representative analyte (CBR) was employed to determine the optimal MSPE condition. All experimental parameters were examined in triplicate. The extraction efficiency expressed as the relative intensity was used as a response.
Six magnetic sorbents, including Fe–Al MMH, Fe–Al MMH@MOF(Fe–H2BDC), Fe–Al MMH@MOF(Fe–H2BDC-NH2), Fe–Al MMH@MOF(Fe–H2BDC-DH), Fe–Al MMH@MOF(Fe–H3BTC), and Fe–Al MMH@MOF(Fe–H4BTtC), were compared for the MSPE of CBR. As shown in Figure 3a, Fe–Al MMH@MOF(Fe–H2BDC) exhibited an excellent extraction efficiency. This could possibly be due to the favorable π–π interactions between Fe–Al MMH@MOF(Fe–H2BDC) and CBR. For other benzoate ligands, the hindrance effect was the main factor that diminished the opportunity for interaction. Therefore, Fe–Al MMH@MOF(Fe–H2BDC) was selected as a sorbent for the MSPE of carbamates.
Figure 3.

Optimization of the MSPE conditions: (a) sorbent type, (b) sorbent amount, (c) desorption time, (d) adsorption time, (e) desorption solvent, (f) desorption volume, (g) adsorption volume, and (h) sample pH.
The amount of Fe–Al MMH@MOF(Fe–H2BDC) sorbent was varied between 1 and 100 mg, and all other parameters were controlled, including 10 mL of the sample solution (pH 6–7), a 1 min adsorption and desorption duration, and 0.5 mL of acetonitrile as a desorption solvent. The results in Figure 3b show that the extraction efficiency increased with an increasing sorbent amount from 1 to 10 mg. A reduction in the extraction efficiency was observed when the sorbent amount was increased from 10 to 100 mg, implying that the degree of adsorption was higher than desorption. Hence, 10 mg of the sorbent were selected.
In the present work, vortex agitation was applied for acceleration during the adsorption and desorption processes. The different desorption times ranging from 15 to 120 s were examined by keeping the other parameters constant as follows: 10 mg of the sorbent, 10 mL of the sample solution (pH 6–7), 1 min adsorption time, and 0.5 mL of acetonitrile as the desorption solvent. The extraction efficiency was gradually enhanced by increasing the desorption time from 15 to 45 s and remained almost constant between 45 and 75 s (Figure 3c). Therefore, a desorption time of 45 s was selected as a suitable condition. The effect of the adsorption time was also investigated in the range from 15 to 120 s. The extraction efficiency increased with an increasing adsorption time from 15 to 45 s and dramatically decreased beyond this point (Figure 3d). This could be due to the redissolution of the analyte into the sample solution. In conclusion, the optimum adsorption time was 45 s.
The choice of the desorption solvent is key to obtaining the quantitative elution of the analyte from a solid sorbent. Several desorption solvents were studied, including acetone, ethyl acetate, methanol, ethanol, and acetonitrile. Ethyl acetate gave a lower desorption power due to the different log Kow value (0.73) compared to other studied solvents (acetone, −0.24; acetonitrile, −0.34; methanol, −0.77, and ethanol, −0.31). An excellent extraction was found using acetone and acetonitrile as desorption solvents (Figure 3e). This could be due to the high solvent eluotropic strength of acetone and acetonitrile, which are appropriate for disrupting any analyte–sorbent interactions. However, acetone affected the diazotization reaction.32 Therefore, acetonitrile was selected.
The desorption solvent volume is important for improving the enrichment factor of the MSPE method. In this work, the volume of acetonitrile was optimized in the range of 0.25–4.00 mL. Then, N2-assisted evaporation was performed, and the residue was redissolved in 150 μL of acetonitrile before the analysis. The extraction efficiency gradually increased with an increasing desorption solvent volume from 0.25 to 3 mL and then remained almost constant afterward (Figure 3f). Therefore, an optimum desorption solvent volume of 3 mL was chosen for further experiments.
The sample volume in the range of 5–40 mL was varied, as shown in Figure 3g. The extraction efficiency sharply increased with an increasing sample volume from 5 to 35 mL. Consequently, a sample volume of 35 mL was chosen as the optimal condition. The effect of the sample pH on the adsorption performance was examined in the range of 4 to 10. It could be observed that the adsorption efficiency reached a maximum plateau when the sample pH was adjusted to between 6 and 8 (Figure 3h). At higher pH values, the adsorption efficiency decreased. These findings suggested that under weakly basic conditions, the proposed MMOFs and CBR were beneficial for interaction. Therefore, a sample pH of 8 was ideally suited for applying this MSPE method.
2.3. Method Validation
Under the abovementioned optimal conditions, the analytical performance of the proposed MSPE procedure coupled with digital image colorimetry and HPLC-UV for the analysis of carbamate pesticides was evaluated. In the present work, seven carbamate pesticides were tested, including BDC, CBS, CBF, CBR, PPX, IPC, and PMC. The obtained digital images of each carbamate pesticide are shown in Figure 4, and their analytical performances are summarized in Table S1. A good linearity in the range of 3.0–100.0 μg L–1 was observed for determining the mixed carbamates. Low limits of detection (LODs) and limits of quantification (LOQs) were found in the ranges of 1.0–18.0 and 3.0–60.0 μg L–1, respectively, for the examination in deionized (DI) water. The sensitivity of the screening method was examined in long beans and oranges as representatives of vegetable and fruit matrices. The LODs and LOQs in real samples were found to be in the range of 1.0–20.0 and 3.0–60.0 μg L–1, respectively. This finding exhibited the good analytical performance for a simple analytical approach using portable equipment.
Figure 4.
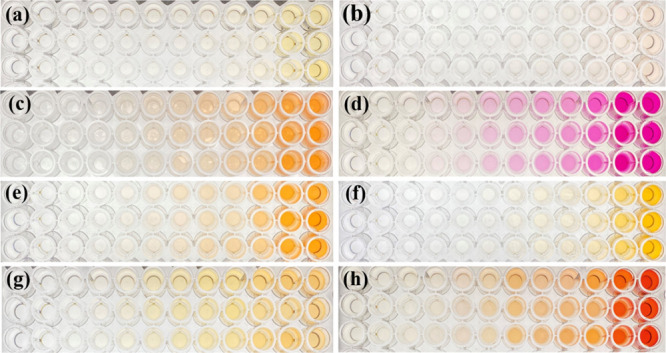
Digital image colorimetry analysis of carbamate pesticides by the MSPE method: (a) BDC, (b) CBS, (c) CBF, (d) CBR, (e) PPX, (f) IPC, (g) PMC, and (h) mixed seven carbamate pesticides.
The proposed MSPE procedure was coupled with HPLC-UV for further quantification of carbamate pesticides. The chromatograms of seven carbamate pesticides obtained from MSPE-HPLC and direct HPLC are displayed in Figure 5, and all validation data are shown in Table 1. Wide linear calibration graphs were in the range of 0.015–1000 μg L–1 (depending on the analyte). The LODs and LOQs were 0.005–0.090 and 0.015–0.300 μg L–1, respectively. A good extraction performance in terms of enrichment factors (EFs) reached 184, 174, and 159 in DI water, long beans, and oranges, respectively. The method precisions reported in terms of the relative standard deviations (RSDs) of the intra- and interday experiments ranged from 1.9 to 6.7 and 4.2 to 9.4%, respectively. The validation data confirm that the MSPE coupled with digital image colorimetry is efficient for screening assays, while the MSPE-HPLC system is recommended for the further quantification of carbamate residues.
Figure 5.
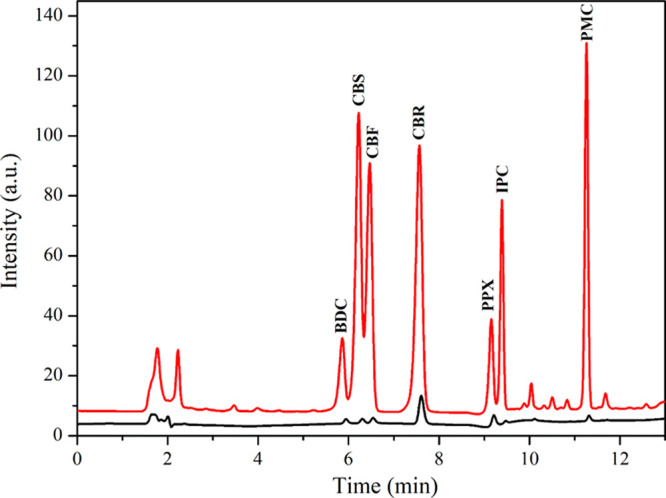
Chromatograms of carbamate pesticides obtained from MSPE-HPLC compared with direct HPLC. Concentrations for the MSPE-HPLC method: 400 μg L–1 BDC, 250 μg L–1 CBS and CBF, 50 μg L–1 CBR, 300 μg L–1 PPX and IPC, and 200 μg L–1 PMC; direct HPLC: 1000 μg L–1 each.
Table 1. Analytical Performance of the Proposed MSPE-HPLC Method.
| RSD
(%) |
EF |
|||||||||
|---|---|---|---|---|---|---|---|---|---|---|
| analyte | linear range (μg L–1) | linear equation | R2 | LOD (μg L–1) | LOQ (μg L–1) | intraday (n = 5) | interday (n = 5 × 3) | DI water | long beans | oranges |
| BDC | 0.300–1000 | y = 0.68x – 5.80 | 0.9841 | 0.090 | 0.300 | 6.7 | 8.7 | 29 | 20 | 18 |
| CBS | 0.180–1000 | y = 2.22x – 48.00 | 0.9609 | 0.050 | 0.180 | 3.2 | 6.2 | 81 | 71 | 71 |
| CBF | 0.180–1000 | y = 1.60x – 29.00 | 0.9601 | 0.050 | 0.180 | 4.7 | 9.4 | 51 | 49 | 42 |
| CBR | 0.015–1000 | y = 29.63x – 251.00 | 0.9950 | 0.005 | 0.015 | 1.9 | 4.2 | 184 | 174 | 159 |
| PPX | 0.180–1000 | y = 2.30x + 18.90 | 0.9836 | 0.050 | 0.180 | 3.3 | 6.9 | 83 | 79 | 71 |
| IPC | 0.300–1000 | y = 1.00x + 18.70 | 0.9782 | 0.090 | 0.300 | 3.6 | 9.4 | 118 | 114 | 112 |
| PMC | 0.100–1000 | y = 2.63x – 25.90 | 0.9850 | 0.030 | 0.100 | 4.4 | 8.0 | 127 | 114 | 111 |
The extraction efficiency of the MSPE method using Fe–Al MMH@MOF(Fe–H2BDC) as a sorbent was evaluated in terms of the extraction recovery (ER), calculated from ER % = (Cos × Vos) × 100/(Caq × Vaq), where Cos and Caq are the analyte concentration in the final organic solvent and the initial concentration of the analyte in the aqueous phase (μg L–1), respectively, and Vos and Vaq are the volumes of the final organic solvent and aqueous phase, respectively. In this study, the ERs of 19.25, 45.05, 24.40, 92.58, 36.08, 49.08, and 68.46% were obtained for BDC, CBS, CBF, CBR, PPX, IPC, and PMC, respectively.
2.4. Sorption Capacity of the Proposed Magnetic Sorbents
The maximum sorption capacity (Qmax) of the proposed sorbent can be calculated from Qmax = (C0 – Cf)V/m, where Qmax is the maximum sorption capacity (mg kg–1), C0 and Cf are the initial and final concentrations of carbamate (mg L–1), respectively, V is the sample volume (L), and m is the mass (kg) of the Fe–Al MMH@MOF(Fe–H2BDC) sorbent. The results demonstrated that Fe–Al MMH@MOF(Fe–H2BDC) exhibited a high sorption capacity toward carbamate pesticides (in DI water) with Qmax values in the range of 2193–4196 mg kg–1. The Qmax values obtained from other sorbents were also studied and are summarized in Table S2. In addition, the Qmax values of the proposed Fe–Al MMH@MOF(Fe–H2BDC) sorbent were also examined in real sample matrices using long beans and oranges as representative vegetable and fruit matrices, respectively. The sample matrices reduce the adsorption capacity of the sorbent, as the interferences contained in real samples may block the active site.
The adsorption capability was primarily dependent on the type of benzoate ligands. The proposed Fe–Al MMH@MOF(Fe–H2BDC) contained a large conjugated system and suitable substituted groups. The strong electron-withdrawing group of the carboxylic-substituted group could polarize the electron density away from the aromatic ring (electron-deficient), while carbamate structures were electron-rich aromatic; thus, the π–π interaction was preferable.33 On the other hand, amine and hydroxyl substitution groups contributed electron density to aromatics, causing weak π–π interactions. Additionally, intermolecular hydrogen bonds between carbamates and sorbent could be formed due to the proton acceptor O-substituents of MOF(Fe–H2BDC). The possible interaction during the MSPE process is proposed in Figure 6.
Figure 6.

Possible interaction between the sorbent and carbamate pesticide.
2.5. Reusability of the Fe–Al MMH@MOF(Fe–H2BDC) Sorbent
The reusability of the as-prepared Fe–Al MMH@MOF(Fe–H2BDC) sorbent was evaluated. To regenerate the sorbent, vortex-assisted washing with 10 mL of methanol was performed, and the sorbent was subsequently dried under a N2 stream before applying the next MSPE. As presented in Figure S5, there was no obvious loss in the extraction efficiency after eight successive extraction cycles. Therefore, the Fe–Al MMH@MOF(Fe–H2BDC) sorbent has an excellent stability during the extraction procedure and could be reused in up to eight extraction cycles.
2.6. Analysis of Fruits and Vegetables
In this work, the synthesized Fe–Al MMH@MOF(Fe–H2BDC) was used as a sorbent for the MSPE of carbamate pesticides in fruits and vegetables, including guava, pomelo, pineapple, watermelon, oranges, mangos, grapes, long beans, and Chinese cabbage. The MSPE combined with digital image colorimetric screening method revealed carbamate pesticide contamination in all studied samples (Figure 7). Further quantitative determination with HPLC-UV was performed to confirm the contamination levels. The results are tabulated in Table 2. The HPLC results showed that BDC was observed in guava, watermelon, and mangos at concentrations of 181.1, 2958.1, and 103.1 μg kg–1, respectively. CBS was found in guava, pineapple, oranges, mangos, grapes, and long beans at concentrations of 220.4, 224.0, 219.3, 258.0, 238.3, and 235.4 μg kg–1, respectively. Contamination of CBF was inspected in guava and long beans at concentrations of 188.2 and 230.4 μg kg–1, respectively. CBR was observed in all studied samples, except for oranges and mangos. The maximum contamination of CBR was found in Chinese cabbage at 133.4 μg kg–1, while other samples were detected in the range of 86.0–95.2 μg kg–1. PPX was detected in guava and pomelo at concentrations of 16.2 and 9.2 μg kg–1, respectively. IPC was found in pomelo (215.0 μg kg–1), watermelon (287.3 μg kg–1), and mangos (207.1 μg kg–1). PMC was detected at 124.1 μg kg–1 in watermelon, 110.0 μg kg–1 in oranges, 111.1 μg kg–1 in mangos, and 106.3 μg kg–1 in long beans. Most of the investigated samples had lower levels of carbamate pesticide contamination than the MRLs set by the European Food Safety Authority (EFSA). However, the CBS levels in guava, pineapple, oranges, grapes, and long beans were above the MRLs, while the BDC levels in watermelon also exceeded the MRL. The recoveries for all carbamate pesticides in fruit and vegetable samples were in the acceptable range from 71.5 to 122.8%, with RSDs below 10.7%.
Figure 7.

Digital image colorimetry for screening carbamate pesticides in fruits and vegetables using the MSPE method: (a) blank, (b) guava, (c) pomelo, (d) pineapple, (e) watermelon, (f) oranges, (g) mangos, (h) long beans, (i) Chinese cabbage, and (j) grapes.
Table 2. Determination of Carbamates in Fruits and Vegetables Using the Proposed MSPE-HPLC Methoda.
| samples | BDC | CBS | CBF | CBR | PPX | IPC | PMC |
|---|---|---|---|---|---|---|---|
| guava, found (μg kg–1) | 181.1 (7.0) | 220.4 (0.3) | 188.2 (1.5) | 90.2 (1.0) | 16.2 (8.8) | ||
| %R1 (%RSD) | 108.8 (4.6) | 94.6 (7.9) | 98.8 (9.9) | 88.8 (10.2) | 87.8 (3.4) | 116 (7.0) | 84.4 (7.0) |
| %R2 (%RSD) | 116.7 (2.2) | 83.8 (1.2) | 110.1 (3.7) | 81.4 (5.1) | 97.5 (2.0) | 90.9 (10.5) | 88.6 (3.3) |
| %R3 (%RSD) | 121.3 (8.1) | 87.9 (10.9) | 120.8 (0.3) | 83.8 (7.7) | 97.3 (3.3) | 96.0 (10.9) | 84.4 (3.6) |
| pomelo, found (μg kg–1) | 86.0 (0.4) | 9.2 (9.5) | 215.0 (4.5) | ||||
| %R1 (%RSD) | 91.2.2 (8.3) | 77.5 (5.6) | 85.6 (6.7) | 76.4 (7.4) | 78.2 (10.1) | 115 (10.3) | 82.8 (4.5) |
| %R2 (%RSD) | 78.5 (4.5) | 82.3 (2.4) | 81.6 (1.9) | 76.4 (2.3) | 95.3 (4.5) | 91.2 (9.2) | 76.2 (6.0) |
| %R3 (%RSD) | 75.5 (8.9) | 77.2 (2.6) | 79.0 (1.1) | 76.1 (1.2) | 118.7 (7.7) | 82.5 (4.2) | 77.0 (7.3) |
| pineapple, found (μg kg–1) | 224.0 (0.1) | 89.0 (1.1) | |||||
| %R1 (%RSD) | 82.3 (2.1) | 83.8 (2.5) | 115 (10.2) | 103.8 (10.1) | 80.0 (6.0) | 86.0 (4.2) | 71.5 (2.2) |
| %R2 (%RSD) | 115.0 (5.8) | 101.9 (7.2) | 101.5 (5.6) | 76.6 (2.5) | 106.3 (5.1) | 98.8 (5.1) | 80.0 (7.7) |
| %R3 (%RSD) | 74.9 (0.1) | 74.8 (4.8) | 76.6 (5.9) | 75.7 (10.8) | 114.5 (7.0) | 81.7 (9.3) | 72.8 (3.3) |
| watermelon, found (μg kg–1) | 2958.1 (4.2) | 88.0 (1.8) | 287.3 (9.8) | 124.1 (2.7) | |||
| %R1 (%RSD) | 112.7 (10.2) | 116.2 (7.3) | 103.8 (7.4) | 82.0 (6.3) | 122.6 (4.4) | 112.0 (9.5) | 110.3 (8.4) |
| %R2 (%RSD) | 122.7 (10.1) | 89.3 (4.7) | 121.6 (5.2) | 92.6 (4.9) | 112.2 (4.9) | 111.0 (4.9) | 117.8 (10.8) |
| %R3 (%RSD) | 122.5 (6.0) | 75.1 (6.0) | 80.0 (7.1) | 80.5 (7.4) | 121.5 (5.2) | 77.7 (6.2) | 87.1 (7.0) |
| oranges, found (μg kg–1) | 219.3 (0.2) | 110.0 (2.1) | |||||
| %R1 (%RSD) | 113.7 (5.4) | 118.3 (3.1) | 94.2 (8.6) | 78.4 (1.4) | 78.0 (2.3) | 116.0 (4.6) | 102.4 (10.1) |
| %R2 (%RSD) | 117.5 (2.4) | 103.2 (6.5) | 98.3 (7.4) | 78.9 (2) | 77.7 (3.3) | 118.5 (3.3) | 84.5 (8.8) |
| %R3 (%RSD) | 77.3 (1.8) | 91.9 (0.7) | 82.6 (4.4) | 81.0 (3.1) | 81.2 (0.4) | 96.0 (3.5) | 83.3 (3.0) |
| mangos, found (μg kg–1) | 103.1 (2.5) | 258.0 (1.6) | 207.1 (0.8) | 111.1 (0.5) | |||
| %R1 (%RSD) | 84.3 (5.3) | 116.2 (3.9) | 86.7 (6.5) | 80.1 (3.9) | 79.7 (7.0) | 76.7 (6.0) | 76.8 (6.0) |
| %R2 (%RSD) | 80.2 (7.8) | 78.1 (4.4) | 80.9 (4.6) | 80.0 (2.0) | 88.8 (7.3) | 81.9 (9.5) | 79.6 (5.2) |
| %R3 (%RSD) | 75.9 (1.4) | 75.3 (5.8) | 83.8 (4.5) | 75.3 (0.5) | 75.2 (3.3) | 85.7 (2.4) | 74.7 (1.0) |
| grapes, found (μg kg–1) | 238.3 (0.2) | 86.2 (0.2) | |||||
| %R1 (%RSD) | 84.3 (8.8) | 85.3 (3.7) | 85.8 (8.4) | 83.0 (3.3) | 77.7 (9.0) | 77.3 (1.5) | 79.3 (3.9) |
| %R2 (%RSD) | 78.6 (5.7) | 79.5 (1.2) | 91.0 (1.2) | 83.0 (2.6) | 95.3 (7.1) | 92.3 (0.5) | 80.3 (3.8) |
| %R3 (%RSD) | 75.5 (1.5) | 81.3 (4.9) | 87.0 (3.6) | 93.3 (3.5) | 84.0 (4.3) | 90.4 (4.2) | 78.0 (8.5) |
| long beans, found (μg kg–1) | 235.4 (1.3) | 230.4 (1.7) | 95.2 (0.5) | 106.3 (2.8) | |||
| %R1 (%RSD) | 116.7 (7.3) | 101.2 (5.1) | 11.3 (7.9) | 110.7 (2.7) | 79.1 (4.8) | 88.7 (10.7) | 102.2 (6.4) |
| %R2 (%RSD) | 99.4 (4.1) | 105.3 (4.8) | 119.1 (5.5) | 104.6 (8.2) | 79.1 (2.6) | 84.9 (8.1) | 84.5 (5.5) |
| %R3 (%RSD) | 81.6 (8.5) | 82.0 (5.0) | 84.6 (4.5) | 87.2 (3.7) | 76.6 (4.3) | 93.4 (5.7) | 80.6 (4.3) |
| Chinese cabbage, found (μg kg–1) | 133.4 (5.9) | 280.0 (10.9) | 123.1 (3.8) | ||||
| %R1 (%RSD) | 121.6 (3.7) | 122.8 (5.0) | 114.2 (7.9) | 116.7 (4.0) | 80.0 (8.2) | 114.7 (7.9) | 85.7 (8.9) |
| %R2 (%RSD) | 83.5 (9.2) | 111.7 (1.4) | 117.8 (2.9) | 105.6 (8.1) | 77.4 (8.0) | 88.3 (5.0) | 96.9 (5.1) |
| %R3 (%RSD) | 81.9 (5.9) | 77.4 (3.5) | 85.9 (5.6) | 87.6 (5.6) | 76.6 (5.8) | 89.7 (7.2) | 76.8 (5.2) |
The spiked concentrations for R1, R2, and R3 were 5.0, 50.0, and 500.0 μg kg–1, respectively.
2.7. Method Comparison
The proposed MSPE method using the Fe–Al MMH@MOF(Fe–H2BDC) sorbent for the analysis of carbamates was compared with other relevant MSPE methods based on MMOF sorbents (Table S3). A good linear range, low LODs and LOQs, a high adsorption capacity, and a high enrichment factor were achieved by the studied procedure. This technique exhibited better results than most other reported MSPE methods, except for using HPLC–MS/MS. This work is the first to show to couple MSPE with digital image colorimetry for rapid screening tests and with HPLC-UV for further identification and quantification. A newly developed method provides advantages, including a simple and rapid MSPE process, convenient screening test, and a high sensitivity and selectivity for quantification by HPLC. This method could be applied for the analysis of carbamate residues in various sample matrices.
3. Conclusions
In this work, an Fe–Al MMH@MOF(Fe–H2BDC) magnetic sorbent was successfully prepared via simple coprecipitation combined with solvothermal methods. Different types of benzoate ligands were compared to obtain a highly efficient sorbent for the enrichment of carbamate pesticides. A new strategy based on coupling MSPE with digital image colorimetry as a simple and rapid screening method and MSPE-HPLC as a quantification method was successfully developed. The proposed sorbent demonstrated an excellent extraction efficiency for carbamate pesticides in fruits and vegetables. This finding provides a new alternative strategy for the analysis of complex samples.
4. Experimental Section
4.1. Chemicals and Materials
All chemicals used for synthesis were of analytical reagent grade. Aluminum chloride hexahydrate was supplied by Sigma-Aldrich (Steinheim, Germany). Iron(II) ammonium sulfate hexahydrate and anhydrous iron(III) chloride were purchased from Carlo Erba (Milan, Italy) and Sigma-Aldrich (Steinheim, Germany), respectively. Sodium hydroxide and ethanol were obtained from Merck (Darmstadt, Germany). Terephthalic acid (H2BDC), 2,5-dihydroxyterephthalic acid (H2BDC-DH), and 1,3,5-benzenetricarboxylic acid (H3BTC) were supplied by Alfa Aesar (Lancashire, UK). 2-Aminoterephthalic acid (H2BDC-NH2) and 1,2,4,5-benzenetetracarboxylic acid (H4BTtC) were purchased from Sigma-Aldrich (Steinheim, Germany) and Acros Organics (Geel, Belgium), respectively. Sodium tetraborate and boric acid were obtained from KemAus (New South Wales, Australia). N,N-dimethylformamide (DMF) and acetone were obtained from RCI Labscan (Bangkok, Thailand). Methanol and ethyl acetate were purchased from Fisher Scientific (Geel, Belgium). Hydrochloric acid, 4′-aminoacetophenone (4AAP), and sodium nitrite were received from QRëC (New Zealand), Sigma-Aldrich (Steinheim, Germany), and Carlo Erba (Milan, Italy), respectively. Ortho-phosphoric acid was supplied by QRëC (Auckland, New Zealand). Acetonitrile (HPLC grade) was obtained from Merck (Darmstadt, Germany). All carbamate pesticide standards used had a purity above 99% and were purchased from Dr. Ehrenstorfer (Augsburg, Germany), including BDC, CBS, CBF, CBR, PPX, IPC, and PMC. Each carbamate stock standard solution of 1000 mg L–1 was prepared in methanol. Working solutions were prepared daily in water. Type 1 deionized water (18.2 MΩ cm) was obtained from a Simplicity ultrapure water system (Millipore, Darmstadt, Germany).
4.2. Instrumentation
The crystal structure of the as-prepared sorbents was investigated using a PANalytical EMPYREAN X-ray diffractometer (XRD) with monochromatic Cu Kα radiation (λ = 0.15406 nm) in a 2θ range of 10–80°. Fourier transform infrared (FTIR) spectra were recorded between 4000 and 400 cm–1 on a PerkinElmer Spectrum Two FTIR spectrometer using a standard KBr disk method. The size and morphology of the sorbents were investigated by an FEI Helios NanoLab G3 CX dual-beam scanning electron microscope with a focused ion beam (FIB-SEM) and an FEI Tecnai G2 20 transmission electron microscope (TEM). CHN analyses were performed on a PerkinElmer PE 2400CHNS analyzer. Thermogravimetric analysis (TGA) was performed on a Perkin Elmer Pyris Diamond TG-DTA instrument at a heating rate of 10 °C min–1 under a N2 atmosphere. The specific surface area and pore size of the materials were measured using a BELSORP-mini X (MicrotracBEL Corp., Japan). Magnetic properties were evaluated using a Lake Shore VSM 7403 vibrating sample magnetometer at 298 K with an applied magnetic field (H) of ±10000 Oersted (Oe). Digital images were taken using a smartphone camera (iPhone 11, Apple Inc., USA) in a lab-fabricated light-control box, and a Pixel Picker mobile application was employed to acquire pixel color information from images.
The HPLC system involved a binary pump, a manual injector with a sample loop of 10 μL, an Agilent 1260 Infinity II Multiple Wavelength Detector (MWD), and OpenLAB CDS Chemstation software for data acquisition. A Kinetex C18 analytical column (150 mm × 4.6 mm, 2.6 μm, Phenomenex Inc.) was used for the separation of carbamate pesticides. A mixture of acetonitrile (solvent A) and 0.1% acetic acid (solvent B) was used as the mobile phase at a flow rate of 0.7 mL min–1. The gradient system was initially set at 40% of solvent A for 6 min and then ramped to 60% of solvent A and maintained for 3 min. After that, the program was increased to 70% of solvent A and subsequently held at an interval time of 11–15 min. Finally, solvent A was set to 40% before running in the next sample. The detection wavelength for all carbamates was set at 220 nm.
4.3. Synthesis of Fe–Al MMH@MOF Composites
The MMOFs were prepared based on a one-pot solvothermal method. Fe–Al MMH was synthesized using the a coprecipitation method.34 The mixture (100 mL) of Fe(NH4)2(SO4)2 (5 mmol) and AlCl3·6H2O (2.5 mmol) was vigorously mixed, and then 50 mL of 3 mol L–1 NaOH was added with agitation for 10 min. The Fe–Al MMH product was magnetically collected and sequentially washed several times with water and DMF. The product was then dispersed in 10 mL of DMF, and the H2BDC solution (1 mmol in 20 mL of DMF) was added with vigorous agitation for 30 min. After that, the mixture was transferred into a Teflon-lined stainless steel autoclave and heated in an oven at 150 °C for 12 h. After cooling to room temperature, the product, defined as Fe–Al MMH@MOF(Fe–H2BDC), was magnetically separated and washed with methanol before drying at 80 °C overnight.23 Different benzoate ligands, including H2BDC-NH2, H2BDC-DH, H3BTC, and H4BTtC, were used instead of H2BDC for the synthesis of other MMOFs, and the products were defined as Fe–Al MMH@MOF(Fe–H2BDC-NH2), Fe–Al MMH@MOF(Fe–H2BDC-DH), Fe–Al MMH@MOF(Fe–H3BTC), and Fe–Al MMH@MOF(Fe–H4BTtC), respectively.
4.4. Sample Collection and Preparation
In this work, different fresh fruits and vegetables, including guava, pomelo, pineapple, watermelon, oranges, mangos, grapes, long beans, and Chinese cabbage, were analyzed. All samples were purchased from local markets in Khon Kaen Province, Thailand. The samples (3.5 g) were crushed and extracted by shaking in 35 mL of 10% methanol at 40 °C for 1 h. The supernatant was collected after centrifugation at 6000 rpm and adjusted to pH 8 with a 0.1 mol L–1 borate buffer solution before applying the MSPE process.
4.5. MSPE Procedure
To apply Fe–Al MMH@MOF(Fe–H2BDC) as a sorbent for the MSPE of carbamate pesticides, 10 mg of sorbent was added to 35 mL of the sample solution and vigorously vortexed for 45 s. After that, the analyte-extracted magnetic sorbent was separated using an external magnet, and the supernatant was decanted. The desorption process was performed by adding 3 mL of acetonitrile into the sorbent, followed by 45 s of vortexing. The solid sorbent was then magnetically separated. The eluate was filtered through a 0.45 μm nylon membrane filter and then evaporated to dryness using a N2 evaporator, and the residue was redissolved in 150 μL of acetonitrile prior to the analysis.
4.6. Digital Image Colorimetry
Digital image colorimetry was conducted based on the diazotization reaction: 4AAP (25 μL, 1 mmol L–1), 10 μL of NaNO2 (0.05% w/v), and 25 μL of HCl (0.1 mol L–1) were sequentially added to a 96-well plate and equilibrated for 5 min. After that, 100 μL of the extracted sample was added, followed by adding 50 μL of NaOH (0.2 mol L–1) and 40 μL of water.35,36 The reaction plate was placed in a light-control box and photographed by a smartphone camera. The R, G, and B intensity values of each pixel were retrieved using the Pixel Picker mobile application.
Acknowledgments
The financial support from the Materials Chemistry Research Center, Khon Kaen University, is gratefully acknowledged. R.B. thanks the National Research Council of Thailand (NRCT) and Khon Kaen University for supporting the Mid-Career Research grant (NRCT5-RSA63003-05).
Supporting Information Available
The Supporting Information is available free of charge at https://pubs.acs.org/doi/10.1021/acsomega.2c00596.
SEM images; TEM images; characterization of the materials by TGA; TG curves; magnetic property of the sorbent; reusability; analytical performance of the proposed MSPE coupled with digital image colorimetry; sorption capacity of the studied magnetic sorbents; and comparison of the proposed MSPE method with other methods based on MMOF sorbents for carbamate determination (PDF)
The authors declare no competing financial interest.
Supplementary Material
References
- Montiel-León J. M.; Duy S. V.; Munoz G.; Verner M.-A.; Hendawi M. Y.; Moya H.; Amyot M.; Sauvé S. Occurrence of pesticides in fruits and vegetables from organic and conventional agriculture by QuEChERS extraction liquid chromatography tandem mass spectrometry. Food Control 2019, 104, 74–82. 10.1016/j.foodcont.2019.04.027. [DOI] [Google Scholar]
- Gao T.; Wang J.; Wu Q.; Wang C.; Wang Z. A graphene oxide–based composite for solid-phase extraction of carbamate pesticides from vegetables. Food Anal. Methods 2020, 13, 690–698. 10.1007/s12161-019-01685-3. [DOI] [Google Scholar]
- Wu Q.; Zhao G.; Feng C.; Wang C.; Wang Z. Preparation of a graphene-based magnetic nanocomposite for the extraction of carbamate pesticides from environmental water samples. J. Chromatogr. A 2011, 1218, 7936–7942. 10.1016/j.chroma.2011.09.027. [DOI] [PubMed] [Google Scholar]
- Peris A.; Eljarrat E. Multi-residue Methodologies for the Analysis of Non-polar Pesticides in Water and Sediment Matrices by GC–MS/MS. Chromatographia 2021, 84, 425–439. 10.1007/s10337-021-04026-x. [DOI] [Google Scholar]
- Oliveira T. M. B. F.; Ribeiro F. W. P.; Sousa C. P.; Salazar-Banda G. R.; de Lima-Neto P.; Correia A. N.; Morais S. Current overview and perspectives on carbon-based (bio)sensors for carbamate pesticides electroanalysis. Trac. Trends Anal. Chem. 2020, 124, 115779. 10.1016/j.trac.2019.115779. [DOI] [Google Scholar]
- Wong J. W.; Wang J.; Chow W.; Carlson R.; Jia Z.; Zhang K.; Hayward D. G.; Chang J. S. Perspectives on liquid chromatography-high-resolution mass spectrometry for pesticide screening in foods. J. Agric. Food Chem. 2018, 66, 9573–9581. 10.1021/acs.jafc.8b03468. [DOI] [PubMed] [Google Scholar]
- Chullasat K.; Huang Z.; Bunkoed O.; Kanatharana P.; Lee H. K. Bubble-in-drop microextraction of carbamate pesticides followed by gas chromatography-mass spectrometric analysis. Microchem. J. 2020, 155, 104666. 10.1016/j.microc.2020.104666. [DOI] [Google Scholar]
- Didpinrum P.; Ponhong K.; Siriangkhawut W.; Supharoek S.-a.; Grudpan K. A cost-effective spectrophotometric method based on enzymatic analysis of jackfruit latex peroxidase for the determination of carbaryl and its metabolite 1-napthol residues in organic and chemical-free vegetables. Food Anal. Methods 2020, 13, 433–444. 10.1007/s12161-019-01667-5. [DOI] [Google Scholar]
- Fan Y.; Li J.; Guo Y.; Xie L.; Zhang G. Digital image colorimetry on smartphone for chemical analysis: A review. Measurement 2021, 171, 108829. 10.1016/j.measurement.2020.108829. [DOI] [Google Scholar]
- Santalad A.; Srijaranai S.; Burakham R.; Sakai T.; Deming R. L. Acid-induced cloud-point extraction coupled to spectrophotometry for the determination of carbaryl residues in waters and vegetables. Microchem. J. 2008, 90, 50–55. 10.1016/j.microc.2008.03.007. [DOI] [Google Scholar]
- Jiang H.-L.; Li N.; Cui L.; Wang X.; Zhao R.-S. Recent application of magnetic solid phase extraction for food safety analysis. Trac. Trends Anal. Chem. 2019, 120, 115632. 10.1016/j.trac.2019.115632. [DOI] [Google Scholar]
- Herrero-Latorre C.; Barciela-García J.; García-Martín S.; Peña-Crecente R. M.; Otárola-Jiménez J. Magnetic solid-phase extraction using carbon nanotubes as sorbents: A review. Anal. Chim. Acta 2015, 892, 10–26. 10.1016/j.aca.2015.07.046. [DOI] [PubMed] [Google Scholar]
- Wang Y.; Ma R.; Xiao R.; Wu Q.; Wang C.; Wang Z. Preparation of a magnetic porous carbon with hierarchical structures from waste biomass for the extraction of some carbamates. J. Sep. Sci. 2017, 40, 2451–2458. 10.1002/jssc.201601439. [DOI] [PubMed] [Google Scholar]
- Du L.; Wang X.; Liu T.; Li J.; Wang J.; Gao M.; Wang H. Magnetic solid-phase extraction of organophosphorus pesticides from fruit juices using NiFe2O4@polydopamine@Mg/Al-layered double hydroxides nanocomposites as an adsorbent. Microchem. J. 2019, 150, 104128. 10.1016/j.microc.2019.104128. [DOI] [Google Scholar]
- Wang M.; Wang J.; Wang K.; Chen T.; Wang J. Magnetic porous carbon derived from Zn/Co metal–organic framework as an adsorbent for extraction and determination of carbamates. Microchim. Acta 2020, 187, 507. 10.1007/s00604-020-04426-0. [DOI] [PubMed] [Google Scholar]
- Wang X.; Feng T.; Wang J.; Hao L.; Wang C.; Wu Q.; Wang Z. Preparation of magnetic porous covalent triazine-based organic polymer for the extraction of carbamates prior to high performance liquid chromatography-mass spectrometric detection. J. Chromatogr. A 2019, 1602, 178–187. 10.1016/j.chroma.2019.06.046. [DOI] [PubMed] [Google Scholar]
- Ben Attig J.; Latrous L.; Zougagh M.; Ríos Á. Ionic liquid and magnetic multiwalled carbon nanotubes for extraction of N-methylcarbamate pesticides from water samples prior their determination by capillary electrophoresis. Talanta 2021, 226, 122106. 10.1016/j.talanta.2021.122106. [DOI] [PubMed] [Google Scholar]
- Maya F.; Palomino Cabello C.; Frizzarin R. M.; Estela J. M.; Turnes Palomino G.; Cerdà V. Magnetic solid-phase extraction using metal-organic frameworks (MOFs) and their derived carbons. Trac. Trends Anal. Chem. 2017, 90, 142–152. 10.1016/j.trac.2017.03.004. [DOI] [Google Scholar]
- Hasan Z.; Jhung S. H. Removal of hazardous organics from water using metal-organic frameworks (MOFs): Plausible mechanisms for selective adsorptions. J. Hazard. Mater. 2015, 283, 329–339. 10.1016/j.jhazmat.2014.09.046. [DOI] [PubMed] [Google Scholar]
- Ma J.; Wu G.; Li S.; Tan W.; Wang X.; Li J.; Chen L. Magnetic solid-phase extraction of heterocyclic pesticides in environmental water samples using metal-organic frameworks coupled to high performance liquid chromatography determination. J. Chromatogr. A 2018, 1553, 57–66. 10.1016/j.chroma.2018.04.034. [DOI] [PubMed] [Google Scholar]
- Meteku B. E.; Huang J.; Zeng J.; Subhan F.; Feng F.; Zhang Y.; Qiu Z.; Aslam S.; Li G.; Yan Z. Magnetic metal–organic framework composites for environmental monitoring and remediation. Coord. Chem. Rev. 2020, 413, 213261. 10.1016/j.ccr.2020.213261. [DOI] [Google Scholar]
- Liu X.; Wang C.; Wu Q.; Wang Z. Magnetic porous carbon-based solid-phase extraction of carbamates prior to HPLC analysis. Microchim. Acta 2016, 183, 415–421. 10.1007/s00604-015-1664-8. [DOI] [Google Scholar]
- Zhang X.; Yuan N.; Li Y.; Han L.; Wang Q. Fabrication of new MIL-53(Fe)@TiO2 visible-light responsive adsorptive photocatalysts for efficient elimination of tetracycline. Chem. Eng. J. 2022, 428, 131077. 10.1016/j.cej.2021.131077. [DOI] [Google Scholar]
- Xie Q.; Li Y.; Lv Z.; Zhou H.; Yang X.; Chen J.; Guo H. Effective adsorption and removal of phosphate from aqueous solutions and eutrophic water by Fe-based MOFs of MIL-101. Sci. Rep. 2017, 7, 3316. 10.1038/s41598-017-03526-x. [DOI] [PMC free article] [PubMed] [Google Scholar]
- Nehra M.; Dilbaghi N.; Singhal N. K.; Hassan A. A.; Kim K.-H.; Kumar S. Metal organic frameworks MIL-100(Fe) as an efficient adsorptive material for phosphate management. Environ. Res. 2019, 169, 229–236. 10.1016/j.envres.2018.11.013. [DOI] [PubMed] [Google Scholar]
- Xia C.; Min Y.; Sun W.; Yang K.; Wu Y. Syntheses, crystal structures, and properties of two dinuclear iron(III) complexes constructed with 1,2,3,5-benzenetetracarboxylic acid and chelating N-donor auxiliary coligands. J. Coord. Chem. 2018, 71, 12–21. 10.1080/00958972.2018.1428312. [DOI] [Google Scholar]
- del Rio M.; Grimalt Escarabajal J. C.; Turnes Palomino G.; Palomino Cabello C. Zinc/Iron mixed-metal MOF-74 derived magnetic carbon nanorods for the enhanced removal of organic pollutants from water. Chem. Eng. J. 2022, 428, 131147. 10.1016/j.cej.2021.131147. [DOI] [Google Scholar]
- Akarçay Ö.; Kurtoğlu S. F.; Uzun A. Ammonia decomposition on a highly-dispersed carbon-embedded iron catalyst derived from Fe-BTC: Stable and high performance at relatively low temperatures. Int. J. Hydrogen Energy 2020, 45, 28664–28681. 10.1016/j.ijhydene.2020.07.188. [DOI] [Google Scholar]
- Wang J.-L.; Hou K.-L.; Bai F.-Y.; Xing Y.-H.; Shi Z. Hydrothermal synthesis, crystal structure, and photoluminescence of novel lanthanide metal organic frameworks constructed from 1,4-benzene-dicarboxylic acid and 1,2,4,5-benzenetetracarboxylic acid as ligands. Struct. Chem. 2012, 23, 275–285. 10.1007/s11224-011-9870-4. [DOI] [Google Scholar]
- Nivetha R.; Gothandapani K.; Raghavan V.; Jacob G.; Sellappan R.; Bhardwaj P.; Pitchaimuthu S.; Kannan A. N. M.; Jeong S. K.; Grace A. N. Highly porous MIL-100(Fe) for the hydrogen evolution reaction (HER) in acidic and basic media. ACS Omega 2020, 5, 18941–18949. 10.1021/acsomega.0c02171. [DOI] [PMC free article] [PubMed] [Google Scholar]
- Karimi Alavijeh R.; Akhbari K. Biocompatible MIL-101(Fe) as a smart carrier with high loading potential and sustained release of curcumin. Inorg. Chem. 2020, 59, 3570–3578. 10.1021/acs.inorgchem.9b02756. [DOI] [PubMed] [Google Scholar]
- Masoud N. K.; Sakla A. B.; Sawiris Z.; Yassa N. A. Coupling of diazonium salts with acetone. J. Chem. Soc., Perkin Trans. 1 1975, 2, 1312–1315. 10.1039/p29750001312. [DOI] [Google Scholar]
- Martinez C. R.; Iverson B. L. Rethinking the term “pi-stacking”. Chem. Sci. 2012, 3, 2191–2201. 10.1039/c2sc20045g. [DOI] [Google Scholar]
- Boontongto T.; Burakham R. Eco-friendly fabrication of a magnetic dual-template molecularly imprinted polymer for the selective enrichment of organophosphorus pesticides for fruits and vegetables. Anal. Chim. Acta 2021, 1186, 339128. 10.1016/j.aca.2021.339128. [DOI] [PubMed] [Google Scholar]
- Huang Y.; Shi W.; Zhang C.; Li L.; Wen H. Diazo-coupling spectrophotometric determination of nitrogen oxides in the air. Atmos. Pollut. Res. 2016, 7, 333–338. 10.1016/j.apr.2015.10.011. [DOI] [Google Scholar]
- Melchert W. R.; Rocha F. R. P. A greener and highly sensitive flow-based procedure for carbaryl determination exploiting long pathlength spectrophotometry and photochemical waste degradation. Talanta 2010, 81, 327–333. 10.1016/j.talanta.2009.12.005. [DOI] [PubMed] [Google Scholar]
Associated Data
This section collects any data citations, data availability statements, or supplementary materials included in this article.