Abstract
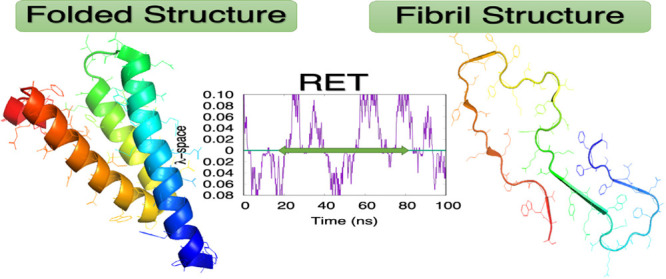
Overexpression of serum amyloid A (SAA) can lead to a form of amyloidosis where the fibrils are made of SAA fragments, most often SAA1–76. Using Replica Exchange with Tunneling, we study the conversion of a SAA1–76 chain between the folded conformation and a fibril conformation. We find that the basins in the free energy landscape corresponding to the two motifs are separated by barriers of only about 2–3 kBT. Crucial for the assembly into the fibril structure is the salt bridge 26E–34K that provides a scaffold for forming the fibril conformation.
1. Introduction
Various illnesses, such as inflammatory bowel disease, rheumatoid arthritis, or certain cancers, can cause overexpression of serum amyloid A (SAA) to concentrations 1000 times higher than what is seen under healthy conditions. The resulting elevated risk for misfolding and aggregation leads in some cases to AA amyloidosis where damage from SAA-fibril deposits to tissues and organs adds to the symptoms and complicates treatment of the primary disease.1−5 For a review of recent experimental and theoretical work on SAA and other amyloids, see, for instance, ref (6). Given the damaging effects of SAA amyloids, it is therefore necessary for therapeutic intervention to understand the process of unfolding of the functional SAA structure and its reorganization into the conformation seen in the experimentally resolved fibrils.
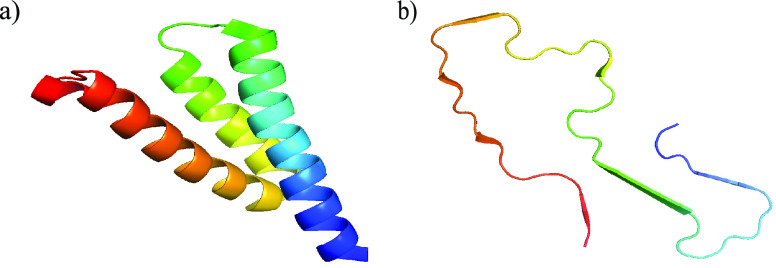
Involved in cholesterol transport and the regulation of inflammation, the 104-residue long SAA forms hexamers.7 We have studied in previous work8 the conditions that lead to decay of the hexamer, cleavage of the released chains, and subsequent misfolding of the resulting fragments (most commonly SAA1–76), which afterward may associate into the SAA fibrils. We observed a competition between the fast degradation of SAA fragments and the tendency of these fragments to form amyloids. Hence, in order to intervene, it is necessary to understand the kinetics of fibril formation. For this purpose, we study in the present paper now explicitly the conversion of SAA by modeling this process in all-atom simulations relying on a physical force field. As it is difficult for molecules of this size to obtain sufficient statistics from regular molecular dynamics, we utilize an enhanced sampling technique that was designed specifically by us for the investigation of structural transitions. Our technique, Replica Exchange with Tunneling (RET),9−12 allows us to observe the interconversion with sufficient detail to characterize important intermediates. Studying for a SAA1–76 fragment (Figure 1) the transition between a conformation as seen in the folded and functional protein (PDB-ID: 4IP8)13 and the conformation seen in the experimentally resolved fibril structure (PDB-ID: 6MST),14 we find a characteristic sequence of events for this conversion that we relate to our earlier work and experimental measurements. Note that while the fibril model 6MST was derived under nonphysiological conditions, our results are not limited by the choice of the fibril model. While we ignore in the simulation setup that amyloid fibrils from diseased tissue may be structurally different from such in vitro formed SAA fibrils,15 such polymorphism will be also seen with our RET approach, given sufficient sampling.
Figure 1.
Structures of serum amyloid A for the fragment SAA1–76 of the folded monomer (PDB-ID: 4IP8) (a) and for the chain in a fibril (segment SAA2–55, PDB-ID: 6MST) (b). The N-terminal residues are colored in blue.
2. Materials and Methods
2.1. Replica Exchange with Tunneling
Deriving from computer simulations the mechanism by which SAA assumes its fibril form requires an exhaustive and accurate sampling of the free energy landscape of the protein. This, however, is a difficult task as typical time scales in protein simulations are only on the order of microseconds. We have proposed in earlier work9−12 a variant of the Hamilton Replica Exchange method16,17 as a way to increase sampling for the special case of transitions between well-characterized states. For this purpose, we set up in our approach a ladder of replicas, each coupling a “physical” model with a structure-based model. On one side of the ladder, the structure-based model drives the physical system toward the native state of SAA, while on the other side the bias is toward the fibril. The replica-depending strength of the coupling is controlled by a parameter λ that is maximal at the two ends and zero for the central replica. Exchange moves between neighboring replicas lead to a random walk along the ladder by which the SAA conformation changes from one motif into the other. Accepting or rejecting these exchange moves with the criterion commonly used in Replica Exchange Sampling18 guarantees that the correct and unbiased distribution of the (unbiased) physical model will be sampled at λ = 0. However, the acceptance probability becomes vanishingly small for large systems. In order to avoid this problem, we conditionally accept the exchange and rescale the velocities of atoms in the two conformations A (moving from replica 1 to replica 2) and B (moving from replica 2 to replica 1):
| 1 |
such that the total energy at both replicas stays the same before and after the exchange. After the exchange, the systems on the two replica evolve by microcanonical molecular dynamics, exchanging potential and kinetic energy. Once the velocity distribution for each replica approaches the one expected at the given temperature, the final configuration B̂ = (q̂B, v̂B) on replica 1 has a comparable potential energy to that of the configuration A, while the potential energy of  = (q̂A,v̂A) on replica 2 will be close to that of the configuration B. Defining ΔEphy(i) = Ephyi(q̂A) – Ephyi(qB), and accordingly ΔEGo(i) and ΔEλ(i), the exchange is accepted with probability
| 2 |
If rejected, the simulation continues with configurations A (on replica 1) and B (on replica 2). We have shown that this Replica Exchange with Tunneling (RET) procedure leads to the correct distribution for sufficiently large systems and sufficiently long microcanonical segments; for details, see refs (9 and 10).
2.2. Simulation Setup
In order to study the interconversion of the serum amyloid A (SAA) native and fibril conformations, we describe in our RET simulations the “physical” model of the system by an all-atom energy function, the CHARMM36m force field19 in conjunction with TIP3P20 water molecules. The SAA1–76 fragment and 18, 376 water molecules are put in a box of edge size 8.3 nm with periodic boundary conditions and the system neutralized with two sodium ions. The SAA fragment is capped with an acetyl group and a methylamine group on the N-terminus and the C-termini, respectively. Start configurations are generated from the experimentally resolved structure of the full-size monomer as deposited in the Protein Data Bank (PDB-ID: 4IP8)13 by discarding residues 77–104 and randomizing the resulting fragment SAA1–76 in a 1 ns simulation at 1500 K, followed by another simulation of 1 ns at 310 K. After this, visual inspection for loss of the secondary structure follows a final minimization of the resulting conformation. The biasing Go-model uses as target structures the fragment SAA1–76 as derived from the PDB-model 4IP8 after discarding residues 77–104 and the fibril model as deposited in the PDB under PDB-ID: 6MST.14 As the fibril model is only for the fragment SAA2–56, we had to add an arginine as the first residue and the C-terminal residues 57–76 by using CHIMERA.21 With the so-generated two target structures as input for the SMOG-Server22 at http://smog-server.org, we derive then expressions for the corresponding Go-model energies EGo. Note that masses in the Go-models are scaled by a factor 14.21 to account for the lack of hydrogen atoms in the Go-models. Finally, we couple “physical” and Go-models by an energy Eλ as defined in refs (23) and (24), which quantifies the similarity between the two models. The strength of the coupling differs between the replicas. We used the following distribution of λ-parameters for the 24 replicas: λ = 0.08, 0.07, 0.06, 0.05, 0.04, 0.03, 0.02, 0.01, 0.007, 0.006, 0.005, 0, 0, 0.005, 0.01, 0.02, 0.03, 0.04, 0.05, 0.06, 0.07, 0.08, 0.09, 0.1. Note that for the replicas 0–10 the coupling between the physical model and a Go-model is defined by the native conformation, while for replicas 13–23 the physical model is coupled with a Go-model defined by the fibril model. In order to avoid an odd number of replicas, we use two central replicas with λ = 0 (replicas 11 and 12), where the physical model is not biased by a Go-model.
The above setup is implemented in a version of GROMACS 4.5.6,25 used by us to compare our data with earlier work. Hydrogen bonds are constrained for both the physical and Go models using the LINCS algorithm26 leading to a time step of 2 fs. The van der Waals cutoffs are set to 1.2 nm, and the Velocity Verlet algorithm27 is used to integrate the equations of motion. Temperature is controlled by the v-rescale thermostat.28 Note that our implementation of the RET algorithm requires different temperatures for each replica, which therefore slightly changes between 310 and 310.23 K (in steps of 0.01 K). The length of the microcanonical segment is set to 1 ps in a RET move. Two independent trajectories of 100 and 85 ns were generated, taking measurements only from the replica where λ = 0, i.e., where the physical model is not biased by any Go-term. Allowing for convergence of each trajectory, we are left with a total of 125 ns for analyzing the free energy landscape of the system.
2.3. Analysis Tools and Protocols
We use GROMACS tools25 and the MDTraj29 software package in the analysis of the RET trajectories for measuring the root mean square deviation (RMSD), dihedral angles of residues, and number of contacts. Secondary structure analysis and evaluation of free energy landscapes is done by in-house scripts. The transition pathway between native and fibril SAA conformations is derived from the free energy landscape projected on the RMSD to the respective structures. Using Dijkstra’s algorithm30 as implemented in the MEPSA software,31 we construct for this purpose a minimum (free) energy pathway between the two corresponding minima, allowing us to identify the barriers among different minima along the pathway. While this pathway may not be the optimal (i.e., the physical) pathway, we found the method in past work32 reliable and less costly than transition path sampling,33−35 the string method,36,37 the kinetic network model,38 traveling-salesman based automated path searching (TAPS),39 or other competing approaches. For visualization, we use the PyMOL software.40
3. Results and Discussion
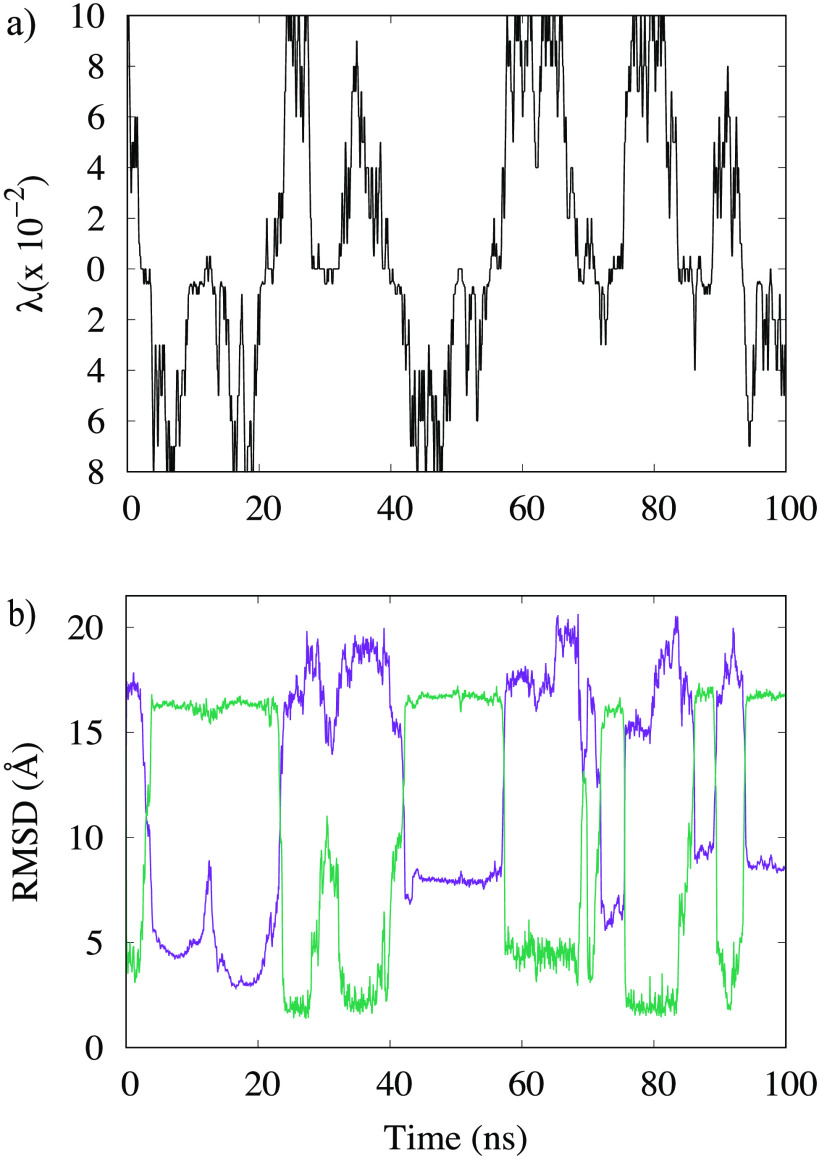
We argue that the computational difficulties in simulating the conversion between native and fibril SAA conformations is alleviated in our variant of Replica Exchange Sampling. In order to support this assumption, we show in Figure 2a the walk of a typical realization of our system along the ladder of replicas. At the start time (t = 0), the physical system sits on a replica, where it is biased with λ = 0.1 toward the folded structure but walks numerous times between this replica and the opposite end-point of the ladder where the physical system is with λmax = 0.08 maximally biased toward the fibril. The average exchange rate between neighboring replicas along the ladder is ∼25%. Monitoring the respective root mean square deviation (RMSD) toward both folded and fibril structure, we show in Figure 2b that this walk through λ-space induces indeed interconversion between the two motifs.
Figure 2.
(a) A typical example of a replica walking through λ space starting from a replica where the physical model is initially biased toward the folded SAA structure. While the system walks between a replica with bias toward the folded structure (upper half) and a replica with bias toward the fibril structure (lower half), its configuration changes accordingly. This can be seen in (b), where we show the corresponding time evolution of the RMSD to the native structure (in magenta) and the fibril structure (in green).
The higher rate of transitions allows for a more exhaustive sampling of the free energy landscape. A measure for the efficiency of our method, and a lower limit on the number of independent configurations sampled at the λ = 0 replica, is the number of walks across the whole ladder, from the replica with maximal bias toward the folded structure to the one with maximal bias toward the fibril, and back. The number of such tunneling events is inverse to the average time needed to cross the ladder (termed by us the tunneling time). The higher the number of tunneling events, the shorter the tunneling time and the more efficient our approach will be. This convergence of the simulation is checked by comparing for two distinct time intervals the free energy landscape projected on the two distances introduced above. Resemblance of the data for these two intervals suggests that the simulation has converged after 10 ns, and therefore, we use the last 90 ns of this specific trajectory for our analysis. In this time span, we find at least four tunneling events with an average tunneling time of ∼27 ns.
While small, the existence of at least a few tunneling events gives us confidence in the reliability of our data at λ = 0, i.e., at a replica where the “physical” model of our system is not biased toward either structure. For instance, we show in Figure 3 the free energy landscape of the SAA1–76 chain projected on the root mean square deviation (RMSD) to either folded or fibril conformation. This landscape is characterized by two prominent basins corresponding to either folded or fibril conformations, which are observed with frequencies of about 10% and 4%, respectively. The interconversion process corresponds to a path connecting the two basins. We have shown in earlier work32 that the physical path does not necessarily correspond to the ones seen in tunneling events as RET relies on an unphysical dynamic. Hence, in order to find a more realistic pathway, we have used the MEPSA software31 to determine the minimum energy pathway. This pathway, drawn as a black line in the landscape, proceeds through a series of basins and appears to be thermodynamically reasonable. Note that by construction this minimum energy pathway does not connect specific configurations but bins. Each bin contains a certain number of configurations sampled throughout the simulations. These configurations may differ in their secondary structure or the native contacts seen in either the folded or the fibril structure. The frequency with which the three quantities are observed allows one to identify five distinct regions along the pathway that correlate with the basins and barriers of the landscape. These regions are labeled as A to E in Figure 3, and characteristic conformations for these regions are shown in Figure 4, where in the case of region A (characterized by a high frequency of folded conformations) and region E (rich in fibril-like conformations) these characteristic conformations are superimposed on the respective reference structures. Region C appears to be a transition region spanning a large range of diverse conformations. Note, however, that the barrier height is only between two and three kBT.
Figure 3.
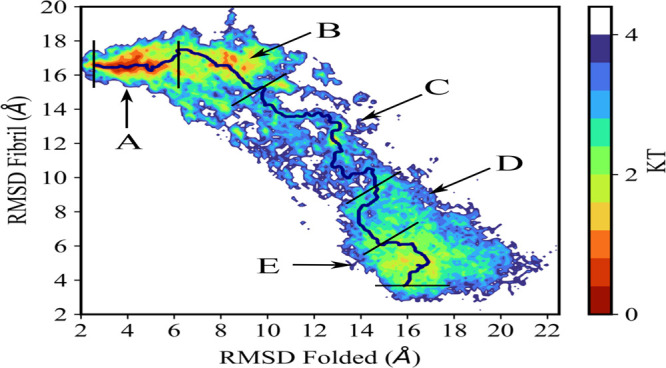
Free energy landscape as obtained from RET simulations, with data taken at λ = 0, i.e., where the physical models are not biased by any Go-term. Energies are listed in units of kT. The prospective transition pathway is drawn in black, and the five regions crossed by this path are marked in capital letters.
Figure 4.
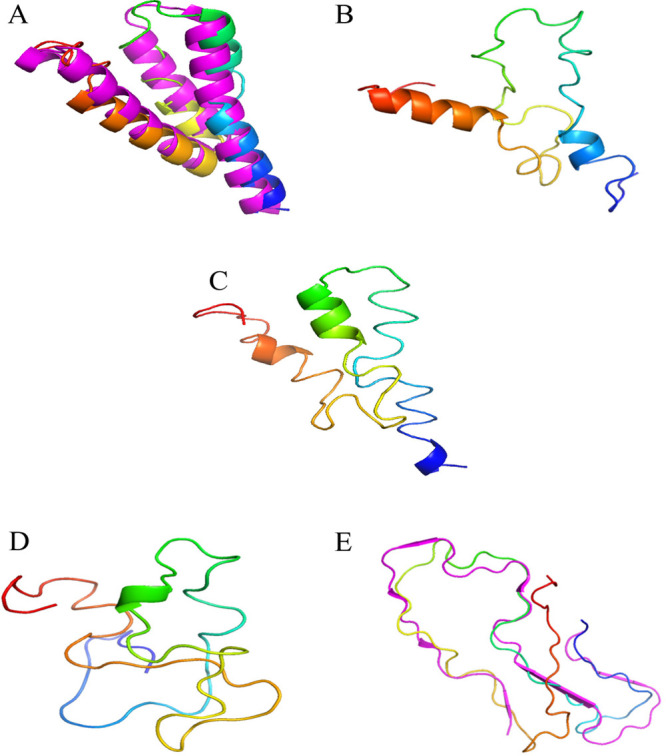
Characteristic conformations of of SAA1–76 as seen in each of the five regions (labeled A, B, C, D, and E) identified on the proposed transition pathway. The N-terminus of the chains is colored in blue. Unlike for the transition regions B, C, and D, these conformations superimposed on the respective reference structures for region A (dominated by folded-conformations) and region E (where fibril-like conformations are dominant).
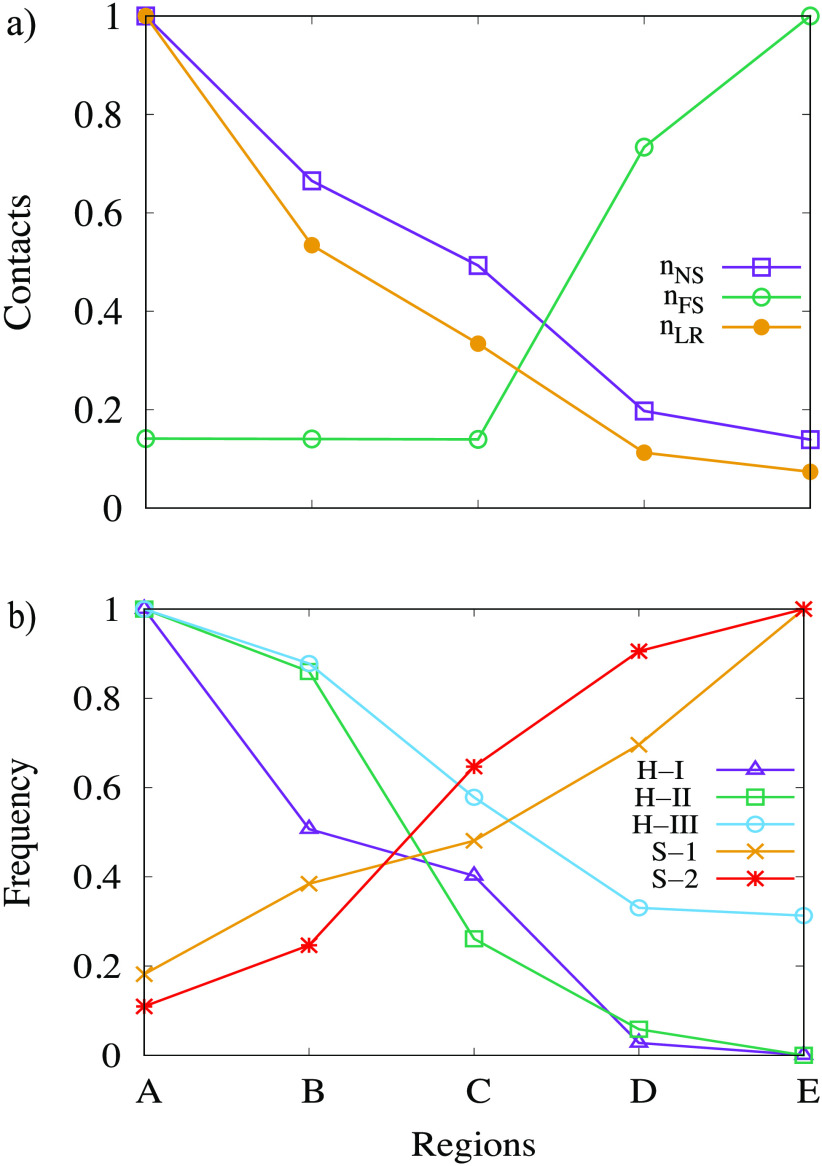
In order to get insight into the structural changes along the proposed transition pathway, we augment the visual inspection of the dominant conformations by an analysis of the number nNS of contacts found also in the folded structure and of the number nFS of contacts also found in the fibril structure. Here, we define a contact by the condition that the distance between at least one pair of heavy atoms in residues i and j is smaller than the cutoff value of 4.5 Å. If, in addition, the two residues are separated by at least three other residues in the protein sequence, we call this a long-range contact. The two quantities, normalized to one, are shown in Figure 5a. As expected, the number nNS of contacts found also in the folded structure decreases when going from region A, characterized by a low RMSD to the native structure, to region E (which has a low RMSD to the fibril structure). The opposite behavior is seen for the number nFS of fibril-like contacts. However, while there is a steep increase in nFS when going from region C to region E, the corresponding change for the number nNS of contacts seen also in the folded structure appears to be more gradual when going from region A to region C. This picture changes when one considers only long-range contacts seen in the folded structure. This number nLR is also shown in Figure 5a and has a more pronounced behavior. While the number decreases rapidly going from region A to region B and from region C to region E, it changes little between region B and region C. This indicates that the conversion process from the helix bundle of the folded conformations starts with the decay of interhelical contacts, while the transition region C is mainly characterized by the decay of intrahelical contacts, with the contacts found in strand-like conformations forming in region D. Note that we do not show separately the number of long-range fibril-like contacts as by definition contacts involving strands are long-range.
Figure 5.
(a) Number of contacts (normalized to one) nNS that are shared with the folded structure as measured in each of the five regions A to E of the transition pathway. The subset of long-range contacts nLR, again normalized to one, is drawn separately. Shown are also the number nFS of contacts also found in the fibril reference structure. In (b), we show the relative frequency with which one of the three characteristic helices of the folded structure, or the two main β-strands of the fibril structure, is observed.
For a more detailed analysis, we have also shown in Figure 5b the frequencies with which one of the three helices of the folded structure or the two main strands of the fibril structure are found in the five regions. Values are again normalized to one. The three regions of residues 2–27, 32–47, and 50–69 are considered helical if at least 30% of residues have dihedral angles as seen in an α-helix, that is, if the dihedral angle pair (Φ, Ψ) takes values of between [−100°, −67°] and [−40°, −7°]. Similarly, we define the “strandness” of the two segments of residues 6–9 and 18–23 by the requirement that at least 20% of residues in the segment have dihedral angles as in a strand ([−160°, 160°] and ([100°, 100°]). The plots show that the N-terminal helix-I is the first to dissolve, with half of it already gone in region B. The central helix-II starts to decay later, but its propensity is also much decreased in the transition region C and neglectable in regions D and E. The C-terminal helix-III is the last one to decay and observed with substantial frequency even in region E. Note, however, that helix-III covers a region that was not resolved in the fibril structure and well may have transient helicity.
We observe a complementary picture for the two segments that are strand-like in the fibril. Again we have initially a larger frequency for the N-terminal segment of residues 6–9, with only in the transition region C the second segment gaining higher propensity for strand formation. Both the early decay of the first helix and the higher propensity of the N-terminal segment to form strands are consistent with experimental observations and our earlier work that demonstrated the importance of the N-terminal residues 1–11 and the role of helix-I for fibril formation.8,41−44 Interestingly, we observe in region B a mixture of the helix-broken and helix-weakened conformations, discussed in ref (8), while in region C the conformation either lost its helicity or resembled more the aggregation prone helix-weakened conformations.
The above picture is also supported by the contact maps calculated for each of the five regions that are shown in Figure 6. Note that the coloring does not indicate frequency of contacts but the average distance between residue pairs. As discussed in ref (8), destabilization of the folded structure starts quickly after cleavage of the full-size monomer into a SAA1–76 fragment with a loss of contacts between residues 60–69 on one side and residues 70–76 on the other side. Already in region A are only about 30% of these contacts still existing, and the frequency decreases further to about 17% in regions B and C, before disappearing. As a result, helix-III is more flexible than in the full-sized protein, allowing it to either break up (in helix-broken conformations) or partially dissolve (in helix-weakened conformations), thereby reducing contacts with helix-II. Overall is the loss of native contacts in regions A to C consistent with the process described in ref (8), where the data were derived with a different simulation technique. On the other hand, in region D starts the formation of fibril-stabilizing intrachain salt bridges and contacts between residues 26 and 34, 26 and 46, 29 and 33, and 35 and 43 that have been also described in ref (43). Note, however, that the contact between 29 and 34 in the helix-I to helix-II linker region is already observed with substantial probability in region A and is therefore likely crucial for fibril formation of SAA. The salt bridge between residues 26 and 34 is also formed early, seen in all five regions with about 10–20% probability. Hence, this contact is therefore a bottleneck/condensation point in fibril formation. Note that the contact of 26–46, which competes with the 26–34 contact, is seen in region D with 5% frequency but only with about 1% in the fibril region E. These results are also consistent with earlier work45 that emphasized the importance of the helix-I to helix-II linker region for fibril formation, albeit we do not see the reported local unfolding of the two helices around this region.
Figure 6.
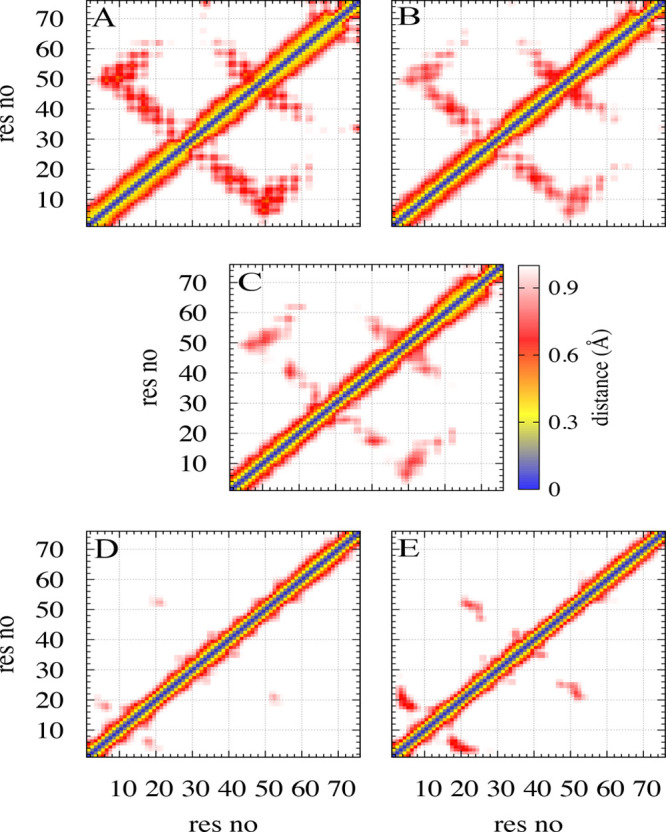
Residue–residue map of the average minimal distance between heavy atoms in a pair of residues, shown for each of the five regions A, B, C, D, and E. Unlike in the transition regions B, C, and D, folded conformations dominate in region A, and fibril-like ones dominate in region E. Residue pairs whose average contact distance is more than 10 Å are excluded. Numbers on the X and Y axis mark residues, and the average distance in Å is given by the color coding shown in the middle row.
4. Conclusions
Using a variant of Replica Exchange with Tunneling (RET), we have probed the interconversion of SAA1–76 monomers between the folded structure and the one assumed in the experimentally resolved fibrils. In vivo, this conversion happens at high (micromolar) SAA concentrations and likely will therefore depend on the interaction with neighboring chains. However, modeling the conversion under these conditions is not feasible, and we therefore restrict ourselves to an isolated monomer. Our assumption is that both folded and fibril configurations are prominent local minima in the free energy landscape of the protein and connected by similar transition pathways as occurring under physiological conditions. Hence, the main limitation of our study is our conjecture that the energy landscape is not drastically altered by interactions with other chains changing barrier heights and local minima. The interaction with other chains becomes in this picture an external field that shifts the equilibrium toward the fibril structure. While this picture is an oversimplification, it allows us to propose a conversion mechanism for SAA fibril formation, identifying critical residues and intrachain interactions, that may guide future experiments. Specifically, we find only small free energy barriers (of the order 2–3kBT) separating the folded and fibril structures that can be crossed easily once a critical nucleus for fibril formation is formed. Consistent with our earlier work,8 we find that the decay of the helix bundle of the folded structure progresses by a loss of interhelical contacts between helix-II and helix-III and helix-I and helix-II, leading to the helix-broken or helix-weakened conformations of ref (8). Dominant on the pathway are the more aggregation prone helix-weakened conformations where the C-terminus of helix-III interacts with the C-terminus of helix-I and increases the flexibility of helix-I. The resulting higher entropy leads to destabilization of helix-I, causing a loss of helicity. Especially important is the release of the first 11 N-terminal residues from helix-I, which then can misfold into strand-like configurations. This strand segment is indeed the first one that appears in the conversion process seen in our RET simulation. We had shown in earlier work43 that the merging fibril structure is stabilized by intrachain contacts between residues 26 and 34, 29 and 33, and 35 and 43, connecting residues located on the helix-I to helix-II linker in the folded conformation. These contacts indeed appear once the barrier is crossed. Interestingly, the salt bridge between residues 26 and 34 is seen already transiently in early stages of the unfolding of the folded conformation and likely plays a crucial role for fibril formation. This could be tested by mutating one of these two residues to inhibit formation of this salt bridge.
Acknowledgments
The simulations in this work were done using the SCHOONER cluster of the University of Oklahoma, XSEDE resources allocated under Grant MCB160005, and TACC resources allocated under Grant MCB20016 (both National Science Foundation). We acknowledge financial support from the National Institutes of Health under Grants GM120634 and GM120578. F.Y. also wants to thank the Scientific and Technological Research Council of Turkey (TUBITAK) under the BIDEB programs and the Department of Chemistry and Biochemistry for kind hospitality during the his sabbatical stay at the University of Oklahoma.
Author Present Address
† Department of Physics Engineering, Hacettepe University, Ankara 06800, Turkey
The authors declare no competing financial interest.
References
- Chiti F.; Dobson C. M. Protein misfolding, amyloid formation, and human disease: A summary of progress over the last decade. Annu. Rev. Biochem. 2017, 86, 27–68. 10.1146/annurev-biochem-061516-045115. [DOI] [PubMed] [Google Scholar]
- Sipe J. D.; Benson M. D.; Buxbaum J. N.; Ikeda S. I.; Merlini G.; Saraiva M. J.; Westermark P. Amyloid fibril proteins and amyloidosis: chemical identification and clinical classification International Society of Amyloidosis 2016 Nomenclature Guidelines. Amyloid 2016, 23, 209–213. 10.1080/13506129.2016.1257986. [DOI] [PubMed] [Google Scholar]
- Obici L.; Merlini G. AA amyloidosis: Basic knowledge, unmet needs and future treatments. Swiss Med. Wkly. 2012, 142, w13580. 10.4414/smw.2012.13580. [DOI] [PubMed] [Google Scholar]
- Röcken C.; Shakespeare A. Pathology, diagnosis and pathogenesis of AA amyloidosis. Virchows Arch 2002, 440, 111–122. 10.1007/s00428-001-0582-9. [DOI] [PubMed] [Google Scholar]
- Real de Asua D.; Galvan J. M.; Filigghedu M. T.; Trujillo D.; Costa R.; Cadinanos J. Systemic AA amyloidosis: epidemiology, diagnosis, and management. Clin. Epidemiol. 2014, 6, 369. 10.2147/CLEP.S39981. [DOI] [PMC free article] [PubMed] [Google Scholar]
- Nguyen P. H.; Ramamoorthy A.; Sahoo B. R.; Zheng J.; Faller P.; Straub J. E.; Dominguez L.; Shea J.-E.; Dokholyan N. V.; De Simone A.; et al. Amyloid Oligomers: A Joint Experimental/Computational Perspective on Alzheimer’s Disease, Parkinson’s Disease, Type II Diabetes, and Amyotrophic Lateral Sclerosis. Chem. Rev. 2021, 121, 2545–2647. 10.1021/acs.chemrev.0c01122. [DOI] [PMC free article] [PubMed] [Google Scholar]
- Cai L.; De Beer M. C.; De Beer F. C.; Van Der Westhuyzen D. R. Serum amyloid a is a ligand for scavenger receptor class B type I and inhibits high density lipoprotein binding and selective lipid uptake. J. Biol. Chem. 2005, 280, 2954–2961. 10.1074/jbc.M411555200. [DOI] [PubMed] [Google Scholar]
- Wang W.; Khatua P.; Hansmann U. H. Cleavage, Downregulation, and Aggregation of Serum Amyloid A. J. Phys. Chem. B 2020, 124, 1009–1019. 10.1021/acs.jpcb.9b10843. [DOI] [PMC free article] [PubMed] [Google Scholar]
- Yaşar F.; Bernhardt N. A.; Hansmann U. H. Replica-exchange-with-tunneling for fast exploration of protein landscapes. J. Chem. Phys. 2015, 143, 224102. 10.1063/1.4936968. [DOI] [PubMed] [Google Scholar]
- Bernhardt N. A.; Xi W.; Wang W.; Hansmann U. H. Simulating Protein Fold Switching by Replica Exchange with Tunneling. J. Chem. Theory Comput. 2016, 12, 5656–5666. 10.1021/acs.jctc.6b00826. [DOI] [PubMed] [Google Scholar]
- Zhang H.; Xi W.; Hansmann U. H.; Wei Y. Fibril-Barrel Transitions in Cylindrin Amyloids. J. Chem. Theory Comput. 2017, 13, 3936–3944. 10.1021/acs.jctc.7b00383. [DOI] [PubMed] [Google Scholar]
- Bernhardt N. A.; Hansmann U. H. Multifunnel Landscape of the Fold-Switching Protein RfaH-CTD. J. Phys. Chem. B 2018, 122, 1600–1607. 10.1021/acs.jpcb.7b11352. [DOI] [PMC free article] [PubMed] [Google Scholar]
- Lu J.; Yu Y.; Zhu I.; Cheng Y.; Sun P. D. Structural mechanism of serum amyloid A-mediated inflammatory amyloidosis. Proc. Natl. Acad. Sci. U. S. A. 2014, 111, 5189–5194. 10.1073/pnas.1322357111. [DOI] [PMC free article] [PubMed] [Google Scholar]
- Liberta F.; Loerch S.; Rennegarbe M.; Schierhorn A.; Westermark P.; Westermark G. T.; Hazenberg B. P.; Grigorieff N.; Fändrich M.; Schmidt M. Cryo-EM fibril structures from systemic AA amyloidosis reveal the species complementarity of pathological amyloids. Nature Commun. 2019, 10, 1104. 10.1038/s41467-019-09033-z. [DOI] [PMC free article] [PubMed] [Google Scholar]
- Bansal A.; Schmidt M.; Rennegarbe M.; Haupt C.; Liberta F.; Stecher S.; Puscalau-Girtu I.; Biedermann A.; Fändrich M. AA amyloid fibrils from diseased tissue are structurally different from in vitro formed SAA fibrils. Nature Commun. 2021, 12, 1013. 10.1038/s41467-021-21129-z. [DOI] [PMC free article] [PubMed] [Google Scholar]
- Fukunishi H.; Watanabe O.; Takada S. On the Hamiltonian replica exchange method for efficient sampling of biomolecular systems: Application to protein structure prediction. J. Chem. Phys. 2002, 116, 9058–9067. 10.1063/1.1472510. [DOI] [Google Scholar]
- Kwak W.; Hansmann U. H. Efficient sampling of protein structures by model hopping. Phys. Rev. Lett. 2005, 95, 138102. 10.1103/PhysRevLett.95.138102. [DOI] [PMC free article] [PubMed] [Google Scholar]
- Hansmann U. H. Parallel tempering algorithm for conformational studies of biological molecules. Chem. Phys. Lett. 1997, 281, 140–150. 10.1016/S0009-2614(97)01198-6. [DOI] [Google Scholar]
- Best R. B.; Zhu X.; Shim J.; Lopes P. E.; Mittal J.; Feig M.; MacKerell A. D. Optimization of the additive CHARMM all-atom protein force field targeting improved sampling of the backbone ϕ, ψ and side-chain χ1 and χ2 Dihedral Angles. J. Chem. Theory Comput. 2012, 8, 3257–3273. 10.1021/ct300400x. [DOI] [PMC free article] [PubMed] [Google Scholar]
- Jorgensen W. L.; Chandrasekhar J.; Madura J. D.; Impey R. W.; Klein M. L. Comparison of simple potential functions for simulating liquid water. J. Chem. Phys. 1983, 79, 926–935. 10.1063/1.445869. [DOI] [Google Scholar]
- Pettersen E. F.; Goddard T. D.; Huang C. C.; Couch G. S.; Greenblatt D. M.; Meng E. C.; Ferrin T. E. UCSF Chimera - A visualization system for exploratory research and analysis. J. Comput. Chem. 2004, 25, 1605–1612. 10.1002/jcc.20084. [DOI] [PubMed] [Google Scholar]
- Noel J. K.; Whitford P. C.; Sanbonmatsu K. Y.; Onuchic J. N. SMOG@ctbp: Simplified deployment of structure-based models in GROMACS. Nucleic Acids Res. 2010, 38, W657. 10.1093/nar/gkq498. [DOI] [PMC free article] [PubMed] [Google Scholar]
- Zhang W.; Chen J. Accelerate sampling in atomistic energy landscapes using topology-based coarse-grained models. J. Chem. Theory Comput. 2014, 10, 918–923. 10.1021/ct500031v. [DOI] [PubMed] [Google Scholar]
- Moritsugu K.; Terada T.; Kidera A. Scalable free energy calculation of proteins via multiscale essential sampling. J. Chem. Phys. 2010, 133, 224105. 10.1063/1.3510519. [DOI] [PubMed] [Google Scholar]
- Hess B.; Kutzner C.; Van Der Spoel D.; Lindahl E. GROMACS 4: Algorithms for highly efficient, load-balanced, and scalable molecular simulation. J. Chem. Theory Comput. 2008, 4, 435–447. 10.1021/ct700301q. [DOI] [PubMed] [Google Scholar]
- Hess B. P-LINCS: A parallel linear constraint solver for molecular simulation. J. Chem. Theory Comput. 2008, 4, 116–122. 10.1021/ct700200b. [DOI] [PubMed] [Google Scholar]
- Swope W. C.; Andersen H. C.; Berens P. H.; Wilson K. R. A computer simulation method for the calculation of equilibrium constants for the formation of physical clusters of molecules: Application to small water clusters. J. Chem. Phys. 1982, 76, 637–649. 10.1063/1.442716. [DOI] [Google Scholar]
- Bussi G.; Donadio D.; Parrinello M. Canonical sampling through velocity rescaling. J. Chem. Phys. 2007, 126, 014101. 10.1063/1.2408420. [DOI] [PubMed] [Google Scholar]
- McGibbon R. T.; Beauchamp K. A.; Harrigan M. P.; Klein C.; Swails J. M.; Hernández C. X.; Schwantes C. R.; Wang L. P.; Lane T. J.; Pande V. S. MDTraj: A Modern Open Library for the Analysis of Molecular Dynamics Trajectories. Biophys. J. 2015, 109, 1528–1532. 10.1016/j.bpj.2015.08.015. [DOI] [PMC free article] [PubMed] [Google Scholar]
- Dijkstra E. W. A note on two problems in connexion with graphs. Numer. Math. 1959, 1, 269–271. 10.1007/BF01386390. [DOI] [Google Scholar]
- Marcos-Alcalde I.; Setoain J.; Mendieta-Moreno J. I.; Mendieta J.; Gómez-Puertas P. MEPSA: minimum energy pathway analysis for energy landscapes. Bioinformatics 2015, 31, 3853–3855. 10.1093/bioinformatics/btv453. [DOI] [PubMed] [Google Scholar]
- Khatua P.; Ray A. J.; Hansmann U. H. Bifurcated Hydrogen Bonds and the Fold Switching of Lymphotactin. J. Phys. Chem. B 2020, 124, 6555–6564. 10.1021/acs.jpcb.0c04565. [DOI] [PMC free article] [PubMed] [Google Scholar]
- Bolhuis P. G.; Chandler D.; Dellago C.; Geissler P. L. Transition Path Sampling: Throwing Ropes over Rough Mountain Passes, in the Dark. Annu. Rev. Phys. Chem. 2002, 53, 291–318. 10.1146/annurev.physchem.53.082301.113146. [DOI] [PubMed] [Google Scholar]
- Dellago C.; Bolhuis P. G.; Csajka F. S.; Chandler D. Transition Path Sampling and the Calculation of Rate Constants. J. Chem. Phys. 1998, 108, 1964–1977. 10.1063/1.475562. [DOI] [Google Scholar]
- Dellago C.; Bolhuis P. G.; Chandler D. Efficient Transition Path Sampling: Application to Lennard-Jones Cluster Rearrangements. J. Chem. Phys. 1998, 108, 9236–9245. 10.1063/1.476378. [DOI] [Google Scholar]
- Weinan E.; Ren W.; Vanden-Eijnden E. String Method for the Study of Rare Events. Phys. Rev. B 2002, 66, 052301. 10.1103/PhysRevB.66.052301. [DOI] [PubMed] [Google Scholar]
- Maragliano L.; Fischer A.; Vanden-Eijnden E.; Ciccotti G. String Method in Collective Variables: Minimum Free Energy Paths and Isocommittor Surfaces. J. Chem. Phys. 2006, 125, 024106. 10.1063/1.2212942. [DOI] [PubMed] [Google Scholar]
- Unarta I. C.; Zhu L.; Tse C. K. M.; Cheung P. P.-H.; Yu J.; Huang X. Molecular Mechanisms of RNA Polymerase II Transcription Elongation Elucidated by Kinetic Network Models. Curr. Opin. Struct. Biol. 2018, 49, 54–62. 10.1016/j.sbi.2018.01.002. [DOI] [PubMed] [Google Scholar]
- Zhu L.; Sheong F. K.; Cao S.; Liu S.; Unarta I. C.; Huang X. TAPS: A Traveling-Salesman Based Automated Path Searching Method for Functional Conformational Changes of Biological Macromolecules. J. Chem. Phys. 2019, 150, 124105. 10.1063/1.5082633. [DOI] [PubMed] [Google Scholar]
- Schrödinger L.The PyMOL Molecular Graphics System, Version 1.8; 2015. [Google Scholar]
- Westermark G. T.; Engström U.; Westermark P. The N-terminal segment of protein AA determines its fibrillogenic property. Biochem. Biophys. Res. Commun. 1992, 182, 27–33. 10.1016/S0006-291X(05)80107-X. [DOI] [PubMed] [Google Scholar]
- Yassine H. N.; Trenchevska O.; He H.; Borges C. R.; Nedelkov D.; Mack W.; Kono N.; Koska J.; Reaven P. D.; Nelson R. W. Serum Amyloid A Truncations in Type 2 Diabetes Mellitus. PLoS One 2015, 10, e0115320. 10.1371/journal.pone.0115320. [DOI] [PMC free article] [PubMed] [Google Scholar]
- Wang W.; Hansmann U. H. Stability of Human Serum Amyloid A Fibrils. J. Phys. Chem. B 2020, 124, 10708–10717. 10.1021/acs.jpcb.0c08280. [DOI] [PMC free article] [PubMed] [Google Scholar]
- Wang W.; Xi W.; Hansmann U. H. Stability of the N-Terminal Helix and Its Role in Amyloid Formation of Serum Amyloid A. ACS Omega 2018, 3, 16184–16190. 10.1021/acsomega.8b02377. [DOI] [PMC free article] [PubMed] [Google Scholar]
- Frame N. M.; Kumanan M.; Wales T. E.; Bandara A.; Fändrich M.; Straub J. E.; Engen J. R.; Gursky O. Structural Basis for Lipid Binding and Function by an Evolutionarily Conserved Protein, Serum Amyloid A. J. Mol. Bio. 2020, 432, 1978–1995. 10.1016/j.jmb.2020.01.029. [DOI] [PMC free article] [PubMed] [Google Scholar]


