

Abstract

X-ray spectroptychography is an emerging method for the chemical microanalysis of advanced nanomaterials such as catalysts and batteries. This method builds upon established synchrotron X-ray microscopy and spectromicroscopy techniques with added spatial resolution from ptychography, an algorithmic imaging technique. This minireview will introduce the technique of X-ray spectroptychography, where ptychography is performed with variable photon energy, and discuss recent results and prospects for this method.
Introduction
This minireview will focus on the status and promise of X-ray spectroptychography for the characterization of nanomaterials. X-ray spectroptychography is an enhancement of X-ray spectromicroscopy—the combination of X-ray absorption spectroscopy and X-ray microscopy—using ptychography for image acquisition. X-ray spectroptychography can provide chemical microanalysis at higher spatial resolution than that provided with conventional X-ray optics. This review will briefly discuss X-ray spectromicroscopy and then its enhancement where ptychographic imaging is combined with variable X-ray imaging to provide spectroptychography. Key experimental results for energy, magnetic, and catalytic materials are examined, and some prospects for future development are discussed.
Over the past two decades, X-ray spectromicroscopy has rapidly developed to become a powerful synchrotron-based chemical characterization method.1,2 X-ray spectromicroscopy combines the high spatial resolution of X-ray microscopy2 with the chemical sensitivity of X-ray absorption spectroscopy, providing unique chemical and morphological information at the nano- and microscales. X-ray spectromicroscopy has seen extensive application in materials that have chemical heterogeneity on the micro- and nanoscale, such as battery materials, fuel cell membranes, and catalysts. X-ray spectroptychography—the subject of this review—is pushing these studies to yet smaller spatial scales.
The strength of X-ray spectromicroscopy comes from the chemical sensitivity of X-ray absorption spectroscopy, also known as X-ray absorption near-edge structure (XANES) or near-edge X-ray absorption fine structure (NEXAFS) spectroscopy. NEXAFS is sensitive to chemical functionality in organic molecules, oxidation state and bonding, orientation, and magnetic structure through X-ray absorption, linear dichroism, and circular dichroism measurements.
X-ray spectromicroscopy saw early use in studies of polymer phase segregation, where NEXAFS spectra could be acquired from small sample volumes with significantly lower radiation damage than comparable electron energy loss spectroscopy (EELS) measurements performed in a transmission electron microscope (TEM).3 Epitome X-ray spectromicroscopy applications are characterized by research questions that require chemical information beyond elemental identity, such as chemical bonding, oxidation state, coordination, orientation, or magnetic properties. In parallel with similar efforts in electron microscopy, significant developments of in situ, operando, and tomography experiments have accompanied the development of X-ray spectromicroscopy and spectroptychography.
As X-ray microscopy2 and X-ray spectromicroscopy1 are well reviewed elsewhere, this minireview will focus on the technique and applications of X-ray spectroptychography. This minireview will involve studies at soft, tender, and hard X-ray energies (approximately 50–20 000 eV) as a spectroscopic contrast mechanism (e.g., energy-selective imaging or “image sequences”) or as a microspectroscopic probe (e.g., spatially resolved spectra).
X-ray spectromicroscopy requires a high brightness and tunable source of X-rays, which are focused to a small spot. Figure 1 presents a schematic of a scanning transmission X-ray microscope (STXM) that uses a zone plate to focus the X-ray beam onto the sample. In the case of conventional STXM, transmission is measured on a pixel-by-pixel basis with a serial detector in place of the pixelated area detector shown in Figure 1. Data can be obtained as spectra from focused spots, images at fixed photon energies, or image sequences consisting of images acquired at a series of X-ray energies. Tomographic measurements can also be performed.
Figure 1.

Schematic of a scanning transmission X-ray microscope. Adapted with permission from ref (45). Sample is raster scanned through the focused X-ray beam. In conventional STXM, transmission is measured by a serial detector downstream of the sample. In ptychographic STXM, a diffraction pattern is measured with a pixelated detector downstream of the sample, as shown in the figure.
The spatial resolution of conventional X-ray microscopes is limited by the focusing properties of their X-ray optics. The spatial resolution of zone plates depends on the ability to fabricate outer zones with narrow widths and high aspect ratio zones required for diffractive efficiency. The best X-ray optics technology can provide imaging with spatial resolution down to 7 nm,4 although most STXM microscopes provide a spatial resolution of ∼35 nm. Zone plates that offer a spatial resolution below 15 nm have an extremely short working distance and have low efficiency, which makes them difficult to use for spectromicroscopy. The spatial resolution with conventional zone-plate optics remains about an order of magnitude from the diffraction limit, and there is limited room for dramatic improvements in the fabrication of zone-plate lenses. In contrast, ptychography can be measured with a modest resolution zone plate that provides increased working distance and efficiency.
Ptychography can significantly improve on the spatial resolution of X-ray microscopy. A review of ptychography for a broad physics audience was recently published,5 adding to several detailed reviews in the literature.6,7 These lensless imaging methods are based on the diffraction of coherent radiation by a noncrystalline sample. A forerunner of ptychography was coherent diffractive imaging (CDI), reported by Miao et al. in 1999.8 In CDI, the image of an isolated object is reconstructed from a diffraction pattern collected from the object.2,8 However, CDI requires uniform illumination across an isolated object, which limits the general application of this method. In contrast, ptychography uses a series of coherent far-field diffraction patterns collected from overlapping regions of the sample without the isolated sample requirement. A schematic of the ptychography experiment in a STXM microscope is presented in Figure 1; here, the pixelated area detector is used to record the diffraction patterns. These diffraction data are iteratively reconstructed using a phase-retrieval algorithm, which provides a complex (e.g., amplitude and phase) function for the sample and the probe.5,6 Both absorption and phase can be used for ptychography image contrast. Phase contrast is more significant at hard X-ray energies. While both absorption and phase contrast are significant at soft X-ray energies, absorption contrast is mostly used.
The use of overlapping sample regions provides a redundancy that eliminates the isolated object requirement of CDI and adds a constraint that aids the reconstruction. These algorithms have been the subject of an extensive review and discussion5,6 and will not be discussed in detail here.
Ptychography is able to surpass the limits of optical aberration and numerical aperture imposed by traditional X-ray lenses as the spatial resolution of ptychography is largely determined by the maximum angular range of the X-ray diffraction collection. Other practical considerations affecting the resolution of ptychography include the quality of the diffraction patterns (partially a function of the sample) as well as camera noise, dark level, and dynamic range. As ptychography works by reconstructing the complex probe function, the technique is not restricted to uniform beams but may benefit from structured illumination.5
Figure 2 presents a comparison of the spatial resolution from a zone-plate-based STXM measurement and a ptychography measurement obtained from a test sample. A substantial improvement in spatial resolution is observed with ptychographic imaging, where the fine (30 nm) lines are clearly resolved. A spatial resolution of 3 nm (half period) has been reported for soft X-ray ptychography.9,10 In addition to zone plates, ptychography microscopes use pinholes, Kirkpatrick–Baez mirrors,11 or refractive Laue lenses to illuminate the sample with a well-defined coherent probe; these optics have an experimental advantage of a constant focal length when the X-ray energy is changed for spectroscopy.
Figure 2.

Example of the spatial resolution of (a) conventional STXM (CLS ambient STXM, absorption) and (b) ptychography (phase) in a STXM microscope. Data courtesy J. Wang (CLS). Jitter in the STXM images is attributed to positioning error and vibrations, while dark areas in the ptychography images are attributed to surface contamination which is easily visible in phase images.
X-ray spectroptychography is the ptychographic version of X-ray spectromicroscopy. In a microscope with a conventional focusing lens, X-ray spectromicroscopy data can be obtained as specially resolved spectra (eV; fixed x, y) or as “image sequences” where images are acquired at a series of energies to obtain a three-dimensional data set (x, y, eV). As X-ray spectroptychography is based on ptychographic reconstruction at multiple photon energies, the route to spectromicroscopy is through image sequences (x, y, eV) acquired by ptychography image acquisition and processing at a series of X-ray energies.
X-ray spectroptychography provides the full refractive index of the sample, consisting of the absorption and phase spectra. The phase and absorption spectra are connected via the Kramers–Kronig relations.12
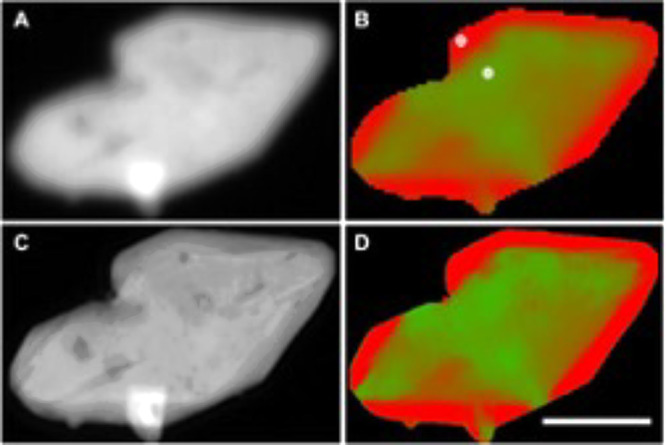
Figure 3 presents an example of an X-ray spectroptychography data set from a sample consisting of 30 nm Fe2O3 nanoparticles (US Nanoparticle) recorded in the ambient STXM at the Canadian Light Source. The amplitude (Figure 3a) and phase (Figure 3b) ptychography images were recorded at 710 eV. The Fe L3 optical density and phase spectra extracted from this sample are presented in Figure 3c. The nanoparticles appear dark in the absorption image on account of the strong absorption at this energy, while these nanoparticles appear light on account of the negative phase. These nanoparticles would be blurred by the spot size in a conventional STXM, and the absorption and phase spectra show the complementary information that is accessible by X-ray spectroptychography.
Figure 3.

Spectroptychography of 30 nm diameter Fe2O3 nanoparticles. Amplitude (a) and phase (b) ptychography images, recorded at 710.0 eV. Image size is 2.1 × 2.1 μm. (c) Absorption (optical density) and phase Fe L3 spectra obtained from this sample. (Inset) Region from which the sample signal for amplitude and phase (green region) was extracted. Amplitude signal from an open area (red region) was used for the incidence flux in the calculation of the sample optical density using Beer’s law, −ln(I/Io).
Applications of X-ray Spectroptychography
Over the past decade, X-ray spectroptychography has advanced past test samples with small data sets to complex samples representing realistic materials science questions. At the same time, the spatial resolution of these studies has improved as instrumentation and algorithms have improved.
Initial studies on abstracted test samples, such as PMMA/SiO2 spheres,13 Au nanoparticles,14 and Ag-coated Au nanoparticles,15 are characterized by a small set of images (2–20) collected at energies near the relevant core edge (O K13 or Au L314,15 edges). These data provide for chemical differentiation of nanospheres with different chemistries13 as well as differentiating the Au wall from the Ag core in coated nanoparticles.15 X-ray spectroptychography was subsequently applied to emerging questions in nanostructured energy materials such as batteries and fuel cell cathodes, catalysts, and magnetic materials.
Magnetic Materials
The magnetic nanostructure of materials can be examined by X-ray spectroptychography using X-ray magnetic circular dichroism (XMCD), which is sensitive to the magnetic strength and alignment of ferromagnetic phases. Tripathi et al.16 and Donnelly et al.17 examined Gd/Fe multilayer samples by XMCD spectroptychography. These samples display out of plane magnetization, which can be probed by XMCD in the normal incidence geometry of a STXM. Tripathi et al.16 examined the striped domain pattern through the hysteresis loop, while Donnelly et al.17 demonstrated how absorption and phase contrast vary over the Gd L3 edge. Figure 4 presents the phase and absorption XMCD images of a FeGd film obtained by taking the difference between ptychographic images recorded with left and right circular polarized X-rays recorded over the Gd L3 edge along with absorption and phase XMCD spectra obtained from ptychography.17 These data show that the phase contrast appears at lower energy than the absorption contrast on account of the nature of the Kramers–Kronig relations between absorption and phase. Gräfe et al. used Fe L3-edge XMCD contrast spectroptychography to examine antidot lattices, where the improved spatial resolution of these ptychography experiments enabled imaging of magnetic domains in a sample with strong topological variation.18
Figure 4.

(a) XMCD ptychographic images (phase and absorption) of a FeGe film, obtained by taking the difference between images recorded with left and right circular polarization, at energies across the Gd L3 edge. (b) Absorption (AXMCD, red circles) and phase (blue squares, φXMCD) spectra extracted from these images compared to transmission spectra (black line), reference XMCD absorption spectrum (red line), and XMCD phase spectrum calculated with the Kramers–Kronig relation. Scale bars represent 1 μm. Reprinted with permission from ref (17). Copyright 2016 American Physical Society.
The Hitchcock group used XMCD in X-ray spectromicroscopy and X-ray spectroptychography to examine nanoscale magnetite single crystals formed by magnetotactic bacteria. Spectroscopic imaging enables a correlation of protein, polysaccharide, and lipid phases with the location of magnetite single crystals, while XMCD contrast maps the magnetization vector.19,20 A pathway for the biomineralization of magnetosomes was proposed following examination of precursor and immature phases. As shown in Figure 5, this work also demonstrated how X-ray spectroptychography can improve the quality of the NEXAFS spectra, particularly for small and highly dense phases. As the ptychography algorithm reconstructs the probe, artifacts due to the imperfect focus of conventional X-ray optics can be avoided.20 This fact could improve the analytical application of NEXAFS microscopy.
Figure 5.

Fe L3 NEXAFS spectra of magnetosomes (∼50 nm) acquired with in convectional STXM with high (green) and lower (red trace) resolution zone planes and by spectroptychography (blue trace). Reprinted with permission from ref (20). Copyright 2016 AIP Publishing.
Battery Materials
The challenge for research in battery materials was described by Wolf et al. as the ‘hierarchy of inhomogeneities’ with chemical and electrochemical differences in the electrodes and separator that vary in space and time.21 Conventional X-ray microscopy and spectromicroscopy have been widely used for studies of battery materials, and X-ray spectroptychography is able to provide chemical characterization of these materials at even higher spatial resolution.21
High spatial resolution oxidation state mapping of specific metal ions during battery cycles is a common application of spectromicroscopy and spectroptychography studies. Shapiro et al. used iron L3-edge X-ray spectroptychography to map lithiation and delithiation (LiFePO4/FePO4) through corresponding changes in the iron 2p oxidation state.9,22Figure 6 presents an example of chemical mapping of these FePO4 and LiFePO4 phases in a battery microplatelet, which compares results from conventional and ptychographic spectromicroscopy.22 The improved spatial resolution of ptychography is evident in the comparison of STXM (Figure 6a) and ptychography (Figure 6b) optical density images and in the sharpness of chemical maps (red, FePO4; green, LiFePO4) derived from images recorded at energies that reflect the Fe2+ and Fe3+ oxidation states. This type of chemical mapping has been extended to three dimensions with spectroptychotomography, which will be described in more detail below. Metal oxidation state mapping has been performed at hard X-ray energies. Uematsu et al. examined structural heterogeneities in LixNi0.5Mn1.5O4 (LNMO) battery materials at the Ni and Mn K edges.23 Fits of the absorption spectra provide 2D maps of Mn and Ni density and valence, and clustering methods were used to identify three different structural groups within this material.
Figure 6.
Spectromicroscopy of a LixFePO4 microplatelet acquired by conventional STXM (a, b) and ptychography (c, d). Left images (a, c) are of the average optical density, while right images (b, d) are chemical composition maps (red, FePO4; green, LiFePO4) based on spectromicroscopic data. Scale bar is 1 μm. Reprinted with permission from ref (22). Copyright 2020 The authors, some rights reserved; exclusive licensee AAAS. Distributed under a CC BY-NC 4.0 license http://creativecommons.org/licenses/by-nc/4.0/.
Chemical mapping by spectroptychography has been used to observe the relationship between the mechanical and the chemical stability of Li ion batteries and battery cycling. Yu et al. demonstrated that the lattice mismatch between LiFePO4 and FePO4 crystals leads to fracturing of micrometer-scaled crystals, while nanometer-scale crystals are stable to cycling.24 Csernica et al. studied voltage degradation and oxygen release at high states of delithiation in Li1.18–xNi0.21Mn0.53Co0.08O2−δ battery materials. They observed that bulk lattice oxygen was released during extended cycling and related the nature of oxygen release to the secondary structure of the electrode.25
Other applications of spectroptychography include the elucidation of minority phases and surface chemistry. Zhang et al. used data mining of 10 million Co K-edge spectra from 100 cathode particles to find minority phases in LiNixMnxCo1–2xO2 electrode materials.26 Sun et al. examined surface degradation of a PH3-modified Li1.17Mn0.44Ni0.35Co0.04O battery cathode at multiple and statistically correlated soft X-ray core edges (O and F K edges; Mn, Fe, and Ni L edges). These results show the correlation between fluoride incorporation into the Li-rich cathode lattice and Mn dissolution.27 Wolfman et al. used X-ray spectroptychography at the O K edge and the Co and Ni L edges to examine side reactions involving surface reduction in LiNi0.8Co0.15Al0.05O2 battery materials,28 revealing heterogeneity in Ni oxidation and gradients within individual particles.
Catalyst Materials
Catalyst materials have been extensively examined by X-ray spectromicroscopy and spectroptychography. Refinement of these materials relies upon the chemical mapping of heterogeneous materials at high spatial resolution with increasing relevance of in situ and operando studies to resolve catalytic function and mechanism.
Chemical mapping studies include a study by Wise et al. examining the La and Fe distributions in a fluid catalytic cracking catalyst, where Fe L-edge spectra differentiated Fe3+ poisoning from the Fe2+ matrix of the catalyst.29 Hirose et al. examined platinum-supported cerium–zirconium oxide three-way catalyst particles using Ce L-edge chemical mapping using a phase retrieval algorithm constrained by the Kramers–Kronig relation between absorption and phase spectra.30 Heterogeneity was observed within individual Ce2Zr2Ox particles, and different oxygen storage behaviors were determined.
Chemical mapping has been extended to 3D with spectroptychotomography. Hirose et al. examined cerium oxidation states and oxygen diffusion in bulk Ce2Zr2Ox (x = 7–8) with the aid of unsupervised learning and examined the relationship between morphology and reactivity, suggesting oxidation pathways in the solid catalyst.31 Yuan et al.32 examined ZnO-coated alumina aerogels prepared by atomic layer deposition to derive high-spatial resolution ZnO chemical maps. Figure 7 presents an example of the 3D chemical mapping of Al2O3 and ZnO phases from a study by Yuan et al, where the locations of ZnO and Al2O3 were determined by ptychographic imaging at and below the Zn L3 and Al K edges, respectively.
Figure 7.

Three-dimensional chemical maps of Al2O3 (blue) and ZnO (red) signals from tomographic reconstruction of Al K-edge and Zn L-edge ptychographic maps (on edge/pre-edge) obtained from an atomic layer deposition-coated aerogel sample. Adapted with permission from ref (32). Copyright 2021 The Authors. Published by American Chemical Society. Distributed under a CC-BY-NC-ND license https://creativecommons.org/licenses/by-nc-nd/4.0/, with derivation provided with the permission of the corresponding author, Adam Hitchcock.
X-ray tomography and ptychotomography have been used to examine porosity in heterogeneous catalyst materials, including fluid catalytic cracking catalysts.33 The use of spectroscopic information can provide additional elemental and chemical information. For example, Ihli et al. used on-resonant Fe K-edge spectroptychotomography measurements at a fixed energy (7123 eV) as a general probe of the location of iron and correlate these maps to off-resonant measurements which provide an electron density map. These results are used to colocalize iron within zeolite domains of increased microporosity and to differentiate iron impurities from the original catalyst from those introduced by the feedstock.33
Wu et al. examined polymer electrolyte membrane fuel cell cathode layers by X-ray spectroptychography and spectroptychotomography at the F K-edge experiments (694 eV); the C K edge is inaccessible in these measurements because of the limited camera sensitivity at lower energies.34 Spatial resolution is improved with ptychography, but these hydrated polymers are very sensitive to radiation damage. Cryogenic microscopy is expected to enable continued study of radiation-sensitive materials such as these.
Other Aspects of Spectroptychography
Spectroptychotomography
In the literature, many ptychotomography experiments are performed at hard X-ray energies that provide better penetration through thicker samples. These studies rarely consider spectroscopic information, often not documenting the X-ray energy used for imaging. However, some ptychotomography experiments incorporate some measure of spectroscopy for direct chemical information. Some of these spectroptychotomography studies were described above for battery and catalyst materials.35 An advantage of 3D mapping by spectro(ptycho)tomography is the ability to avoid possible spurious correlations that can arise in 2D transmission imaging. The challenge for these experiments is the need for very large data sets as diffraction pattern data sets must be acquired at multiple sample angles and multiple energies. This can extend the acquisition time beyond reason and induce unacceptable radiation damage. The use of a reduced set of energies (e.g., elemental mapping with on/off edge imaging)33,36 is common with chemical mapping (discharged Fe2+ versus charged Fe3+ in LiFePO4 battery materials) possible in systems that can be examined chemically with images at few (e.g., 2–3) energies.35
Multienergy spectroptychotomography experiments can provide detailed chemical mapping but are extremely time consuming and restricted to radiation-resistant materials. Hirose et al. examined oxygen diffusion in the bulk of Ce2Zr2Ox (x = 7–8) by spectroptychotomography in an experiment that used 61 angles, 28 energies, and a 5 day acquisition time.31 These experiments and analyses provided a 3D distribution of the Ce oxidation states, and data mining revealed different chemistries with unique morphologies and reactivities, suggesting oxidation pathways in the solid catalyst.
Gao et al. explored a “sparse” spectroptychotomography experiment based on the simultaneous algebraic reconstruction technique (SART). This reduces the number of projections required to achieve a high-quality reconstruction.37 In a V K-edge study of a vanadium phosphorus oxide (VPO) catalyst, 68 projections at 60 energies were used, rather than the 628 projections needed to satisfy the Crowther sampling criteria. This approach reduced the data acquisition time from 1 week to less than 20 h.37 A similar reduction in the number of tilt angles is obtained using a compressed sensing algorithm.32
Extended X-ray Absorption Fine Structure (EXAFS) Spectroptychography
Hirose et al. extended spectroptychography from NEXAFS imaging to extended X-ray absorption fine structure (EXAFS).11 EXAFS spectroscopy requires a wide range of photon energies to provide an interferogram that can be Fourier transformed to provide a radial distribution function; in this case, 139 energies were acquired at and above the Mn K edge in a MnO particle material. Bond lengths for the first Mn–O coordination shell and the second Mn–Mn coordination shell were found. These experiments are time consuming and require exceptional stability to perform, in this case, using a KB mirror focusing system that has a fixed focal length.
In Situ and Operando Spectroptychography
The ability to examine samples in varied and realistic conditions using in situ and operando imaging modes has grown rapidly in X-ray spectromicroscopy but with limited adoption in spectroptychography to date. The use of in situ and operando X-ray spectromicroscopy is extensive and deserving of its own review;38 only an overview will be provided here. Experiments that control the sample temperature, gas flow, humidity, solution chemistry, magnetization, applied strain, applied voltage/current,26 etc., are broadly reported with applications of working catalysts, batteries, and electrochemical deposition. These experiments are relevant for the study of short-lived intermediate species, which may not be present in samples prepared ex situ.26
Only a few applications of in situ and operando spectroptychography have emerged to date.39 In situ spectroptychography was examined at the Co L3 edge (16 energies) for a working electrode of a Mn–Co/polypyrrole nanocomposite that had been subjected to 100 electrodeposition cycles. In these examples, the sample is stable over the time scale of the spectroscopic scans.
A general challenge of in situ experiments is the dwell times required for ptychography measurements, further compounded by the need for multiple energies for spectroscopic sensitivity. There are advantages of ptychography for in situ measurements soft X-ray energies as a longer focal length lens could be used to accommodate the larger working distance required for in situ sample cells. Multislice reconstruction methods will also allow the examination of sample cells that are thicker than the depth of field.40
Spectroscopic experiments that study fast dynamics will be limited to phenomena that can be examined at a single resonant energy as changes to the photon energy are comparatively slow compared to sample scanning. Lo et al. proposed a general method to study dynamic processes by CDI, where the sample geometry is divided into static and dynamic regions. When the static region is used as a time-invariant constraint on the reconstruction, the speed and robustness of the reconstruction is improved, with 10 nm spatial resolution and 10 ms temporal resolution predicted; furthermore, this approach can be extended to ptychography.41
X-ray Linear Dichroism Spectroptychography
Linear dichroism in NEXAFS spectroscopy is sensitive to molecular orientation. This sensitivity arises from the polarization dependence of NEXAFS transitions, where the intensity scales as the dot product of the X-ray linear polarization vector, E, and the transition dipole moment for a NEXAFS transition. Linear dichroism has been broadly used in X-ray spectromicroscopy to study oriented polymers, nanorods, and biominerals.1 Several applications of X-ray linear dichroism spectroptychography have emerged. As an example, Gao et al. examined the linear dichroism of a vanadium pentoxide (α-V2O5) crystal by spectroptychography at the V K edge, at orthogonal polarization states, and obtained absorption and phase maps of polycrystalline α-V2O5.42
Future Challenges for Spectroptychography
X-ray ptychography and spectroptychography are rapidly expanding as synchrotron techniques as instrumentation, optics, theory, and algorithms are developed and implemented. Several of the challenges and opportunities relevant to spectroptychography are identified below.
Making Sense of Phase Images and Phase Spectroscopy
Phase images and spectra of materials have a complex structure that is not easy to rationalize. While these phase data are mathematically related to absorption data through the Kramers–Kronig relations, these data remain curious. Phase spectra could reveal additional information from samples or reveal the same information in different ways. As phase spectra show a large negative phase shift before the onset of the lowest energy transitions in a NEXAFS absorption spectra, phase images could be used in a limited manner for chemical imaging of samples with reduced radiation damage.
Lower Photon Energies and Radiation Damage
Spectroptychography at lower photon energies (carbon K, 285 eV; Li K, 55 eV) is relevant for a wide range of materials such as organic electronic materials and lithium-ion batteries. A challenge for these lower energy measurements is the reduced sensitivity of X-ray cameras at these lower photon energies. While this minireview was under review, Mille et al. presented the first C K-edge ptychography study using an uncoated CMOS X-ray camera.43 Radiation damage is a manageable consideration for conventional spectromicroscopy of organic materials but may no longer be so with the longer dwell times typically required for ptychography measurements.
Higher spatial resolution measurements will also require a greater dose for consistent signal to noise. Cryogenic imaging can assist by limiting mass loss with X-ray exposure. However, care will be needed when interpreting these spectra as differences in thermally populated molecular motion can alter these spectra. Faster cameras will also help. Methods to reduce the amount of data necessary, such as careful selection of photon energies examined, and the development of sparse sampling and reconstruction algorithms32 will also help.
Correlative Imaging
Correlative imaging experiments require careful design, planning, and execution to permit the examination of a sample region by more than one microscopy technique. The recent work of Hughes et al. is an excellent example of the potential of such experiments, where 4D-STEM (e.g., ptychography with a coherent electron beam in an electron microscopy, ideal for high spatial resolution imaging of light elements) is combined with Fe L-edge spectroptychography.44Figure 8 shows the examination of an individual LiFePO4 platelet, where lattice parameters obtained from 4D-STEM are correlated on a pixel-by-pixel basis with the percent lithiation, obtained from spectroptychography. These results show that, on average, Vegard’s law applies and shows that the structure and chemistry are related.44 Other examples include the correlation of X-ray fluorescence imaging with ptychotomography, which allows one to study the distribution of metals within biological cells.2
Figure 8.

Images from a single LixFePO4 microplatelet obtained from 4D-STEM and Fe L-edge spectroptychography measurements, illustrating the relationship between percent lithiation (center; from spectroptychography), a-lattice parameter (right; from 4D-STEM), and deviation from Vegard’s law (left, from a pixel-by-pixel correlation of 4D-STEM and spectroptychography data). Reprinted with permission ref (44). Copyright 2021 distributed under a CC BY-NC 4.0 license http://creativecommons.org/licenses/by-nc/4.0/.
Advanced Data Analysis
This minireview has identified several implementations of machine learning, unsupervised learning,31 and cluster analysis23,27 and other statistical methods for the analysis of complex ptychographic data sets. The size of data sets has been reduced through the common sense of experimentalists (e.g., selection of limited energies based on knowledge of the spectroscopy), but this will be further reduced through sparse experimental methods, particularly for tomographic measurements.32,37 The development of this field will benefit from the translation of advanced reconstruction and statistical analysis methods from literature examples to everyday, experimentally accessible tools.
Conclusions
X-ray spectroptychography has developed rapidly over the past decade and has emerged as a “default” experimental mode at many synchrotron microscopy beamlines along with reconstruction codes. This method can perform chemical microanalysis of nanomaterials at relevant spatial scales and sensitivity with specific examples shown for batteries, catalysts, and magnetic materials. The extension to 3D chemical mapping is shown through spectroptychotomography, where the extended data acquisition time is a challenge for these measurements. I expect the potential for in situ measurements to be revealed over the next few years.
Acknowledgments
The author acknowledges the Natural Sciences and Engineering Research Council (NSERC) for the financial support of their research program. Fe2O3 samples were provided by Theo Olumorin, and CLS SM spatial resolution data was provided by Jian Wang. This work was prepared while the author was on sabbatical leave at the Canadian Light Source, hosted by Mark Boland and Gianluigi Botton. The author thanks Jian Wang and Charan Kuppili for the many engaging discussions on ptychography and the referees for their thoughtful comments and suggestions. Spectra and ptychographic images in Figure 3 were acquired at the Spectromicroscopy beamline at the Canadian Light Source (CLS). The CLS is supported by the Canada Foundation for Innovation (CFI), the Natural Sciences and Engineering Research Council (NSERC), the National Research Council (NRC), the Canadian Institutes of Health Research (CIHR), the Government of Saskatchewan, and the University of Saskatchewan. Special thanks are extended to BernieCat, for her generous loan of “her” chair while the author worked at home during the Covid-19 pandemic.
Biography
Stephen Urquhart received their B.Sc. degree in Chemistry and Physics and Ph.D. degree in Chemistry from McMaster University (Hamilton, Ontario, Canada) in 1992 and 1997, respectively, and held a postdoctoral fellowship at North Carolina State University from 1997 to 1999. They joined the University of Saskatchewan in 2000 and are currently a Professor of Chemistry and an associate member in the Physics Department. They also serve as the leader of the Spectromicroscopy beamline team at the Canadian Light Source. Their interests are in fundamental and applied aspects of X-ray absorption spectroscopy and use of this spectroscopy for chemical microanalysis of materials by X-ray spectromicroscopy.
The author declares no competing financial interest.
References
- Hitchcock A. P. Soft X-ray spectromicroscopy and ptychography. J. Electron Spectrosc. Relat. Phenom. 2015, 200, 49–63. 10.1016/j.elspec.2015.05.013. [DOI] [Google Scholar]
- Jacobsen C.X-ray Microscopy; Cambridge University Press: Cambridge, 2019. [Google Scholar]
- Rightor E. G.; Hitchcock A. P.; Ade H.; Leapman R. D.; Urquhart S. G.; Smith A. P.; Mitchell G.; Fischer D.; Shin H. J.; Warwick T. Spectromicroscopy of Poly(ethylene terephthalate): Comparison of Spectra and Radiation Damage Rates in X-ray Absorption and Electron Energy Loss. J. Phys. Chem. B 1997, 101 (11), 1950–1960. 10.1021/jp9622748. [DOI] [Google Scholar]
- Rösner B.; Finizio S.; Koch F.; Döring F.; Guzenko V. A.; Langer M.; Kirk E.; Watts B.; Meyer M.; Loroña Ornelas J.; Späth A.; Stanescu S.; Swaraj S.; Belkhou R.; Ishikawa T.; Keller T. F.; Gross B.; Poggio M.; Fink R. H.; Raabe J.; Kleibert A.; David C. Soft x-ray microscopy with 7 nm resolution. Optica 2020, 7 (11), 1602–1608. 10.1364/OPTICA.399885. [DOI] [Google Scholar]
- Guizar-Sicairos M.; Thibault P. Ptychography: A solution to the phase problem. Phys. Today 2021, 74 (9), 42–48. 10.1063/PT.3.4835. [DOI] [Google Scholar]
- Rodenburg J.; Maiden A.. Ptychography. In Springer Handbook of Microscopy; Hawkes P. W., Spence J. C. H., Eds.; Springer, 2019. [Google Scholar]
- Pfeiffer F. X-ray ptychography. Nat. Photonics 2018, 12 (1), 9–17. 10.1038/s41566-017-0072-5. [DOI] [Google Scholar]
- Miao J.; Charalambous P.; Kirz J.; Sayre D. Extending the methodology of X-ray crystallography to allow imaging of micrometre-sized non-crystalline specimens. Nature 1999, 400 (6742), 342–344. 10.1038/22498. [DOI] [Google Scholar]
- Shapiro D. A.; Yu Y.-S.; Tyliszczak T.; Cabana J.; Celestre R.; Chao W.; Kaznatcheev K.; Kilcoyne A. L. D.; Maia F.; Marchesini S.; Meng Y. S.; Warwick T.; Yang L. L.; Padmore H. A. Chemical composition mapping with nanometre resolution by soft X-ray microscopy. Nat. Photonics 2014, 8 (10), 765–769. 10.1038/nphoton.2014.207. [DOI] [Google Scholar]
- The reader is cautioned to the methods used to measure and represent spatial resolution, which can be reported as a half-period (half-pitch) or full-period (full-pitch) value, which vary by a factor of 2.
- Hirose M.; Shimomura K.; Higashino T.; Ishiguro N.; Takahashi Y. Nanoscale determination of interatomic distance by ptychography-EXAFS method using advanced Kirkpatrick-Baez mirror focusing optics. J. Synchrotron Radiat. 2020, 27 (2), 455–461. 10.1107/S1600577519017004. [DOI] [PubMed] [Google Scholar]
- Jacobsen C.; Wang S.; Yun W.; Frigo S.. Calculation of x-ray refraction from near-edge absorption data only; SPIE, 2004; Vol. 5538. [Google Scholar]
- Beckers M.; Senkbeil T.; Gorniak T.; Reese M.; Giewekemeyer K.; Gleber S.-C.; Salditt T.; Rosenhahn A. Chemical Contrast in Soft X-Ray Ptychography. Phys. Rev. Lett. 2011, 107 (20), 208101. 10.1103/PhysRevLett.107.208101. [DOI] [PubMed] [Google Scholar]
- Hoppe R.; Reinhardt J.; Hofmann G.; Patommel J.; Grunwaldt J.-D.; Damsgaard C. D.; Wellenreuther G.; Falkenberg G.; Schroer C. G. High-resolution chemical imaging of gold nanoparticles using hard x-ray ptychography. Appl. Phys. Lett. 2013, 102 (20), 203104. 10.1063/1.4807020. [DOI] [Google Scholar]
- Takahashi Y.; Suzuki A.; Zettsu N.; Kohmura Y.; Yamauchi K.; Ishikawa T. Multiscale element mapping of buried structures by ptychographic x-ray diffraction microscopy using anomalous scattering. Appl. Phys. Lett. 2011, 99 (13), 131905. 10.1063/1.3644396. [DOI] [Google Scholar]
- Tripathi A.; Mohanty J.; Dietze S. H.; Shpyrko O. G.; Shipton E.; Fullerton E. E.; Kim S. S.; McNulty I. Dichroic coherent diffractive imaging. Proc. Natl. Acad. Sci. U. S. A. 2011, 108 (33), 13393. 10.1073/pnas.1104304108. [DOI] [PMC free article] [PubMed] [Google Scholar]
- Donnelly C.; Scagnoli V.; Guizar-Sicairos M.; Holler M.; Wilhelm F.; Guillou F.; Rogalev A.; Detlefs C.; Menzel A.; Raabe J.; Heyderman L. J. High-resolution hard x-ray magnetic imaging with dichroic ptychography. Phys. Rev. B 2016, 94 (6), 064421. 10.1103/PhysRevB.94.064421. [DOI] [Google Scholar]
- Gräfe J.; Skripnik M.; Dieterle G.; Haering F.; Weigand M.; Bykova I.; Träger N.; Stoll H.; Tyliszczak T.; Vine D.; Ziemann P.; Wiedwald U.; Shapiro D.; Nowak U.; Schütz G.; Goering E. J. Ptychographic imaging and micromagnetic modeling of thermal melting of nanoscale magnetic domains in antidot lattices. AIP Adv. 2020, 10 (12), 125122. 10.1063/5.0025784. [DOI] [Google Scholar]
- Zhu X.; Hitchcock A. P.; Bazylinski D. A.; Denes P.; Joseph J.; Lins U.; Marchesini S.; Shiu H.-W.; Tyliszczak T.; Shapiro D. A. Measuring spectroscopy and magnetism of extracted and intracellular magnetosomes using soft X-ray ptychography. Proc. Natl. Acad. Sci. U.S.A. 2016, 113 (51), E8219. 10.1073/pnas.1610260114. [DOI] [PMC free article] [PubMed] [Google Scholar]
- Zhu X. H.; Tyliszczak T.; Shiu H. W.; Shapiro D.; Bazylinski D. A.; Lins U.; Hitchcock A. P. Magnetic studies of magnetotactic bacteria by soft x-ray STXM and ptychography. AIP Conf. Proc. 2014, 1696 (1), 020002. 10.1063/1.4937496. [DOI] [Google Scholar]
- Wolf M.; May B. M.; Cabana J. Visualization of Electrochemical Reactions in Battery Materials with X-ray Microscopy and Mapping. Chem. Mater. 2017, 29 (8), 3347–3362. 10.1021/acs.chemmater.6b05114. [DOI] [Google Scholar]
- Shapiro D. A.; Babin S.; Celestre R. S.; Chao W.; Conley R. P.; Denes P.; Enders B.; Enfedaque P.; James S.; Joseph J. M.; Krishnan H.; Marchesini S.; Muriki K.; Nowrouzi K.; Oh S. R.; Padmore H.; Warwick T.; Yang L.; Yashchuk V. V.; Yu Y.-S.; Zhao J. An ultrahigh-resolution soft x-ray microscope for quantitative analysis of chemically heterogeneous nanomaterials. Sci. Adv. 2020, 6 (51), eabc4904 10.1126/sciadv.abc4904. [DOI] [PMC free article] [PubMed] [Google Scholar]
- Uematsu H.; Ishiguro N.; Abe M.; Takazawa S.; Kang J.; Hosono E.; Nguyen N. D.; Dam H. C.; Okubo M.; Takahashi Y. Visualization of Structural Heterogeneities in Particles of Lithium Nickel Manganese Oxide Cathode Materials by Ptychographic X-ray Absorption Fine Structure. J. Phys. Chem. Lett. 2021, 12 (24), 5781–5788. 10.1021/acs.jpclett.1c01445. [DOI] [PubMed] [Google Scholar]
- Yu Y.-S.; Kim C.; Shapiro D. A.; Farmand M.; Qian D.; Tyliszczak T.; Kilcoyne A. L. D.; Celestre R.; Marchesini S.; Joseph J.; Denes P.; Warwick T.; Strobridge F. C.; Grey C. P.; Padmore H.; Meng Y. S.; Kostecki R.; Cabana J. Dependence on Crystal Size of the Nanoscale Chemical Phase Distribution and Fracture in LixFePO4. Nano Lett. 2015, 15 (7), 4282–4288. 10.1021/acs.nanolett.5b01314. [DOI] [PubMed] [Google Scholar]
- Csernica P. M.; Kalirai S. S.; Gent W. E.; Lim K.; Yu Y.-S.; Liu Y.; Ahn S.-J.; Kaeli E.; Xu X.; Stone K. H.; Marshall A. F.; Sinclair R.; Shapiro D. A.; Toney M. F.; Chueh W. C. Persistent and partially mobile oxygen vacancies in Li-rich layered oxides. Nat. Energy 2021, 6 (6), 642–652. 10.1038/s41560-021-00832-7. [DOI] [Google Scholar]
- Zhang K.; Ren F.; Wang X.; Hu E.; Xu Y.; Yang X.-Q.; Li H.; Chen L.; Pianetta P.; Mehta A.; Yu X.; Liu Y. Finding a Needle in the Haystack: Identification of Functionally Important Minority Phases in an Operating Battery. Nano Lett. 2017, 17 (12), 7782–7788. 10.1021/acs.nanolett.7b03985. [DOI] [PubMed] [Google Scholar]
- Sun T.; Sun G.; Yu F.; Mao Y.; Tai R.; Zhang X.; Shao G.; Wang Z.; Wang J.; Zhou J. Soft X-ray Ptychography Chemical Imaging of Degradation in a Composite Surface-Reconstructed Li-Rich Cathode. ACS Nano 2021, 15, 1475. 10.1021/acsnano.0c08891. [DOI] [PubMed] [Google Scholar]
- Wolfman M.; Yu Y.-S.; May B. M.; Lebens-Higgins Z. W.; Sallis S.; Faenza N. V.; Pereira N.; Shirato N.; Rose V.; Shapiro D. A.; Amatucci G. G.; Piper L. F. J.; Cabana J. Mapping Competitive Reduction upon Charging in LiNi0.8Co0.15Al0.05O2 Primary Particles. Chem. Mater. 2020, 32 (14), 6161–6175. 10.1021/acs.chemmater.0c01986. [DOI] [Google Scholar]
- Wise A. M.; Weker J. N.; Kalirai S.; Farmand M.; Shapiro D. A.; Meirer F.; Weckhuysen B. M. Nanoscale Chemical Imaging of an Individual Catalyst Particle with Soft X-ray Ptychography. ACS Catal. 2016, 6 (4), 2178–2181. 10.1021/acscatal.6b00221. [DOI] [PMC free article] [PubMed] [Google Scholar]
- Hirose M.; Ishiguro N.; Shimomura K.; Burdet N.; Matsui H.; Tada M.; Takahashi Y. Visualization of Heterogeneous Oxygen Storage Behavior in Platinum-Supported Cerium-Zirconium Oxide Three-Way Catalyst Particles by Hard X-ray Spectro-Ptychography. Angew. Chem., Int. Ed. 2018, 57 (6), 1474–1479. 10.1002/anie.201710798. [DOI] [PubMed] [Google Scholar]
- Hirose M.; Ishiguro N.; Shimomura K.; Nguyen D.-N.; Matsui H.; Dam H. C.; Tada M.; Takahashi Y. Oxygen-diffusion-driven oxidation behavior and tracking areas visualized by X-ray spectro-ptychography with unsupervised learning. Communications Chemistry 2019, 2 (1), 50. 10.1038/s42004-019-0147-y. [DOI] [Google Scholar]
- Yuan H.; Yuan H.; Casagrande T.; Shapiro D.; Yu Y.-S.; Enders B.; Lee J. R. I.; van Buuren A.; Biener M. M.; Gammon S. A.; Baumann T. F.; Hitchcock A. P. 4D Imaging of ZnO-Coated Nanoporous Al2O3 Aerogels by Chemically Sensitive Ptychographic Tomography: Implications for Designer Catalysts. ACS Appl. Nano Mater. 2021, 4 (1), 621–632. 10.1021/acsanm.0c02924. [DOI] [Google Scholar]
- Ihli J.; Diaz A.; Shu Y.; Guizar-Sicairos M.; Holler M.; Wakonig K.; Odstrcil M.; Li T.; Krumeich F.; Müller E.; Cheng W.-C.; Anton van Bokhoven J.; Menzel A. Resonant Ptychographic Tomography Facilitates Three-Dimensional Quantitative Colocalization of Catalyst Components and Chemical Elements. J. Phys. Chem. C 2018, 122 (40), 22920–22929. 10.1021/acs.jpcc.8b05624. [DOI] [Google Scholar]
- Wu J.; Zhu X.; West M. M.; Tyliszczak T.; Shiu H.-W.; Shapiro D.; Berejnov V.; Susac D.; Stumper J.; Hitchcock A. P. High-Resolution Imaging of Polymer Electrolyte Membrane Fuel Cell Cathode Layers by Soft X-ray Spectro-Ptychography. J. Phys. Chem. C 2018, 122 (22), 11709–11719. 10.1021/acs.jpcc.8b02933. [DOI] [Google Scholar]
- Yu Y.-S.; Farmand M.; Kim C.; Liu Y.; Grey C. P.; Strobridge F. C.; Tyliszczak T.; Celestre R.; Denes P.; Joseph J.; Krishnan H.; Maia F. R. N. C.; Kilcoyne A. L. D.; Marchesini S.; Leite T. P. C.; Warwick T.; Padmore H.; Cabana J.; Shapiro D. A. Three-dimensional localization of nanoscale battery reactions using soft X-ray tomography. Nat. Commun. 2018, 9 (1), 921. 10.1038/s41467-018-03401-x. [DOI] [PMC free article] [PubMed] [Google Scholar]
- Donnelly C.; Guizar-Sicairos M.; Scagnoli V.; Holler M.; Huthwelker T.; Menzel A.; Vartiainen I.; Müller E.; Kirk E.; Gliga S.; Raabe J.; Heyderman L. J. Element-Specific X-Ray Phase Tomography of 3D Structures at the Nanoscale. Phys. Rev. Lett. 2015, 114 (11), 115501. 10.1103/PhysRevLett.114.115501. [DOI] [PubMed] [Google Scholar]
- Gao Z.; Odstrcil M.; Bocklein S.; Palagin D.; Holler M.; Ferreira Sanchez D.; Krumeich F.; Menzel A.; Stampanoni M.; Mestl G.; van Bokhoven J. A.; Guizar-Sicairos M.; Ihli J. Sparse ab initio x-ray transmission spectrotomography for nanoscopic compositional analysis of functional materials. Sci. Adv. 2021, 7 (24), eabf6971 10.1126/sciadv.abf6971. [DOI] [PMC free article] [PubMed] [Google Scholar]
- Arul K. T.; Chang H.-W.; Shiu H.-W.; Dong C.-L.; Pong W.-F. A review of energy materials studied by in situ/operando synchrotron x-ray spectro-microscopy. J. Phys. D: Appl. Phys. 2021, 54 (34), 343001. 10.1088/1361-6463/ac017f. [DOI] [Google Scholar]
- Kourousias G.; Bozzini B.; Jones M. W. M.; Van Riessen G. A.; Dal Zilio S.; Billè F.; Kiskinova M.; Gianoncelli A. Monitoring dynamic electrochemical processes with in situ ptychography. Appl. Nanosci. 2018, 8 (4), 627–636. 10.1007/s13204-018-0703-2. [DOI] [Google Scholar]
- Kahnt M.; Grote L.; Brückner D.; Seyrich M.; Wittwer F.; Koziej D.; Schroer C. G. Multi-slice ptychography enables high-resolution measurements in extended chemical reactors. Sci. Rep. 2021, 11 (1), 1500. 10.1038/s41598-020-80926-6. [DOI] [PMC free article] [PubMed] [Google Scholar]
- Lo Y. H.; Zhao L.; Gallagher-Jones M.; Rana A.; J. Lodico J.; Xiao W.; Regan B. C.; Miao J. In situ coherent diffractive imaging. Nat. Commun. 2018, 9 (1), 1826. 10.1038/s41467-018-04259-9. [DOI] [PMC free article] [PubMed] [Google Scholar]
- Gao Z.; Holler M.; Odstrcil M.; Menzel A.; Guizar-Sicairos M.; Ihli J. Nanoscale crystal grain characterization via linear polarization X-ray ptychography. Chem. Commun. 2020, 56 (87), 13373–13376. 10.1039/D0CC06101H. [DOI] [PubMed] [Google Scholar]
- Mille N.; Yuan H.; Vijayakumar J.; Stanescu S.; Swaraj S.; Desjardins K.; Favre-Nicolin V.; Belkhou R.; Hitchcock A. P. Ptychography at the carbon K-edge. Commun. Mater. 2022, 3 (1), 8. 10.1038/s43246-022-00232-8. [DOI] [Google Scholar]
- Hughes L. A.; Savitzky B. H.; Deng H. D.; Jin N. L.; Lomeli E. G.; Yu Y.-S.; Shapiro D. A.; Herring P.; Anapolsky A.; Chueh W. C.; Ophus C.; Minor A. M.. Correlative analysis of structure and chemistry of LixFePO4 platelets using 4D-STEM and X-ray ptychography. Mater. Today 2021, 10.1016/j.mattod.2021.10.031. [DOI] [Google Scholar]
- Deng J.; Vine D. J.; Chen S.; Nashed Y. S. G.; Jin Q.; Phillips N. W.; Peterka T.; Ross R.; Vogt S.; Jacobsen C. J. Simultaneous cryo X-ray ptychographic and fluorescence microscopy of green algae. Proc. Natl. Acad. Sci. U. S. A. 2015, 112, 2314–2319. 10.1073/pnas.1413003112. [DOI] [PMC free article] [PubMed] [Google Scholar]