Correction to: J Exp Clin Cancer Res 38, 299 (2019)
https://doi.org/10.1186/s13046-019-1185-0
Following publication of the original article [1], minor errors were discovered in Figs. 1 and 4; specifically:
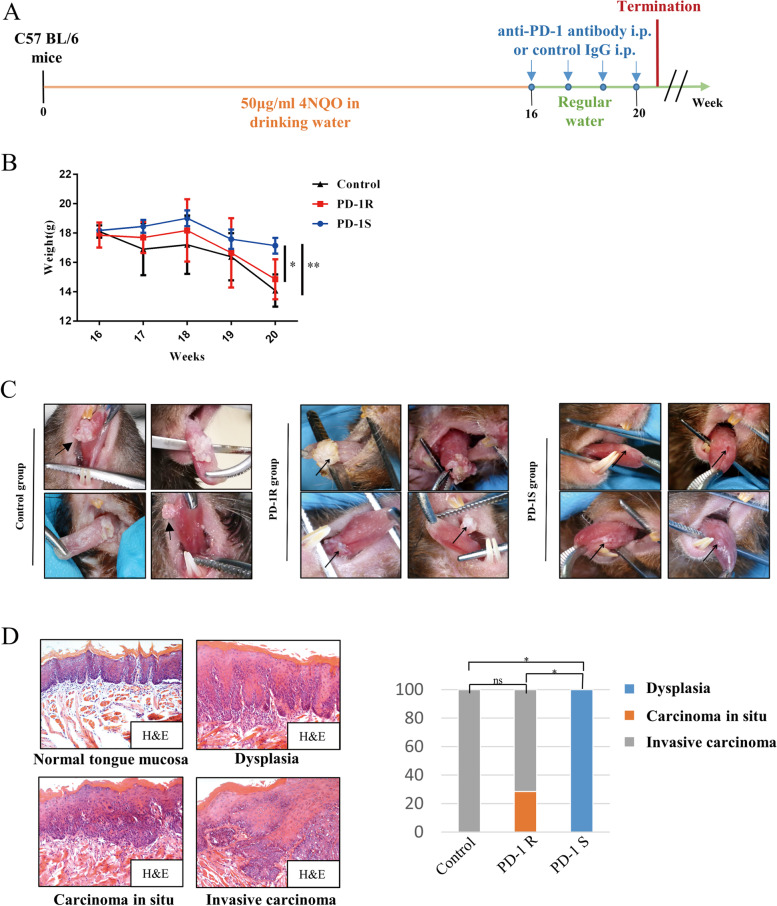
Fig. 1c: an image from the PD-1R group was incorrectly used for a representative picture the Control group; the top right image has now been corrected
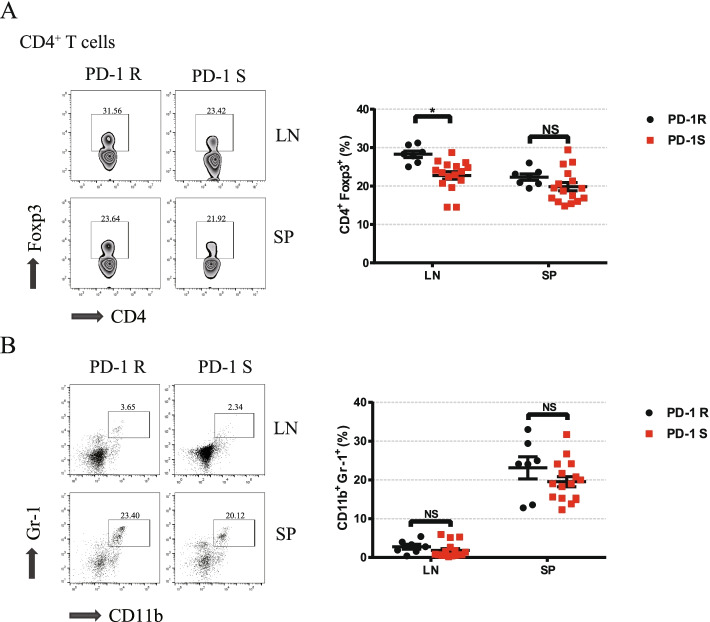
Fig. 4b: the top two flow cytometry panels were duplicated in error; the top right panel has now been corrected
Fig. 1.
PD-1 blockade resistance occurred in the oral malignant transformation mouse model. a The schematic picture shows the 4NQO treatment and anti-PD-1 antibody(n = 23) and control IgG (vehicle control, n = 5) drug delivery strategies in C57BL/6 mice. b Body weight (g) was measured and documented for the control group and anti-PD-1 group (the PD-1R and PD-1S groups) once a week. Significant weight loss was observed in the PD-1R group at week 20. The data are presented as the mean ± SEM (one-way repeated-measures ANOVA, *P < 0.05, **P < 0.01). c Representative macroscopic observation of the lingual mucosal lesions after treatment with control IgG (left panel) or anti-PD-1 antibody in the PD-1R group (middle panel) and PD-1S group (right panel). For PD-1R group, similarly with control group, leukoplakia-like lesions with smooth surfaces progressed into white masses with cauliflower-like (upper left), rough and granular (upper right) or exogenous verrucous surfaces (lower right and left). The lingual mucosal lesions treated with anti-PD-1 antibodies maintained a wrinkled paper-like appearance macroscopically in PD-1S group. d Representative hematoxylin and eosin (H&E) staining of dysplasia, carcinoma in situ (pre-invasive carcinoma) and invasive carcinoma. Statistical significance was determined by the Kruskal-Wallis test, *P < 0.05
Fig. 4.
Relative distributions of key immunosuppressive cells after the anti-PD-1 antibody treatment. a, b Flow cytometry analysis was performed to characterize and quantify Tregs (CD4+Foxp3+) and MDSCs (CD11b+Gr-1+). Compared to the PD-1S group, the PD-1R group exhibited an increase in Treg accumulation. All data represent the mean ± SEM. Statistical significance was determined by Student’s t test, *P < 0.05. Tregs, regulatory T cells; MDSCs, myeloid-derived suppressor cells
The corrected figures are given here. The correction does not have any effect on the final conclusions of the paper.
Footnotes
Liling Wen and Huanzi Lu contributed equally to this work.
Reference
- 1.Wen L, Lu H, Li Q, et al. Contributions of T cell dysfunction to the resistance against anti-PD-1 therapy in oral carcinogenesis. J Exp Clin Cancer Res. 2019;38:299. doi: 10.1186/s13046-019-1185-0. [DOI] [PMC free article] [PubMed] [Google Scholar]


