

Summary
With the recent advancements in genome editing, next-generation sequencing (NGS), and scalable cloning techniques, scientists can now conduct genetic screens at unprecedented levels of scale and precision. With such a multitude of technologies, there is a need for a simple yet comprehensive pipeline to enable systematic mammalian genetic screening. In this study, we develop unique algorithms for target identification and a toxin-less Gateway cloning tool, termed MegaGate, for library cloning which, when combined with existing genetic perturbation methods and NGS-coupled readouts, enable versatile engineering of relevant mammalian cell lines. Our integrated pipeline for sequencing-based target ascertainment and modular perturbation screening (STAMPScreen) can thus be utilized for a host of cell state engineering applications.
Keywords: genetic screening, transcription factors, CRISPR, gene regulatory networks, stem cells
Graphical abstract
Highlights
-
•
Provides two computational methods for screening target identification
-
•
Compares CRISPRa/i and cDNA overexpression tools performance in hiPSCs
-
•
Develops MegaGate, a high-throughput toxin-less Gateway molecular cloning tool
-
•
Demonstrates methods for barcode and transcript capture in NGS screening readouts
Motivation
The ability to reliably engineer a cell type or tissue of interest is a critical goal of stem cell biology, regenerative medicine, and therapeutic development. In recent years, significant technical advances in genome editing, next-generation sequencing (NGS), and high-throughput cloning have enabled the development of robust tools for gene regulatory network perturbation and their subsequent readout. Nonetheless, no study has integrated this diverse toolkit into a facile workflow for generation of unique cellular identities. The STAMPScreen pipeline, presented here, integrates computational and experimental methods to identify, construct, and induce key regulatory factors in a streamlined and replicable manner.
Kramme et al. develop STAMPScreen, an integrated mammalian genetic screening pipeline. The authors develop methods for screening target identification and perturbation tool selection. They develop MegaGate, a toxin-less Gateway cloning tool for ORF library creation. Finally, they demonstrate utilization of STAMPScreen in NGS-coupled readouts for simultaneous transcript and barcode capture.
Introduction
Recent technological advancements in large-scale cloning, genome editing, and next-generation sequencing (NGS) have enabled scientists to perform genetic screens at unprecedented levels of scale and precision. Previous studies have leveraged these tools for the interrogation of fundamental biological processes that underpin mammalian development, physiology, and pathology. Studies such as genome-wide CRISPR screens for identifying chemotherapeutic drug targets (Wei et al., 2019), single-cell profiling of the entire human embryo developmental trajectory (Cao et al., 2020; Domcke et al., 2020), and characterization of the effect of transcription factor (TF) overexpression in the context of human induced pluripotent stem cell (hiPSC) differentiation for nearly all human TFs (Ng et al., 2020) demonstrate the value of pairing effective gene engineering tools with NGS-coupled readouts. However, despite these technological advances, there is not yet a straightforward, unified pipeline for gene target identification, perturbation tool selection, library cloning, and readout assessment, which can effectively serve as an end-to-end workflow for mammalian genetic screening.
As publicly available gene expression and chromatin accessibility datasets have drastically increased in quality and abundance, new in silico tools have become more effective at predicting screening targets (Jung et al., 2021; Rackham et al., 2016; Schlitt and Brazma, 2007). However, many of these tools require multiple types of data that might not be available, and they are mostly limited to cell differentiation projects. To expand the scope and the feasibility of computational target prediction, versatile tools are required that can be applied to any cell engineering screen and can effectively analyze different types of data to accurately infer gene targets.
With the advent of genome-editing tools and the major decrease in the cost of NGS, there now exist readily available tools for the large-scale perturbation of mammalian genomes, such as CRISPR single-guide RNA (sgRNA) libraries and the cDNA hORFeome, which enable researchers to target nearly any human gene for functional characterization (Mardis, 2011; Rual, 2004). However, the recent development of robust gene perturbation technologies has created a need for systematic studies that evaluate and compare the performance of these tools in relevant human cell lines, to allow researchers to select the appropriate tool for their specific application. In addition, common genetic tools, such as cDNA overexpression have so far been difficult to apply at scale due to hurdles in molecular cloning, thereby limiting their utility.
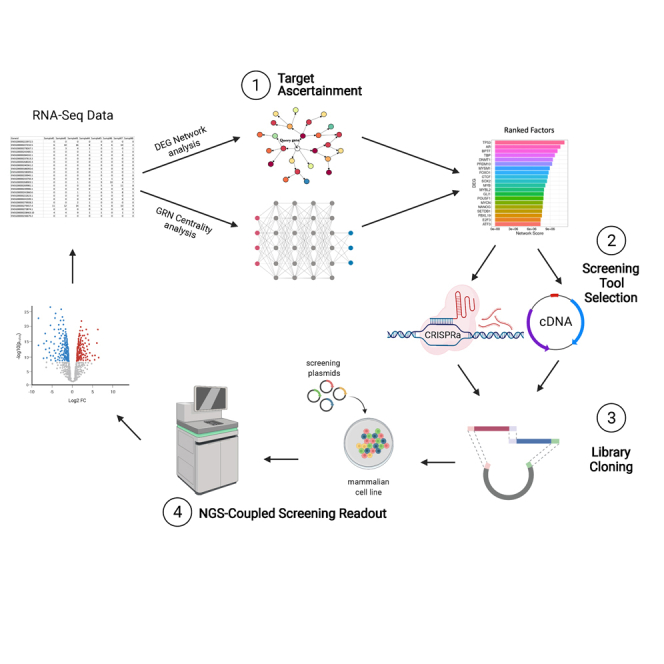
Considering the technological and scientific advancements in each of these areas of biology and their inherent limitations and applicability to different biological systems, there is a need for a salient, efficient pipeline that provides an integrated solution for systematic mammalian genetic screening studies. This article seeks to directly address this gap in the literature through the development of target identification and library cloning tools, which can be combined with NGS-coupled readouts for cellular engineering of relevant mammalian cells. Using these tools, we developed an all-in-one integrated pipeline for sequencing-based target ascertainment and modular perturbation screening (STAMPScreen) (Figure 1).
Figure 1.

STAMPScreen schematic workflow
Schematic representation of the STAMPScreen pipeline, highlighting in silico target ascertainment, screening tool selection, library cloning, and NGS-coupled screening readout. STAMPScreen generates data that feed into iterative cycles of the workflow.
Results
In silico methods for gene target identification
The rapid improvement of NGS technologies has led to a decrease in the cost of sequencing and a subsequent increase in the amount of biological data generated from different cell types under various conditions. These data serve as a powerful resource for hypothesis-generating studies, especially for projects aimed at cell engineering. However, a major bottleneck in this area of biology has been the lack of accurate tools that can analyze different types of large datasets and extract accurate information for cell engineering target identification. Here, we present two different methods for predicting phenotype conversion perturbations from bulk and single-cell RNA sequencing (RNA-seq) data.
Differential gene expression analysis (DGEA) has been the most widely used method for identifying statistically significant transcriptomic changes between treatment samples and controls (Love et al., 2014; Robinson et al., 2009). While DGEA has helped identify causal genes for various transcriptomic changes and performs adequately in a well-controlled study with a defined intervention, the method prioritizes factors overexpressed at specific stages, thus inferring correlation rather than causality, and it loses its predictive power when applied to more drastic gene expression perturbations. More recently, gene regulatory network (GRN)-based approaches, such as CellOracle and IRENE, have been developed to identify factors that increase cell conversion efficiencies by integrating RNA-seq and chromatin accessibility single-cell data (Jung et al., 2021; Kamimoto et al., 2020). However, these methods require access to both transcriptomic and epigenomic single-cell datasets that may not be readily available for cell types of interest. In addition, network analysis of gene essentiality have been conducted, but to this point have been limited to CRISPR screening data (Jiang et al., 2015). To address the shortcomings of these frameworks, we present two complementary target ascertainment methods that use genetic and protein networks to accurately infer targets for cell engineering screens.
DEG network analysis
Using a similar approach to Rackham et al. (2016), we developed a differentially expressed gene (DEG) network scoring method utilizing transcriptomic data from a starting cell state and a target cell state. In our method, we first performed a DGEA to determine significant gene expression changes, and then we generated a DEG score for each gene by combining the traditional DEG metrics (fold-change, p value) with cell phenotype information (correlation with desired phenotype). To infer phenotype causality as well as identify DEGs with small changes but potential large effects, we added a layer of protein network connectivity to our DEG scoring. Using the STRING interaction database (Szklarczyk et al., 2014), we traversed each DEG’s protein network across three layers and calculated a score that combines its DEG score with the degree of connectivity. The resulting list preferentially ranks DEGs with large significant changes between the two cell states that are also highly connected to other highly differentially expressed DEGs (Figure 2A). We validated our method using RNA-seq data from differently aged human primary fibroblasts (Fleischer et al., 2018) to identify causal aging genes. Our analysis shows that the DEG network scoring method generates a ranked list of targets that has a significantly high enrichment of known experimentally validated aging genes, unlike plain DGEA or ranking based on common metrics (Figure 2B).
Figure 2.

In silico target ascertainment
(A) DEG network target identification pipeline. DGEA was used to determine significant changes between the starting and target cell state. Using publicly available protein interaction networks, DEGs are scored based on their connectivity and differential expression levels.
(B) Validation of the DEG network analysis method applied to the fibroblast aging phenotype. The list of all DEGs and top 100 ranked lists based on common metrics and our network score were tested for enrichment of known aging genes from the GenAge database.
(C) Graph theory-based TF discovery pipeline. Gene regulatory networks are inferred from time-series RNA sequencing data. PageRank with a standard residual probability of 0.85 was utilized to rank TFs by centrality score.
(D) Prediction of central TFs in known differentiation protocols using graph theory-based TF discovery pipeline. Experimentally validated TFs are indicated, demonstrating predictive capability of the pipeline.
GRN centrality analysis
While our DEG network analysis approach addresses the shortcomings of traditional DGEA, it is inherently dependent on the availability of protein interaction data and not highly sensitive to small intermediary transcriptomic changes across time-series data. To provide an alternative tool that overcomes these limitations, we sought to develop a unique algorithm by combining time-series transcriptomic data with graph theory-based centrality analysis. To do this, we utilized stochastic gradient boosting machines to train GRNs and calculated the PageRank of each genetic factor post network construction and graph pruning (Moerman et al., 2018; Page et al., 1999). Our simple pipeline requires a normalized fold-change representation for each gene at different stages of the cell state conversion and generates a graphical representation of ranked factors with the highest global importance (Figure 2C). We validated our pipeline using existing RNA-seq datasets of neuronal stem cell, myoblast, and melanocyte differentiation (Burke et al., 2020; Choi et al., 2020; Liu et al., 2019). Our results demonstrate that the algorithm can effectively identify known experimentally validated causal regulators within the predicted top factors (Figure 2D). Compared with traditional DEG approaches, these two methods generate candidate gene lists enriched for known genes related to the studied phenotype, showcasing the accuracy of our methods when applied to complex phenotypes.
Modular perturbation tools
After ascertaining the targets for a desired cell engineering screen using the previously presented methods, the STAMPScreen workflow requires the choice of a perturbation tool. Gene perturbation in mammalian cells can be performed either at the endogenous locus of a specific target via effector proteins that activate transcription, such as CRISPR-Cas (Chavez et al., 2016) or exogenously through cDNA expression via inducible or constitutive promoters (Arnoldo et al., 2014). Both CRISPR and cDNA technologies have been leveraged in recent mammalian screens to effectively target genes of interest in an individual or combinatorial manner (Chavez et al., 2015, 2016; Konermann et al., 2014; Qi et al., 2013; Horlbeck et al., 2016; Bikard et al., 2013; Gilbert et al., 2013; Zalatan et al., 2015; Tak et al., 2017; Zhang et al., 2017; Liu et al., 2019; Yeo et al., 2018; Shimojima et al., 2020; Parekh et al., 2018).
To generate an integrated pipeline for gene perturbation, we evaluated existing gene perturbation tools and developed powerful technologies for cDNA and CRISPR screening. We performed a rigorous evaluation in hiPSCs of the relative performance of three popular CRISPRa constructs, two CRISPRi tools, and five cDNA overexpression vectors. Finally, we generated unique tools for dual cDNA and CRISPR screening, which enable researchers to overexpress genes via cDNA while simultaneously expressing sgRNAs to target native genes for suppression or induction.
CRISPRa performance in hiPSCs
Recent comprehensive comparisons of the three most popular CRISPRa tools (synergistic activation mediator [SAM], VP64-based SunTag, and VP64, p65, and RtTa [VPR]; Chavez et al., 2016; Konermann et al., 2014; Tanenbaum et al., 2014) have been performed in a variety of cell types, but no study has compared the three activators in hiPSCs. We therefore evaluated the performance of the three CRISPRa tools for overexpressing 47 target genes in the hiPSC line PGP1. On average, dCas9-VPR induced stronger expression across the tested genes, when compared with dCas9-SAM and dCas9-SunTag, while SAM showed modest levels of improvement over SunTag (Figure 3A). For all three activators, genes with high basal expression were more difficult to overexpress using any of the three CRISPRa technologies, in line with previous studies (Figure S1A) (Chavez et al., 2015). Based on these results, we conclude that, for CRISPRa screens in hiPSCs, dCas9-VPR is the optimal tool as compared with dCas9-SAM and dCas9-SunTag.
Figure 3.

Gene perturbation tool evaluation
Systematic comparison of CRISPRa, CRISPRi, and cDNA function were performed in the hiPSC line PGP1. Analysis was performed using qRT-PCR with duplicates and the ΔΔCq method was utilized to determine relative expression to a no plasmid control duplicate. For CRISPRa and cDNA (A and C), cells were harvested 48 h post-transfection; for CRISPRi (B), cells were harvested at 72 h post-transfection. Induction using dCas9-VPR, SAM, and SunTag was performed on 47 gene targets in hiPSCs, cDNA induction was performed on 17 genes targets, and CRISPRi repression was performed on 12 gene targets. Significance by Mann-Whitney test. The pink line shows median values, dashed black lines are 95 CI. For systematic comparison of cDNA induction using the PB-TA-ERP2, XLone, cT3G, cERP2, and cERP2-cT3G vectors expressing sfGFP (D). Cells were harvested for flow cytometry after 24 h of doxycycline induction and screens were performed in duplicate with and without doxycycline. Geometric mean fluorescent intensity of all live singlet cells was plotted for each condition. For demonstration of dual expression vectors (E) a constitutive mCherry cDNA was expressed along with a sgRNA targeting a Tet promoter. This vector was co-nucleofected with dCas9-KRAB-MeCP2 into an hiPSC line harboring a Tet-sfGFP under induction. Cells were harvested 96 h later for flow cytometry. Relative expression was calculated as MFI compared with no plasmid control. The right panel shows a similar setup but with a sfGFP cDNA vector under Tet promoter and an sgRNA targeting an integrated tdTomato construct. The plasmid was co-nucleofected with dCas9-VPR and cells were harvested 48 h later for flow cytometry, relative expression was calculated as MFI compared with no plasmid control. Calculated p values are represented as follows: ∗∗∗p ≤ 0.001, ∗∗∗∗p ≤ 0.0001.
CRISPRi performance in hiPSCs
We additionally evaluated the performance of two highly utilized CRISPRi tools, dCas9-KRAB and dCas9-KRAB-MeCP2, against 12 gene targets in hiPSCs (Yeo et al., 2018). Our results demonstrate that dCas9-KRAB-MeCP2 induces higher gene knockdown compared with dCas9-KRAB, in line with previous findings (Figure 3B). We also observe that the level of repression was locus dependent, with a knockdown of greater than 95% at certain loci while others showed minimal change in transcript abundance. The source of this resistance to suppression could be from poorly functioning sgRNAs, as our study screened only one sgRNA per target. In addition, local chromatin architecture, interference from native transcriptional regulators, or insufficient waiting period between knockdown and observation may also play a role (Yeo et al., 2018). In addition, it may be possible that genes that lie near the target are likewise affected in their expression by KRAB silencing. Previous studies have looked at this possible leakage with no definitive conclusions but, based on their data, it seems that this is uncommon but warrants further research (Yeo et al., 2018). Based on our data, we conclude that dCas9-KRAB-MeCP2 is the optimal CRISPRi tool for gene suppression in hiPSCs.
cDNA overexpression performance in hiPSCs and primary human fibroblasts
To compare the expression dynamics of CRISPRa and cDNA overexpression, we tested constitutive expression of 17 open reading frames (ORFs) in hiPSCs that we previously targeted using CRISPRa. Overall, cDNA overexpression demonstrated higher induction levels compared with CRISPRa, but similar to CRISPRa showed minimal overexpression for genes with higher basal expression (Figures 3C and S1B). In addition, we compared two common doxycycline-inducible plasmids, XLone (Randolph et al., 2017) and PB-TA-ERP2 (Kim et al., 2016), and found that XLone-based expression had low background (signal in the absence of doxycycline) and low inducibility (signal in the presence of doxycycline), while PB-TA-EPR2 showed high background and high inducibility in both hiPSCs and primary normal human fibroblasts (NHDFs) (Figures 3D and S2D). To combine the desirable features of both vectors, we used the XLone plasmid as a base vector and replaced the blasticidin selection with puromycin and additionally constructed three modified plasmids utilizing components of PB-TA-ERP2. We cloned a minimal cytomegalovirus (CMV) promoter downstream of the Tet promoter (cT3G), a CMV enhancer upstream of the rtTA-3G (cERP2), and both together (cERP2-cT3G). We then tested the performance of the three new vectors in hiPSCs and NHDFs and show that the CMV promoter enhances induction in both fibroblasts and hiPSCs and that the CMV enhancer additionally increases induction in hiPSCs (Figures 3D and S2C). The cT3G and cERP2-cT3G vectors both exhibit robust inducibility to a broad range of doxycycline concentrations, and demonstrate stable, increasing expression for over a week and negligible silencing after a month (Figures S2A and S2B). We additionally cloned IRES2 fluorescent constructs mTagBFP2, mCherry, and mNeonGreen into cT3G and cERP2-cT3G and observed robust expression of both the primary ORF and fluorescent construct (Figure S2C). For many genetic studies, high levels of overexpression of targets may not be beneficial to address the underlying question as this may lead to spurious, non-biologically relevant results. However, we believe that providing a tunable vector with a broad range of induction levels allows the user to best customize their expression to their desired outcome. Where extensive levels of induction are needed, such as in synthetic differentiation screens or polycistronic cassettes like IRES-coupled fluorescent expression, we believe these vectors perform optimally. In addition, the tunable nature of our vectors demonstrates strong doxycycline response curves that have linear ranges of response that can be utilized for precise dosage control in studies that require it. Based on these findings, we conclude that cDNA overexpression produces similar or higher transcript levels than CRISPRa in hiPSCs. We further develop robust doxycycline-inducible tools for tunable gene expression in hiPSCs and NHDFs with high induction efficiency and low background expression.
Dual gene perturbation via cDNA overexpression and CRISPR
Recent studies have shown that CRISPRa and CRISPRi can function as potent combinatorial gene perturbation tools, capable of target overexpression, repression, or both within a single cell (Zalatan et al., 2015; Lian et al., 2017; Hazelbaker et al., 2020). To further expand the mammalian gene perturbation toolkit, we aimed to combine cDNA overexpression with the CRISPRa/i system in the same vector. We designed plasmids that express both a cDNA construct from an inducible or constitutive promoter and an sgRNA from the human U6 promoter. We transfected the aforementioned plasmids into a hiPSC cell line harboring an integrated dCas9-VPR or dCas9-KRAB-MeCP2, and dual gene induction and dual overexpression and repression was achieved, showing 10- to 200-fold cDNA induction, 10-fold CRISPRa induction, and 50% CRISPRi repression (Figure 3E). Based on our findings, our dual cDNA-CRISPR perturbation tool will provide a valuable resource for screening studies that aim to perform both exogenous and endogenous perturbations, such as cDNA screens paired with genome-wide CRISPRi libraries for pathway analysis.
Library cloning
Having decided on a gene target list and perturbation tool, the next step in our proposed STAMPScreen workflow consists of generating a viable screening library. For CRISPR studies, sgRNA cloning through Golden Gate reactions are efficient and scalable, having enabled many genome-wide CRISPR screens (Vad-Nielsen et al., 2016; Engler et al., 2008). However, molecular cloning of cDNA, particularly at library scale into barcoded vectors, has proved to be cumbersome and difficult with existing technologies such as Golden Gate, Gibson Assembly, or Gateway cloning (Kirchmaier et al., 2013; Magnani et al., 2006; Gibson et al., 2009). We therefore developed a powerful method for cDNA cloning, termed MegaGate, which combines the lack of sequence bias found in Gateway cloning with the combinatorial capacity of restriction cloning.
MegaGate—A unique toxin-less recombination cloning tool
MegaGate utilizes the lambda phage recombination technology of Gateway cloning to shuttle a DNA sequence of interest into a desired destination vector. Uniquely, our method eliminates the need for a ccdB toxin cassette by replacing it entirely with restriction enzyme recognition sites (Figure 4A). Through recombinase insertion of the cDNA construct and linearization of the unreacted destination vectors, only the desired vectors propagate in the bacterial transformant pool (Figure 4A). We identified an optimized set of reaction conditions that regularly demonstrates 99.8% or greater cloning efficiencies and high positive colony plating (Figure S3). Moreover, the utilization of the Gateway att sites makes MegaGate compatible with all existing pENTR ORF libraries such as the hORFeome and TFome, enabling it to be readily usable in many labs.
Figure 4.

MegaGate, a toxin-less cDNA cloning method
(A and B) (A) Schematic representation of the MegaGate cloning reaction. (B) Percent ORF capture (pink) measured as the ratio of input genes captured in expression vectors in a single MegaGate cloning reaction for single genes and pooled groups. Number of barcodes captured per gene (teal) for the single genes and pools was determined via NGS alignment of destination vector amplicons.
(C–E) Cloning efficiency as a function of ORF length. Cloning efficiency was measured as the relative abundance of the gene in the expression vector pool divided by the relative abundance of the gene in the pDONOR pool, as measured by NGS counts. Genes are arrayed by length on the x axis.
The MegaGate reaction is highly modular, amenable to volume scaling, isothermal reactions, all-in-one or multi-step reaction mixtures, differential enzyme recognition sites, and highly variable insert sizes (Figure S3). In addition, the utilization of meganucleases, which have highly rare and specific recognition sequences, allows the use of a single MegaGate vector for cloning almost any known coding sequence without further plasmid or gene modification. Furthermore, we showed that other restriction enzymes, such as those in the type IIS family, can also be used in place of meganucleases, making the cloning strategy highly modular for use in a variety of cloning applications (Figure S3). In addition, we highlight MegaGate’s compatibility with the BP Clonase enzyme mix to clone pENTR ORFs from cDNA PCR inserts (Figure S3). Based on our findings, MegaGate is a simple and efficient cDNA cloning tool for the generation of ORF libraries using pENTR libraries and non-barcoded or barcoded MegaGate destination vectors.
Validation of MegaGate in single and pooled cloning
To evaluate the performance of MegaGate single gene cloning, we cloned 200 pENTR genes individually into two different barcoded MegaGate destination vectors, yielding 100% ORF capture and 25–200 barcoded transformants per reaction (Figure S4). For testing pooled cloning, we pooled a total of 948 genes from the hORFeome into 3 pools of 316 pENTR vectors normalized by size. We then utilized MegaGate to clone the pools into a pool of barcoded MegaGate destination vectors. Utilizing amplicon sequencing, we then characterized our initial pENTR pool and our resulting expression vector pools to determine the percentage of our plasmids that were converted into expression vectors and to assign barcodes to each ORF. On average, we captured 95% of input ORFs (900/948) from the 3 pools, each with 1–500 unique DNA barcodes per gene (Figure 4B). In addition, our data show that MegaGate demonstrates a size dependence, with smaller ORFs cloning more efficiently relative to larger ORFs (Figure 4C). When there is little variance in insert length, MegaGate cloning generally maintained the ORF relative abundance, whereby the distribution of ORFs in the expression pool mirrors that in the pENTR pool (Figure 4C). Based on the results, MegaGate is an efficient cDNA cloning tool for generating barcoded ORF libraries, capable of cloning single or pools of 300+ ORFs at high throughput and low cost.
Screening and NGS-coupled readouts
Having ascertained the genetic targets for the phenotype of interest, selected a gene perturbation tool, and generated the screening library for the relevant biological system, our cell conversion workflow next focuses on optimizing the screening pipeline, performing the screen, and analyzing the data. Here, we present current and relevant methods for these final steps in the STAMPScreen protocol.
The two most common integrative gene delivery systems are the lentiviral (LV) transduction and the PiggyBac (PB) transposon system (Zufferey et al., 1997; Yusa et al., 2011). Their respective advantages and disadvantages have been discussed previously (Vargas et al., 2016), but one important consideration when using the PB system for screening purposes is the resulting copy number. While this variable is easily optimized in the LV system through multiplicity of infection titration, the PB system requires cell line-specific optimization, since the copy number will be correlated with the amount of DNA and its delivery efficiency. Our data suggest that the transgene copy number varies linearly with the ratio of transposon:transposase within a certain range where the transposon is not in saturation or ultra limiting, after which the number of integrations plateaus (Figure 5A). We selected single-cell clones from hiPSC integrant pools and additionally showed the copy number varies within a population following a Poisson distribution (Figure S4). We suggest performing transposon titration at a fixed amount of transposase to determine the appropriate ratio for obtaining the desired copy number in a given biological system.
Figure 5.

NGS-coupled readouts
(A) PiggyBac integration copy number was measured using qRT-PCR on genomic DNA. Integrant-specific primers and a single copy gene RPP30 were used. A 2 × ΔCq measurement was used to determine copy number for n = 2 biological replicates. Error bars are standard deviation.
(B) Barcode enrichment analysis (Bar-seq) was performed on hiPSC pools with 54 barcoded gene insertions and barcoded GFP insertions. RNA was harvested after FACS 72 h post-induction, and barcodes were amplified for NGS. Relative abundance was measured as the relative read count of each gene barcode compared with the total read count of all barcodes.
(C) Two barcoded genes, GFP and ZGLP1, were integrated into hiPSCs and induced for 72 h in duplicate. RNA was harvested and RNA-seq was performed. DEseq2 was utilized to calculate log2fc and p values and an exact match kmer was used to identify the gene barcode.
(D) Forty barcoded genes were integrated into hiPSCs and induced for 3 days and RNA was harvested and converted to cDNA. A primer pool for all 40 genes was used to amplify the 40 targets for NGS as well as their barcodes in the DOX OFF and DOX ON pools. Relative gene expression was calculated as relative read counts normalized to GAPDH for each pool. Calculated p values are represented as follows: ∗∗∗∗p ≤ 0.0001.
One of the main advantages of using the STAMPScreen pipeline in a given screen is its coupling of phenotype-specific readouts with NGS, enabling high-throughput characterization. If a given cellular phenotype does not have a well-established imaging-based high-throughput assay, targeted RNA sequencing (TAR-seq) can offer accurate information about a subset of the cellular transcriptome in a scalable manner (Martin et al., 2016). For example, a screen for the activation of certain cellular pathways, where the primary goal is the induction of specific transcripts, would be an obvious application. Our data show that, with proper design considerations and reaction optimizations, up to 70 RNA targets, including vector barcodes, can be quantified in a single reaction at precision levels comparable with qPCR (Figure S5). This method allows for the interrogation of a limited number of transcripts across hundreds of perturbations in a scalable and cost-effective manner.
When considering pooled screens of barcoded vectors, NGS readout coupling becomes necessary for matching the perturbation to the observed phenotype. Regardless of the screening readout (e.g., flow cytometry, targeted sequencing, scRNA sequencing, combination of flow and RNA sequencing), a barcode enrichment analysis is required for pooled screening approaches. Upon isolating a specific cell population and assigning it a signal value, the associated genetic perturbation can be identified by amplifying and sequencing barcodes from the gDNA or RNA of the cells (Bar-seq) (Smith et al., 2009). To demonstrate Bar-seq utilizing our vectors, we FACS isolated barcoded GFP-expressing cells from a pool of cells harboring 159 barcodes and showed that the GFP-associated barcodes were significantly enriched in the FACS-positive pool (Figure 5B). In addition, we overexpressed two genes in separate hiPSC populations and performed bulk RNA-seq and demonstrated that we could capture both the whole transcriptome of the population as well as the gene-associated barcode for RNA-seq coupled to barcode enrichment analysis (Figure 5C). To demonstrate TAR-seq coupled to barcode enrichment, we overexpressed 40 barcoded genes in hiPSC performed TAR-seq, which showed effective capture of the 40 gene panel and associated barcodes (Figure 5D). We demonstrate that our vectors can be effectively integrated into hiPSCs and read out for coupled barcode enrichment and transcriptomic characterization via targeted RNA-seq, RNA-seq, or gDNA Barcode-seq, thus completing the STAMPScreen integrated workflow.
Discussion
In this study, we present STAMPScreen, a sequencing-based target ascertainment and modular perturbation screening method for enabling cellular engineering. Our proposed workflow consists of four main parts: target identification, perturbation tool selection, library cloning, and cell screening. We showcase two unique computational approaches for identifying candidate genes for a specific phenotypic conversion starting with transcriptomic data of the initial and target cells. Next, we present data systematically comparing different genetic perturbation methods and develop vectors for genetic screening. We then introduce a powerful method for large-scale recombination-based cloning for library creation. Last, we highlight screening optimization considerations and NGS-based high-throughput readout tools for performing library screens in human cells.
STAMPScreen provides an integrated workflow for cell state engineering, which can be used for a multitude of biological applications. We envision that the tools and methods presented in this article will enable researchers to perform a varied array of large-scale screens for target overexpression (using cDNA or CRISPRa), knockdown (using CRISPRi), or dual overexpression and knockdown (using cDNA and CRISPRi). The modularity of these systems will enable pathway and GRN studies, differentiation factor screening, drug and complex pathway characterizations, and mutation modeling. Therefore, we envision that STAMPScreen will serve as an efficient and high-throughput workflow for the study and engineering of cellular phenotypes.
Limitations of the study
We present STAMPScreen as a widely applicable method that can be utilized in its entirety or in sections, based on the user’s needs. While the method is broadly applicable, there are still limitations that will require further research. Currently, the computational target identification methods solely utilize RNA-seq data, which can be limiting when epigenome datasets are available to help better define the underlying genetic regulation architecture. However, we believe that our methods can be easily adapted and integrated into additional pipelines for utilization of these novel data types. In addition, our CRISPR-based experiments only compare three common CRISPRa tools and two common CRISPRi tools, thus more research on novel enzymes or gene perturbation platforms is needed. Furthermore, we believe MegaGate will be a widely utilized tool for cDNA cloning, with near universal applicability to ORF cloning. Except in extremely rare instances of an ORF containing one of the described meganuclease sites, MegaGate can be utilized without customization. However, this method of cloning is easily customized and can be modified to fit nearly any ORF constraint. Finally, we demonstrate that gene barcodes can be captured alongside transcripts using TAR-seq and RNA-seq. For lower read depth methods, such as scRNA-seq, barcodes can be difficult to capture effectively. In these instances, it will be necessary to further PCR-enrich the barcodes separately to best capture the genes in each cell. Users may also need to optimize these conditions for their specific experimental design.
STAR★Methods
Key resources table
| REAGENT or RESOURCE | SOURCE | IDENTIFIER |
|---|---|---|
| Bacterial and virus strains | ||
| NEB 5-Alpha | New England Biolabs | C2987 |
| Chemicals, peptides, and recombinant proteins | ||
| LR Clonase II | Thermo Fisher | 11791020 |
| BP Clonase II | Thermo Fisher | 11789020 |
| I-SceI (5U/ ul) | New England Biolabs | R0694 |
| I-CeuI (5U/ ul) | New England Biolabs | R0699 |
| 10X CutSmart Buffer | New England Biolabs | B7204 |
| T5 Exonuclease | New England Biolabs | M0663 |
| Gibson Assembly Master Mix | New England Biolabs | E2611 |
| BsaI-HFV2 | New England Biolabs | R3733 |
| BsmBI-V2 | New England Biolabs | R0739 |
| SapI | New England Biolabs | R0569 |
| ProNex Size-Selective Purification System | Promega | NG2001 |
| Critical commercial assays | ||
| KAPA SYBR Fast universal 2X qPCR Master Mix | KAPA Biosystems | KK4601 |
| Powerup SYBR Green Master Mix | Applied Biosystems | A25741 |
| RNAeasy Plus Mini Kit | Qiagen | 74034 |
| DNAeasy blood and tissue lysis kit | Qiagen | 69504 |
| SuperScript IV First Strand Synthesis Kit | Invitrogen | 18091050 |
| KAPA RNA HyperPrep kit with Riboerase | KAPA Biosystems | KR1351 |
| Qubit dsDNA HS Assay Kit | Invitrogen | Q32851 |
| Q5 High Fidelity 2X Mastermix | New England Biolabs | M0492 |
| Qiagen Plasmid Plus Midi Kit | Qiagen | 12941 |
| QIAprep Spin Miniprep Kit | Qiagen | 27104 |
| LunaScript RT SuperMix Kit | New England Biolabs | E3010 |
| KAPA Unique Dual-Indexed Adapter Kit | KAPA Biosystems | KK8727 |
| Monarch DNA Gel Extraction Kit | New England Biolabs | T1020 |
| Deposited data | ||
| Raw MegaGate pooled cloning NGS data | This Paper | PRJNA753802 |
| Raw data from BAR-Seq and TAR-Seq NGS | This Paper | PRJNA753802 |
| Raw data from barcoded ZGLP1 and GFP RNA-Seq | This Paper | GSE182088 |
| Analyzed data for DEG network Aging genes benchmarking | Fleischer et al. (2018) | GSE113957 |
| Analyzed data for GRN network Neural stem cell bench marking | Burke et al. (2020) | PRJNA596331 |
| Analyzed data for GRN network Myoblasts bench marking | Choi et al. (2020) | GSE129505 |
| Analyzed data for GRN network Melanocyte bench marking | Reemann et al. (2017) | PRJNA492994 |
| Experimental models: cell lines | ||
| PGP1 hiPSC | Personal Genome Project | PGP1 hiPSCs |
| F3 hiPSC | ATCC | BXS0116 |
| M1 HDFn | ATCC | PCS-201-010 |
| M2 HDFa | ATCC | PCS-201-012 |
| Oligonucleotides | ||
| Copy Number Assessment Primers (Figure 4A) | This Paper-Table S1 | N/A |
| qPCR Primers for CRISPRa/I assessment, BAR-Seq and TAR-Seq (Figures 2A–2C, 4B, and 4D) | This Paper-Table S1 | N/A |
| ORF-BC_Rev: TCTTATCATGTCTGGATCGCGG (For identifying gene-barcode pairs in Figure 3) | This Paper-Table S1 | N/A |
| Custom Illumina I5 index primers (i501-i508) (For NGS indexing in Figures 3 and 4) | This Paper-Table S1 | N/A |
| Custom Illumina I7 index primers (i701-i708) (For NGS indexing in Figure 3 and 4) | This Paper-Table S1 | N/A |
| Recombinant DNA | ||
| MegaDestination : PB-cT3G-ERP2-MegaGate | This Paper | Addgene Deposit 80028 |
| MegaDestination : PB-cT3G-cERP2-MegaGate | This Paper | Addgene Deposit 80028 |
| MegaDestination : PB-cT3G-cERP2-MegaGate-hU6 | This Paper | Addgene Deposit 80028 |
| MegaDestination : PB-cT3G-cERP2-MegaGate-IRES2-mTagBFP2 | This Paper | Addgene Deposit 80028 |
| MegaDestination : PB-cT3G-cERP2-MegaGate-IRES2-mCherry | This Paper | Addgene Deposit 80028 |
| MegaDestination : PB-cT3G-cERP2-MegaGate-IRES2-mNeonGreen | This Paper | Addgene Deposit 80028 |
| MegaDestination : EF1a- MegaGate | This Paper | Addgene Deposit 80028 |
| MegaDestination : EF1a- MegaGate-hU6 | This Paper | Addgene Deposit 80028 |
| dCas9-KRAB | Yeo et al. (2018) | Addgene 110820 |
| dCas9-KRAB-MeCP2 | Yeo et al. (2018) | Addgene 110821 |
| SP-dCas9-VPR | Chavez et al. (2015) | Addgene 63798 |
| PB-SAM | Li et al. (2017) | Addgene 102559 |
| dCas9-SunTag (2 vector system) | Tanenbaum et al. (2014) | Addgene 60903 and 60904 |
| PB-CA | Woltjen et al. (2009) | Addgene 20960 |
| PB-TA-ERP2 | Kim et al. (2016) | Addgene 80477 |
| XLone-GFP | Randolph et al. (2017) | Addgene 96930 |
| MegaCassette (Sequence is found and annotated in MegaDestination vectors. Contains AttR1, I-SceI, I-CeuI, AttR2): ACAAGTTTGTACAAAAAAGCTGAACGAGAAACGTAAAATGATA TAAATATCAATATATTAAATTAGATTTTGCATAAAAAACAGAC TACATAATACTGTAAAACACAACATATCCAGTCACTATGGC GACAGAAGAAGTATAGGGATAACAGGGTAATTGTTGTAAG CGCGCTATGATGGAGGCTATGCCACTAGAATCTGCGTTCGC TACCTTAGGACCGTTATAGTTAGAAGGAAAGCTCCATCATAG TGACTGGATATGTTGTGTTTTACAGTATTATGTAGTCTGTT TTTTATGCAAAATCTAATTTAATATATTGATATTTATATCATT TTACGTTTCTCGTTCAGCTTTCTTGTACAAAGTGGT |
This Paper | N/A |
| Software and algorithms | ||
| STAMPScreen Target Ascertainment algorithms | This paper | https://10.5281/zenodo.5223748 |
| Geneious Prime 2019.2.3 | Biomatters Ltd. | N/A |
| DESeq2 v1.32.0 | Love et al. (2014) | N/A |
| GraphPad Prism v8.3.1 for MacOS | Graph Pad software | N/A |
| STAR v2.5 | Dobin et al. (2013) | N/A |
| BBMap v38.90 | Bushnell et al. (2017) | N/A |
| FlowJo v10.8 | Becton Dickinson & Company | N/A |
| samtools v1.3.1 | Li et al. (2017) | N/A |
| Bowtie2 v2.1.0 | Langmead and Salzberg (2012) | N/A |
| Cutadapt v1.12 | Martin (2011) | N/A |
Resource availability
Lead contact
Further information and requests for resources and reagents should be directed to and will be fulfilled by the lead contact, Pranam Chatterjee, pranam.chatterjee@wyss.harvard.edu.
Materials availability
Plasmids generated in this study have been deposited to Addgene. (Addgene Catalog numbers will be provided upon Addgene QC clearance).
Experimental model and subject details
Cell lines utilized in this study
PGP1 hiPSC line
-
•
PGP1 were obtained from the Personal Genome Project. This cell line is male and reprogrammed from primary fibroblasts using Sendai virus-based reprogramming.
-
•
PGP1 cells were utilized between passages 27 to 46 for all experiments.
-
•
Cells were grown at 37 C at 5 CO2 and standard oxygen.
-
•
Cells were maintained on Corning hESC qualified Matrigel, feeder-free. Cells were cultured in Stem Cell Technologies mTeSR Plus.
-
•
Cells were passaged every 3-4 days using Accutase and cultured for 24 hours post-seeding in the presence of Y-27632.
F3 hiPSC line (ATCC BXS0116)
-
•
F3 hiPSCs were obtained from ATCC, catalog: ATCC BXS0116. This cell line is female and reprogrammed from LCLs using Sendai virus-based reprogramming.
-
•
F3 cells were utilized between passages 42 to 56 for all experiments.
-
•
Cells were grown at 37 C at 5 CO2 and standard oxygen.
-
•
Cells were maintained on Corning hESC qualified Matrigel, feeder-free. Cells were cultured in Stem Cell Technologies mTeSR Plus.
-
•
Cells were passaged every 3-4 days using Accutase and cultured for 24 hours post-seeding in the presence of Y-27632.
M1 - HDFn M1 line (PCS-201-010)
-
•
M1 line was obtained from ATCC Institute, catalog: PCS-201-010. This primary cell line is male and generated from neonatal foreskin.
-
•
M1 cells were utilized between passages 10 to 20 for all experiments.
-
•
Cells were grown at 37 C under hypoxic conditions with 5 CO2 and 5 O2
-
•
Cells were maintained in low-glucose DMEM with 15 FBS and 1 pen-strep
-
•
Cells were passaged every 3-4 days using TryplE-express
M2 – HDFa line (PCS-201-012)
-
•
M2 line was obtained from ATCC Institute, catalog: PCS-201-012. This primary cell line is male and generated from adult skin biopsy.
-
•
M2 cells were utilized between passages 10 to 20 for all experiments.
-
•
Cells were grown at 37 C under hypoxic conditions with 5 CO2 and 5 O2
-
•
Cells were maintained in low-glucose DMEM with 15 FBS and 1 pen-strep
-
•
Cells were passaged every 3-4 days using TryplE-express
For the PGP1 and F3 hiPSC lines, STR analysis was performed for cell line authentication using bioSYNTHESIS to generate STR profiles for both cell lines to ensure authenticity. In addition, all cell lines were regularly tested for mycoplasma contamination.
Method details
DEG network target prediction
The network scoring method was adapted from the Mogrify algorithm (Rackham et al., 2016) with modifications for application to complex phenotypes like aging. RNA-seq datasets were obtained from the Gene Expression Omnibus (GEO) database, aligned to the hg38 build using STAR aligner (Dobin et al., 2013), and the raw counts were generated using featureCounts (Liao et al., 2013). DGEA was performed using DESeq2 (Love et al., 2014), and the resulting log-transformed fold change, p value, as well as the Pearson correlation of the gene expression with the sample age were combined into a DEGscore. Lastly, to generate a ranked list of candidate genes, we calculated a network score by performing a weighted sum of gene scores over a local gene network constructed from STRING, centered on the query gene. The enrichment analysis was performed by performing a hypergeometric test using the top 100 candidates from each ranked list and the GenAge database of experimentally-validated aging genes (Tacutu et al., 2017). The full code and corresponding Juptyer notebooks can be found at: https://github.com/pranam16/STAMPScreen/
GRN inference and PageRank target identification
RNA-seq datasets were obtained from the Gene Expression Omnibus (GEO) database, and log2fc values for each aligned gene for each sample were calculated using the DESeq2 package (Love et al., 2014). Gene regulatory networks were inferred utilizing the GRNBoost2 algorithm in the Arboreto computational framework (Moerman et al., 2018). PageRank was calculated for each transcription factor in the resulting network via the NetworkX package (NetworkX Developer Team, 2014), and ranked factors were visualized using Seaborn. The full code and corresponding Juptyer notebooks can be found at: https://github.com/pranam16/STAMPScreen/
sgRNA prediction for CRISPRa and CRISPRi
In order to develop highly predictive CRISPRa and CRISPRi tools deep learning models for sgRNA selection, three separate deep learning-based architectures were trained for each task: a model with only fully connected layers (a fully connected neural network - FCNN), a model with convolutional layers (a convolutional neural network - CNN), and one with recurrent long-short term memory layers (an LSTM model). The suite of neural networks was implemented using Keras, a minimalist, highly modular neural networks library, written in Python (https://keras.io). The Theano library was used as its backend and a Titan GPU was utilized for fast neural network training. The pandas library (Reback et al., 2021) was utilized to first load and preprocess sgRNA sequences, which were each encoded as a vector of 20 one-hot vectors: A(1,0,0,0), C(0,1,0,0), G(0,0,1,0), and T(0,0,0,1). Hyperas (https://github.com/maxpumperla/hyperas) was utilized to optimize the hyperparameters of each model architecture, and mean squared error was used to select the best model. For the CRISPRa model, activity score dataset of 2898 sgRNAs from 9 CRISPRa screens were collected (Horlbeck et al., 2016). A two-layered fully connected layer, with the number of units in the first layer equivalent to the number of sequences in the training set and 810 units in the second layer, followed by a final output layer, proved to have the lowest loss value of all architecture combinations tested. To train an independent CRISPRi model, data from 30 CRISPRi screens consisting of activity scores for 18,380 sgRNAs was obtained (Horlbeck et al., 2016). A CNN with a single convolutional layer, filter size of 4, employing l2 regularization, dropout, and a sigmoid activation function, demonstrated the most optimal performance for the held out test set. To predict highly-active sgRNAs using our models for a given transcription factor gene, the hsEPDnew database for the corresponding promoter sequence was queried (Dreos et al., 2016). Potential sgRNA sequences, possessing a 5′–NGG–3′ PAM within −550 and −25 bp (for CRISPRa) and −25 and 500 bp (for CRISPRi) upstream of the TSS, were used as inputs into the optimized activity models for ranking and downstream experimental testing.
CRISPR tool evaluation in hiPSCs
The PGP1 cell line was utilized for all CRISPRa comparisons. dCas9-VPR, dCas9-SAM, and dCas9-SunTag were procured from Addgene (Addgene 63,798, 102,559, 60,903 and 60,904) as gifts from the original labs in which they were generated. sgRNAs were cloned into a common hU6 promoter plasmid. sgRNAs for use with SAM were cloned into a modified sgRNA plasmid that contained the SAM-specific guide RNA scaffold. Experimental methods for assessing CRISPRa performance were as follows:
-
•
Briefly 2 x 10⁵ cells hiPSCs were harvested for transfection using the Lonza 4D Nucleofector on setting CM 113 with P3 reagent.
-
•
100 fmol of each CRISPRa plasmid were combined with 800 fmol of sgRNA plasmid and transfected in duplicate.
-
•
RNA was harvested from the cells at 48 hr post-transfection using the Qiagen RNAeasy kit.
-
•
cDNA synthesis was then performed using the First Strand Synthesis IV kit.
-
•
RT-qPCR was then performed on the duplicate control cells which had only the CRISPRa plasmid transfected and not a sgRNA versus the duplicate wells with a CRISPRa tool and sgRNA targeting one of 47 targets.
-
•
Cq values for the target gene and the housekeeping gene GAPDH were obtained in triplicate and averaged and fold change was calculated using the ΔΔCq method.
Two sgRNAs were first tested for each of the 47 genes in combination with dCas9-VPR and 16 low performing genes were additionally tested with a third sgRNA in all three CRISPRa tools. The best performing sgRNA was then chosen and subsequently used for testing with all three CRISPRa tools. Nucleofections, RNA harvesting, cDNA synthesis and qPCR were performed for all targets for each of the three CRISPRa tools at the same time to minimize batch effects.
Similarly, PGP1 cells were utilized for all CRISPRi comparisons. dCas9-KRAB and dCas9-KRAB-MeCP2 were obtained from Addgene (Plasmids 110,820 and 110,821) as gifts from the original labs in which they were generated. Screening of the CRISPRi tools was performed in the same manner as the CRISPRa comparison, detailed above, with the only change being that RNA was harvested from cells at 72 hr post-transfection, based on the methods of previous studies. A single sgRNA for each of the 12 targets was utilized for comparing the two tools.
cDNA vector comparison
17 genes targeted in the CRISPRa screen were cloned into a PB-CA vector (Addgene, 20,960) using Gateway cloning. Screening was performed in PGP1 hiPSCs and compared to previously generated CRISPRa data. To perform the cDNA expression comparison to CRISPRa a similar procedure to what is detailed above was performed.
-
•
Briefly, 2 μg of either cDNA vector was nucleofected in duplicate.
-
•
RNA was harvested at 48 hr post nucleofection.
-
•
RT-qPCR was utilized to determine differences in expression of target genes relative to a duplicate control (pMAX-GFP transfection).
For the 5 vector comparison, the following procedure was performed:
-
•
1 μg of each cDNA vector harboring a sfGFP construct was nucleofected into hiPSCs or HDFs in duplicate.
-
•
Cells were seeded into 1 μg/mL dox media or in no doxycycline media.
-
•
Flow cytometry was performed at 24 hr post-nucleofection and expression was compared to no plasmid control cells.
-
•
Data analysis was performed in FlowJo and mean fluorescent intensity of GFP was graphed using ggplot2.
Dual cDNA and CRISPR screening
A superfolder GFP (sfGFP) construct was cloned into the PB-cT3G-MG-cERP2-hU6 plasmid using MegaGate cloning and a sgRNA targeting a DDX4-tdTomato reporter was inserted using Golden Gate cloning for dual cDNA-CRISPRa testing. A mCherry cDNA was cloned into PB-EF1α-MG-U6 and a sgRNA targeting the Tet promoter (sgTET) was cloned into the EF1a vector for dual cDNA-CRISPRi testing. Dual cDNA-CRISPRa screening was performed as follows:
-
•
A F3 hiPSC line harboring a DDX4-TdTomato reporter was utilized.
-
•
2 x 10⁵/well hiPSCs were harvested and transfected as previously described.
-
•
1 μg of the PB-cT3G-GFP-hU6-sgDDX4 and 1 μg of PB-cT3G-dCas9-VPR were transfected for the cDNA-CRISPRa test.
-
•
1000 ng/mL of doxycycline was added to the media each day for 48 hr for cDNA-CRISPRa testing.
-
•
Cells for cDNA-CRISPRa were harvested at 48 hr post-transfection for flow cytometry on the CytoFlex LX for sfGFP and tdTomato expression.
-
•
Fold induction was determined by division of the Mean Fluorescent Intensity in the experimental samples versus an uninduced sample and a no plasmid control sample.
Dual cDNA-CRISPRi screening was performed as follows:
-
•
A F3 hiPSC line harboring a stably integrated PB-EF1α-dCas9-KRAB-MeCP2 and a Tet-sfGFP was used for screening
-
•
1 μg of PB-EF1α-mCherry-sgTET was transfected into an hiPSC line.
-
•
For cDNA-CRISPRi, cells were induced in 1000 ng/mL doxycycline for 108 hr.
-
•
For cDNA-CRISPRi, RNA was harvested at 108 hr post-induction.
-
•
Flow cytometry was performed on the CytoFlex LX for sfGFP and mCherry expression.
-
•
Fold induction of mCherry was determined by division of the Mean Fluorescent Intensity in the experimental samples versus an uninduced sample and fold suppression of sfGFP was determined by division of the Mean Fluorescent Intensity in the experimental samples versus an a dox induced sample with no plasmid.
MegaGate molecular cloning vector construction
A common MegaGate backbone plasmid was created for doxycycline induction based on the XLone-GFP plasmid (Addgene 96,930), a gift from the original lab in which it was generated. Modifications to this plasmid include switching blasticidin selection for puromycin, the addition of a CMV enhancer driving the EF1α promoter, replacing the minimal RNA Poll II Tet promoter with a minimal CMV promoter, replacing GFP with a megagate cassette, and an addition of a DNA barcode region all using Gibson Assembly. This core vector is termed PB-cT3G-MG-cERP2. Additionally an hU6 promoter and sgRNA scaffold were added to the PB-cT3G-MG-cERP2 plasmid to create the plasmid PB-cT3G-MG-cEPR2-hU6. Additionally, an EF1α MegaGate vector was created by modification of Addgene 104,543. BsaI and SapI recognition sites were removed and the Tet-On-3G was replaced with a Megagate cassette, in addition a DNA barcode region was added to make the plasmid we term PB-EF1α-MG. An hU6 promoter and sgRNA scaffold were added to the PB-EF1α-MG plasmid to make the plasmid PB-EF1α-MG-hU6. sfGFP versions of all plasmids were tested in hiPSCs and primary human fibroblasts to ensure proper function. The Megagate cassette in each vector is created by synthesis of a DNA construct containing an attR1 sequence, 15 bp of intervening sequence, an I-SceI recognition site, 45 bp of intervening sequence, an I-CeuI recognition site, 15 bp of intervening sequence and an attR2 sequence. Additional MegaGate cassettes were tested that contained other enzyme recognition sites such as BsaI, as well as multiple meganuclease restriction sites.
MegaGate reaction conditions optimization
All MegaGate reaction optimization conditions were performed on the above listed plasmids. The pENTR insert used in the optimization reactions was a pENTR-sfGFP. For negative control reactions (no insert) the pENTR was replaced with water. The 99.8% efficient MegaGate reaction is performed as follows:
For MegaGate LR reaction assemble on ice:
-
•
24 fmol or 50 ng of pENTR insert
-
•
16 fmol or 75ng of MegaDestination vector
-
•
1 μL of the Gateway LR Clonase II Enzyme mix (Invitrogen 11,791,020)
-
•
1 μL (5U) of the MegaNuclease I-SceI (NEB R0694)
-
•
1 μL (5U) of the MegaNuclease I-CeuI (NEB #R0699)
-
•
5 μL of 10X CutSmart Buffer (NEB B7204).
-
•
Nuclease free water was then utilized to bring the reaction to the desired volume of 50 μL.
For MegaGate BP reaction assemble on ice:
-
•
16 fmol or 10 ng of AttB flanked PCR insert
-
•
16 fmol or 75ng of MegaDONOR221 vector
-
•
2 μL of the Gateway BP Clonase II Enzyme Mix (Invitrogen 11,789,100)
-
•
1 μL (5U) of the MegaNuclease I-SceI (NEB R0694)
-
•
1 μL (5U) of the MegaNuclease I-CeuI (NEB R0699)
-
•
5 μL of 10X CutSmart Buffer (NEB B7204).
-
•
Nuclease free water was then utilized to bring the reaction to the desired volume of 50 μL.
For both the MegaGate LR and MegaGate BP reactions, place MegaGate reaction into thermocycler with the following settings:
-
•
1 hr at 25°C
-
•
1 hr at 37°C
-
•
20 min at 65°C.
2 μL of MegaGate reaction was then transformed into 10 μL of NEB 5-alpha cells and colonies were picked and counted the following day for sequencing.
In practice, pENTR amounts as low as 10ng and as high as 150ng yielded successful MegaGate LR products. Similarly, PCR inserts as low as 2ng and as high as 150 ng yielded successful MegaGate BP products. Additional meganuclease was found to lead to negligible increase in efficiency, but decreased meganuclease resulted in lower efficiency. Additionally, lower reaction volumes of 20 μL were found to likewise decrease reaction efficiency. Splitting the reaction into two separate steps, one with only Gateway components incubated at 25°C for 1 hr then adding MegaNucleases and CutSmart and incubating at 37°C for 1 hr and 20 min at 65°C was was shown to slightly increase colony number with the same cloning efficiency. However, for ease of use, we found the all-in-one reaction to be simpler and sufficient for all cloning reactions. Additionally, isothermal reactions at 25°C and 37°C, single meganuclease reactions cutting for 1, 2, and 3 hr and scaled down 25 μL were tested and show varying albeit lower efficiencies. Multiple MegaGate destination vectors and different inserts of varying length were additionally tested to demonstrate that the reaction is efficient across ORF sizes and destination vectors, and that the colony number scales linearly down with increase in ORF size. Reaction efficiency was measured as the total number of positive plate colonies minus the number of colonies on no-insert plates divided by the total number of positive plate colonies. Sanger sequencing was performed on 100 colonies per plate to validate reaction efficiency.
MegaGate vector DNA barcoding
For DNA barcoding, a 40,000 + member 20 bp barcode library was used as a PCR template. Primers were utilized that added Golden Gate enzyme compatibility with the DNA barcode region of the MegaGate destination vectors. A Golden Gate reaction was then performed between the UMI PCR products and the MegaGate destination vectors. The resulting plasmids were then transformed in mass onto multiple selection plates. Colonies were then scrapped and midiprepped to obtain the barcoded MegaGate Destination pool. The resulting barcode distribution in the MegaGate pool was analyzed via NGS using the Illumina MiSeq platform. Briefly, barcoded destination plasmids were used as PCR templates and primers amplified the barcode region and added Illumina adaptors. Resulting reads were then aligned and barcodes identified using the Geneious alignment software package.
Single and pooled MegaGate cloning and NGS readout
For single gene MegaGate cloning, 50 ng of pENTR plasmid was utilized in all 185 MegaGate cloning reactions along with 75 ng of barcoded MegaGate destination vectors. Colonies were subsequently picked and Sanger sequencing was used to link a specific DNA barcode with the inserted ORF.
For pooled MegaGate cloning, 300 ORFs were selected from the ORFeome and pooled for transformation. Transformants were then scraped and midiprepped to yield a pENTR pool. 50 ng of the pENTR pool was then utilized for the MegaGate reaction along with 75 ng of barcode MegaGate destination vector. Transformants were then scraped and midiprepped the following day to yield the barcoded ORF pool in the expression vector. To determine the resulting cloning efficiency and to assign barcodes to the ORFs, primers were utilized that bound upstream of the ORF and downstream of the ORF in the pENTR vector. Additional primers were used that bound a constant region upstream of the inserted gene in the expression vector and the 3′ end of the DNA barcode and Illumina adaptors were added. The pENTR and expression plasmid amplicons were then run on an Illumina MiSeq micro kit. STAR aligner was then utilized to identify ORFs in the pENTR and expression plasmid pools to determine the percentage of ORFs in the pENTR library that were converted into the expression vector. Biopython's fastQ parser was then utilized to identify barcodes to match to the corresponding ORF in the expression pool (https://github.com/biopython/biopython). Cloning efficiency is calculated as the TPM normalized abundance of the ORF in the expression pool divided by the TPM normalized abundance of the ORF in the donor pool, calculated from the NGS counts.
PiggyBac copy number titration
For targeted copy number integration in hiPSCs and NHDFs, we developed a high throughput RT-qPCR readout for average copy number in a given cell pool. Utilizing qPCR primers amplifying a constant region on the integrated transposon (Table S1) in reference to the RNASEP gene (RPP30) (Table S1) which is known to have two autosomal copies per human genome, copy number was assessed in human cells. To determine piggyBAC-based integration dynamics the following procedure was performed:
-
•
A super PiggyBac transposase vector vector driven by a CMV promoter (CMV-SPB) was nucleofected at 100 ng per reaction (24 fmol) using the Lonza 4D Nucleofector into F3 hiPSCs on setting CM 113 in P3 solution and HDFs on setting DS 150 in P2 solution.
-
•
A sfGFP vector (PB-cT3G-sfGFP-cERP2) was serially titrated from 400 fmol to 1.2 fmol and co-nucleofected with CMV-SPB.
-
•
Cells were then drug-selected for 13 days on puromycin (400 ng/mL in hiPSCs and 500 ng/mL in NHDFs) using a 3 day ON and 3 day OFF drug selection regimen to ensure pool purity and loss of any unintegrated plasmid.
-
•
RT-qPCR using SYBR Green master mix was then performed after gDNA extraction using the DNAeasy kit.
-
•
10 ng of input gDNA was used per reaction based on the standard curve, with an anneal temperature of 60°.
-
•
To calculate copy number, the 2ΔCq+1 method was used, with RNASEP as a reference.
-
•
The resultant value was multiplied by two to account for the two autosomal copies of RPP30.
gDNA barcode enrichment analysis (Bar-Seq)
BAR-Seq was performed using the F3 hiPSC line and an equimolar pooled plasmid library of 40 TFs with three unique barcodes each and a GFP vector with 9 unique barcodes (129 unique total plasmids) as follows:
-
•
The TF library was co-nucleofected at 4fmol with the super PiggyBac transposase vector at 24 fmol using the Lonza 4D Nucleofector into F3 hiPSCs on setting CM 113 in P3 solution
-
•
Copy number was estimated to average 5 copies per cell using the methods described above.
-
•
The drug selected pure population was then induced with doxycycline at 500 ng/mL for two days and an uninduced sample was used as control.
-
•
The cells were then sorted using a Sony cell sorter (SH800S) based on GFP expression.
-
•
The FACS positive and negative pools were then gDNA extracted using the DNAeasy kit.
-
•
5 ng of input gDNA was then used to amplify the integrated barcodes using two rounds of PCR. The first round added illumina R1 and R2 adaptors using primers 1.25 μL of 10 μM BC-NGS-Fwd and BC-NGS-Rev primers. Cycling was done in a qPCR machine using KAPA SYBR mix and samples were removed when they reached their Cq to prevent over amplification.
-
•
The cycling conditions were as follows: 95°C-3′, Cq-determined x[98°C-10”; 58°C-20”; 72°C-30”].The samples were then bead purified using Promega Size-Selective beads at 1.75X for a 185 bp product and eluted in 20 μL.
-
•
1ul of PCR1 input was then used for a second round of PCR amplification with 2X Q5 master mix and 1.25 μL of 10 μM Illumina index primers.
-
•
Cycling was done with the following conditions: 98°C-30″, 8x[98°C-5”; 61°C-20”; 72°C-5”], 72°C-2′ and the 255bp product was again bead purified using 1.3X chemistry.
-
•
The indexed samples were then run on NGS using an Illumina MiSeq machine at 20 pM with 10% PhiX spike in.
-
•
The counts of each barcode were then generated using Geneious RNA-Aligner against a reference list of barcodes and normalized by the total counts in the sample to measure relative abundance.
-
•
Data was then plotted using the Prism software.
Targeted RNA-Seq (TAR-Seq)
TAR-Seq was performed using the F3 hiPSC line and an equimolar pooled plasmid library of 40 TFs with three unique barcodes each and a GFP vector with 9 unique barcodes (129 unique total plasmids) as follows:
-
•
RNA was extracted from doxycycline induced and uninduced pools from the same experiment as the above detailed Bar-Seq.
-
•
For each sample, cDNA was generated from 1 μg total RNA using the NEB Luna RT SuperMix kit with random hexamers.
-
•
The targets of interest were amplified in a 25 μL reaction using the NEB 2x Q5 mastermix with 2 μL 1:10 diluted cDNA, 0.1 μM final concentration for each primer pair (Table S1),
-
•
the following cycling conditions were used: 98°C-5′, 26x[98°C-1’; 60°C-30”; 68°C-15”], 72°C-3’.
-
•
The PCR product was gel purified, prepared for NGS using the same workflow as previously detailed in BAR-Seq, and sequenced on a MiSeq machine at 20 pM with with a 10% PhiX spike in.
-
•
Counts were then generated in Geneious using RNA-Aligner against a reference list of full length CDS sequences and barcodes.
-
•
Counts were then normalized per sample and further normalized to GAPDH in the sample for TAR-Seq analysis to calculate relative expression.
For the TARSeq validation experiments, the total cell RNA from four different primary NHDF lines was converted to cDNA using the Thermo SuperScript IV First Strand Synthesis system with random hexamers. The TAR-Seq protocol was then performed as described above.
RNA-seq and coupled barcode enrichment
The F3 hiPSC line was utilized for the RNA-Seq and barcode capture experiment as follows:
-
•
Cells were nucleofected as described above with 100fmol of a barcoded cDNA vector harboring sfGFP or the gene ZGLP1 and 24 fmol of super piggyBac transposase in duplicate.
-
•
Integrants were purified through puromycin drug selection as detailed above
-
•
The cells were then induced under 1 μg/mL doxycycline for 3 days and RNA was harvested using the Qiagen RNAeasy plus kit.
-
•
RIN scores were determined using a Bioanalyzer and only samples with RIN score greater than 8 were utilized.
-
•
An RNA-Seq cDNA library was constructed using the KAPA Hyper Kit with RiboErase
-
•
RNA-Sequencing was performed on the Next-Seq 500 Illumina platform.
-
•
Reads were processed and aligned to the hg19 build using STAR Aligner
-
•
DEGs were determined using DESeq2.
-
•
Gene barcodes were identified using BBMap.
-
•
DESeq2 results for gene expression log2fc and their matching p values were plotted utilizing the R package ggplot2.
Quantification and statistical analysis
Specific quantification and statistical analysis details for each experiment can be found in the figure legends. Statistical analysis was performed using the software GraphPad. For Figure 1, p values for DEGs are determined by the DESeq2 software package. For Figure 2 perturbation tool comparisons, n = 2 biological replicates were utilized in which the same hiPSC line was independently nucleofected and screened for each condition. Statistical analysis is performed using the Mann Whitney Test with significance determined at p value less than 0.5 threshold. Indicated values are given as median of the population for each perturbation tool. For dual cDNA-CRISPR comparisons, n = 3 biological replicates, where replicates are independently nucleofected hiPSCs. Values are presented as mean with standard deviations of replicates. For Figure 3 MegaGate cloning outcomes, values in Figure 3B are given as the mean with standard deviations of cloning efficiency and barcodes captured for the gene. For single gene cloning n = 185 and for pooled cloning reactions n = 300 where n represents a single cloned gene. For Figure 4 NGS Coupled readouts, copy number was determined in n = 2 biological replicates for hiPSCs and HDFs. Biological replicates are independent hiPSC and HDF lines that are independently nucleofected in duplicate, drug selected and screened. Data is plotted as the mean copy number with standard deviation of the technical replicates across the two biological replicates. For RNA-Seq coupled to barcode enrichment, p value is determined by the DESeq2 software package. For TAR-Seq, significance is determined by Mann Whitney test and significance threshold is set at p value less than 0.5. n = 40, where n represents the expression of a single gene in the sample.
Acknowledgments
This work was funded by the Synthetic Biology Platform at the Wyss Institute for Biologically Inspired Engineering.
Author contributions
C.K. designed experiments, invented and optimized MegaGate cloning, built vectors, designed and conducted CRISPRa/i screening and hiPSCs experiments, developed copy number assay, and conducted NGS library preparation and data analysis. A.M.P. designed experiments, invented and tested MegaGate cloning, developed the DEG network scoring method, conducted NGS library preparation and data analysis, NHDF culturing, and developed the copy number assay and TAR-seq method. H.H.W. developed the DEG network scoring method and conducted RNA-seq data analysis. B.W. assisted with MegaGate and transcriptome analysis. M.P.S. conducted copy number and FACS analysis. X.G. assisted with CRISPR screening protocols. P.C. conceived, designed, and implemented machine learning and bioinformatics protocols for target identification and sgRNA selection. C.K., A.M.P., and P.C. wrote the paper, with input from all authors. R.E.K. and G.M.C. acquired funding. P.C., R.E.K., and G.M.C. supervised the project.
Declaration of interests
C.K., A.M.P., and G.M.C. are listed as inventors on US Provisional Patent Application 63/148,656: “Compositions and methods for molecular cloning.” Full disclosure for G.M.C. is available at http://arep.med.harvard.edu/gmc/tech.html.
Published: September 27, 2021
Footnotes
Supplemental information can be found online at https://doi.org/10.1016/j.crmeth.2021.100082.
Supplemental information
Data and code availability
All data needed to evaluate the conclusions in the paper are present in the paper and supplementary tables.
-
•
Bulk RNA-Seq data from barcoded cDNA overexpression experiments, NGS data from pooled MegaGate cloning, BAR-Seq, and TAR-Seq have been deposited at GEO and are publicly available as of the date of publication. Accession numbers are listed in the key resources table. Any additional raw data reported in the paper will be made available upon request by the lead contact.
-
•
All original code for computational methods for target identification has been deposited on a Github repository (https://github.com/pranam16/STAMPScreen/) with corresponding Juptyer notebook tutorials and step by step instructions for seamlessly running the code for any given RNA-Seq dataset. DOIs are listed in the key resources table.
-
•
Any additional data or information needed to reproduce or reanalyze the data reported in this paper is available upon request from the lead contact.
References
- Arnoldo A., Kittanakom S., Heisler L.E., Mak A.B., Shukalyuk A.I., Torti D., Moffat J., Giaever G., Nislow C. A genome scale overexpression screen to reveal drug activity in human cells. Genome Med. 2014;6:32. doi: 10.1186/gm549. [DOI] [PMC free article] [PubMed] [Google Scholar]
- Bikard D., Jiang W., Samai P., Hochschild A., Zhang F., Marraffini L.A. Programmable repression and activation of bacterial gene expression using an engineered CRISPR-Cas system. Nucleic Acids Res. 2013;41:7429–7437. doi: 10.1093/nar/gkt520. [DOI] [PMC free article] [PubMed] [Google Scholar]
- Burke E.E., Chenoweth J.G., Shin J.H., Collado-Torres L., Kim S.-K., Micali N., Wang Y., Colantuoni C., Straub R.E., Hoeppner D.J., et al. Dissecting transcriptomic signatures of neuronal differentiation and maturation using iPSCs. Nat. Commun. 2020;11:462. doi: 10.1038/s41467-019-14266-z. [DOI] [PMC free article] [PubMed] [Google Scholar]
- Bushnell B., Rood J., Singer E. BBMerge – Accurate paired shotgun read merging via overlap. PLoS ONE. 2017;12:e0185056. doi: 10.1371/journal.pone.0185056. [DOI] [PMC free article] [PubMed] [Google Scholar]
- Cao J., O’Day D.R., Pliner H.A., Kingsley P.D., Deng M., Daza R.M., Zager M.A., Aldinger K.A., Blecher-Gonen R., Zhang F., et al. A human cell atlas of fetal gene expression. Science. 2020;370:eaba7721. doi: 10.1126/science.aba7721. [DOI] [PMC free article] [PubMed] [Google Scholar]
- Chavez A., Scheiman J., Vora S., Pruitt B.W., Tuttle M., Iyer E.P.R., Lin S., Kiani S., Guzman C.D., Wiegand D.J., et al. Highly efficient Cas9-mediated transcriptional programming. Nat. Methods. 2015;12:326–328. doi: 10.1038/nmeth.3312. [DOI] [PMC free article] [PubMed] [Google Scholar]
- Chavez A., Tuttle M., Pruitt B.W., Ewen-Campen B., Chari R., Ter-Ovanesyan D., Haque S.J., Cecchi R.J., Kowal E.J.K., Buchthal J., et al. Comparison of Cas9 activators in multiple species. Nat. Methods. 2016;13:563–567. doi: 10.1038/nmeth.3871. [DOI] [PMC free article] [PubMed] [Google Scholar]
- Choi I.Y., Lim H., Cho H.J., Oh Y., Chou B.-K., Bai H., Cheng L., Kim Y.J., Hyun S., Kim H., et al. Transcriptional landscape of myogenesis from human pluripotent stem cells reveals a key role of TWIST1 in maintenance of skeletal muscle progenitors. eLife. 2020;9:e46981. doi: 10.7554/eLife.46981. [DOI] [PMC free article] [PubMed] [Google Scholar]
- Dobin A., Davis C.A., Schlesinger F., Drenkow J., Zaleski C., Jha S., Batut P., Chaisson M., Gingeras T.R. STAR: ultrafast universal RNA-seq aligner. Bioinformatics. 2013;29:15–21. doi: 10.1093/bioinformatics/bts635. [DOI] [PMC free article] [PubMed] [Google Scholar]
- Domcke S., Hill A.J., Daza R.M., Cao J., O’Day D.R., Pliner H.A., Aldinger K.A., Pokholok D., Zhang F., Milbank J.H., et al. A human cell atlas of fetal chromatin accessibility. Science. 2020;370:eaba7612. doi: 10.1126/science.aba7612. [DOI] [PMC free article] [PubMed] [Google Scholar]
- Dreos R., Ambrosini G., Groux R., Périer R.C., Bucher P. The eukaryotic promoter database in its 30th year: focus on non-vertebrate organisms. Nucleic Acids Res. 2016;45:D51–D55. doi: 10.1093/nar/gkw1069. [DOI] [PMC free article] [PubMed] [Google Scholar]
- Engler C., Kandzia R., Marillonnet S. A one pot, one step, precision cloning method with high throughput capability. PLoS One. 2008;3:e3647. doi: 10.1371/journal.pone.0003647. [DOI] [PMC free article] [PubMed] [Google Scholar]
- Fleischer J.G., Schulte R., Tsai H.H., Tyagi S., Ibarra A., Shokhirev M.N., Huang L., Hetzer M.W., Navlakha S. Predicting age from the transcriptome of human dermal fibroblasts. Genome Biol. 2018;19:221. doi: 10.1186/s13059-018-1599-6. [DOI] [PMC free article] [PubMed] [Google Scholar]
- Gibson D.G., Young L., Chuang R.-Y., Venter J.C., Hutchison C.A., Smith H.O. Enzymatic assembly of DNA molecules up to several hundred kilobases. Nat. Methods. 2009;6:343–345. doi: 10.1038/nmeth.1318. [DOI] [PubMed] [Google Scholar]
- Gilbert L.A., Larson M.H., Morsut L., Liu Z., Brar G.A., Torres S.E., Stern-Ginossar N., Brandman O., Whitehead E.H., Doudna J.A., et al. CRISPR-mediated modular RNA-guided regulation of transcription in eukaryotes. Cell. 2013;154:442–451. doi: 10.1016/j.cell.2013.06.044. [DOI] [PMC free article] [PubMed] [Google Scholar]
- Hazelbaker D.Z., Beccard A., Angelini G., Mazzucato P., Messana A., Lam D., Eggan K., Barrett L.E. A multiplexed gRNA piggyBac transposon system facilitates efficient induction of CRISPRi and CRISPRa in human pluripotent stem cells. Sci. Rep. 2020;10:635. doi: 10.1038/s41598-020-57500-1. [DOI] [PMC free article] [PubMed] [Google Scholar]
- Horlbeck M.A., Gilbert L.A., Villalta J.E., Adamson B., Pak R.A., Chen Y., Fields A.P., Park C.Y., Corn J.E., Kampmann M., Weissman J.S. Compact and highly active next-generation libraries for CRISPR-mediated gene repression and activation. eLife. 2016;5:e19760. doi: 10.7554/eLife.19760. [DOI] [PMC free article] [PubMed] [Google Scholar]
- Jiang P., Wang H., Li W., Zang C., Li B., Wong Y.J., Meyer C., Liu J.S., Aster J.C., Liu X.S. Network analysis of gene essentiality in functional genomics experiments. Genome Biol. 2015;16:239. doi: 10.1186/s13059-015-0808-9. [DOI] [PMC free article] [PubMed] [Google Scholar]
- Jung S., Appleton E., Ali M., Church G.M., del Sol A. A computer-guided design tool to increase the efficiency of cellular conversions. Nat. Commun. 2021;12:1659. doi: 10.1038/s41467-021-21801-4. [DOI] [PMC free article] [PubMed] [Google Scholar]
- Kamimoto K., Hoffmann C.M., Morris S.A. CellOracle: dissecting cell identity via network inference and in silico gene perturbation. bioRxiv. 2020 doi: 10.1101/2020.02.17.947416. [DOI] [PMC free article] [PubMed] [Google Scholar]
- Kim S.I., Oceguera-Yanez F., Sakurai C., Nakagawa M., Yamanaka S., Woltjen K. Inducible Transgene Expression in Human iPS Cells Using Versatile All-in-One piggyBac Transposons. Methods Mol. Biol. 2016;1357:111–131. doi: 10.1007/7651_2015_251. [DOI] [PubMed] [Google Scholar]
- Kirchmaier S., Lust K., Wittbrodt J. Golden GATEway cloning—a combinatorial approach to generate fusion and recombination constructs. PLoS One. 2013;8:e76117. doi: 10.1371/journal.pone.0076117. [DOI] [PMC free article] [PubMed] [Google Scholar]
- Konermann S., Brigham M.D., Trevino A.E., Joung J., Abudayyeh O.O., Barcena C., Hsu P.D., Habib N., Gootenberg J.S., Nishimasu H., et al. Genome-scale transcriptional activation by an engineered CRISPR-Cas9 complex. Nature. 2014;517:583–588. doi: 10.1038/nature14136. [DOI] [PMC free article] [PubMed] [Google Scholar]
- Langmead B., Salzberg S.L. Fast gapped-read alignment with Bowtie 2. Nat. Methods. 2012;9:357–359. doi: 10.1038/nmeth.1923. [DOI] [PMC free article] [PubMed] [Google Scholar]
- Li S., Zhang A., Xue H., Li D., Liu Y. One-Step piggyBac Transposon-Based CRISPR/Cas9 Activation of Multiple Genes. Mol. Ther. Nucleic Acids. 2017;8:64–76. doi: 10.1016/j.omtn.2017.06.007. [DOI] [PMC free article] [PubMed] [Google Scholar]
- Lian J., HamediRad M., Hu S., Zhao H. Combinatorial metabolic engineering using an orthogonal tri-functional CRISPR system. Nat. Commun. 2017;8:1688. doi: 10.1038/s41467-017-01695-x. [DOI] [PMC free article] [PubMed] [Google Scholar]
- Liao Y., Smyth G.K., Shi W. featureCounts: an efficient general purpose program for assigning sequence reads to genomic features. Bioinformatics. 2013;30:923–930. doi: 10.1093/bioinformatics/btt656. [DOI] [PubMed] [Google Scholar]
- Liu L.-P., Li Y.-M., Guo N.-N., Li S., Ma X., Zhang Y.-X., Gao Y., Huang J.-L., Zheng D.-X., Wang L.-Y., et al. Therapeutic potential of patient iPSC-derived iMelanocytes in autologous transplantation. Cell Rep. 2019;27:455–466.e5. doi: 10.1016/j.celrep.2019.03.046. [DOI] [PubMed] [Google Scholar]
- Love M.I., Huber W., Anders S. Moderated estimation of fold change and dispersion for RNA-seq data with DESeq2. Genome Biol. 2014;15:550. doi: 10.1186/s13059-014-0550-8. [DOI] [PMC free article] [PubMed] [Google Scholar]
- Magnani E., Bartling L., Hake S. From Gateway to MultiSite Gateway in one recombination event. BMC Mol. Biol. 2006;7:46. doi: 10.1186/1471-2199-7-46. [DOI] [PMC free article] [PubMed] [Google Scholar]
- Mardis E.R. A decade’s perspective on DNA sequencing technology. Nature. 2011;470:198–203. doi: 10.1038/nature09796. [DOI] [PubMed] [Google Scholar]
- Martin M. Cutadapt removes adapter sequences from high-throughput sequencing reads. EMBnet.journal. 2011 doi: 10.14806/ej.17.1.200. [DOI] [Google Scholar]
- Martin D.P., Miya J., Reeser J.W., Roychowdhury S. Targeted RNA sequencing assay to characterize gene expression and genomic alterations. J. Vis. Exp. 2016;114:54090. doi: 10.3791/54090. [DOI] [PMC free article] [PubMed] [Google Scholar]
- Moerman T., Santos S.A., González-Blas C.B., Simm J., Moreau Y., Aerts J., Aerts S. GRNBoost2 and Arboreto: efficient and scalable inference of gene regulatory networks. Bioinformatics. 2018;35:2159–2161. doi: 10.1093/bioinformatics/bty916. [DOI] [PubMed] [Google Scholar]
- NetworkX Developer Team . NetworkX; 2014. NetworkX. [Google Scholar]
- Ng A.H.M., Khoshakhlagh P., Arias J.E.R., Pasquini G., Wang K., Swiersy A., Shipman S.L., Appleton E., Kiaee K., Kohman R.E., et al. A comprehensive library of human transcription factors for cell fate engineering. Nat. Biotechnol. 2020;39:510–519. doi: 10.1038/s41587-020-0742-6. [DOI] [PMC free article] [PubMed] [Google Scholar]
- Page L., Brin S., Motwani R., Winograd T. Stanford InfoLab; 1999. The PageRank Citation Ranking: Bringing Order to the Web. [Google Scholar]
- Parekh U., Wu Y., Zhao D., Worlikar A., Shah N., Zhang K., Mali P. Mapping cellular reprogramming via pooled overexpression screens with paired fitness and single-cell RNA-sequencing readout. Cell Syst. 2018;7:548–555.e8. doi: 10.1016/j.cels.2018.10.008. [DOI] [PMC free article] [PubMed] [Google Scholar]
- Qi L.S., Larson M.H., Gilbert L.A., Doudna J.A., Weissman J.S., Arkin A.P., Lim W.A. Repurposing CRISPR as an RNA-guided platform for sequence-specific control of gene expression. Cell. 2013;152:1173–1183. doi: 10.1016/j.cell.2013.02.022. [DOI] [PMC free article] [PubMed] [Google Scholar]
- Rackham O.J.L., Firas J., Fang H., Oates M.E., Holmes M.L., Knaupp A.S., Suzuki H., Nefzger C.M., Daub C.O., Shin J.W., et al. A predictive computational framework for direct reprogramming between human cell types. Nat. Genet. 2016;48:331–335. doi: 10.1038/ng.3487. [DOI] [PubMed] [Google Scholar]
- Randolph L.N., Bao X., Zhou C., Lian X. An all-in-one, Tet-On 3G inducible PiggyBac system for human pluripotent stem cells and derivatives. Sci. Rep. 2017;7:1549. doi: 10.1038/s41598-017-01684-6. [DOI] [PMC free article] [PubMed] [Google Scholar]
- Reback J., McKinney W., Jbrockmendel, van den Bossche J., Augspurger T., Cloud P., Hawkins S., Gfyoung S., Roeschke M., Klein A., et al. Pandas-Dev/pandas: Pandas 1.2.4. Zenodo. 2021 doi: 10.5281/zenodo.4681666. [DOI] [Google Scholar]
- Reemann P., Reimann E., Ilmjärv S., Porosaar O., Silm H., Jaks V., Vasar E., Kingo K., Kõks S. Correction: Melanocytes in the Skin – Comparative Whole Transcriptome Analysis of Main Skin Cell Types. PLoS ONE. 2017;12:e0173792. doi: 10.1371/journal.pone.0173792. [DOI] [PMC free article] [PubMed] [Google Scholar]
- Robinson M.D., McCarthy D.J., Smyth G.K. edgeR: a Bioconductor package for differential expression analysis of digital gene expression data. Bioinformatics. 2009;26:139–140. doi: 10.1093/bioinformatics/btp616. [DOI] [PMC free article] [PubMed] [Google Scholar]
- Rual J.-F. Human ORFeome version 1.1: a platform for reverse proteomics. Genome Res. 2004;14:2128–2135. doi: 10.1101/gr.2973604. [DOI] [PMC free article] [PubMed] [Google Scholar]
- Schlitt T., Brazma A. Current approaches to gene regulatory network modelling. BMC Bioinformatics. 2007;8:S9. doi: 10.1186/1471-2105-8-S6-S9. [DOI] [PMC free article] [PubMed] [Google Scholar]
- Shimojima M., Sugimoto S., Taniguchi S., Yoshikawa T., Kurosu T., Saijo M. Efficient functional screening of a cellular cDNA library to identify severe fever with thrombocytopenia syndrome virus entry factors. Sci. Rep. 2020;10:5996. doi: 10.1038/s41598-020-62876-1. [DOI] [PMC free article] [PubMed] [Google Scholar]
- Smith A.M., Heisler L.E., Mellor J., Kaper F., Thompson M.J., Chee M., Roth F.P., Giaever G., Nislow C. Quantitative phenotyping via deep barcode sequencing. Genome Res. 2009;19:1836–1842. doi: 10.1101/gr.093955.109. [DOI] [PMC free article] [PubMed] [Google Scholar]
- Szklarczyk D., Franceschini A., Wyder S., Forslund K., Heller D., Huerta-Cepas J., Simonovic M., Roth A., Santos A., Tsafou K.P., et al. STRING v10: protein–protein interaction networks, integrated over the tree of life. Nucleic Acids Res. 2014;43:D447–D452. doi: 10.1093/nar/gku1003. [DOI] [PMC free article] [PubMed] [Google Scholar]
- Tacutu R., Thornton D., Johnson E., Budovsky A., Barardo D., Craig T., Diana E., Lehmann G., Toren D., Wang J., et al. Human ageing genomic resources: new and updated databases. Nucleic Acids Res. 2017;46:D1083–D1090. doi: 10.1093/nar/gkx1042. [DOI] [PMC free article] [PubMed] [Google Scholar]
- Tak Y.E., Kleinstiver B.P., Nuñez J.K., Hsu J.Y., Horng J.E., Gong J., Weissman J.S., Joung J.K. Inducible and multiplex gene regulation using CRISPR-Cpf1-based transcription factors. Nat. Methods. 2017;14:1163–1166. doi: 10.1038/nmeth.4483. [DOI] [PMC free article] [PubMed] [Google Scholar]
- Tanenbaum M.E., Gilbert L.A., Qi L.S., Weissman J.S., Vale R.D. A protein-tagging system for signal amplification in gene expression and fluorescence imaging. Cell. 2014;159:635–646. doi: 10.1016/j.cell.2014.09.039. [DOI] [PMC free article] [PubMed] [Google Scholar]
- Vad-Nielsen J., Lin L., Bolund L., Nielsen A.L., Luo Y. Golden Gate Assembly of CRISPR gRNA expression array for simultaneously targeting multiple genes. Cell. Mol. Life Sci. 2016;73:4315–4325. doi: 10.1007/s00018-016-2271-5. [DOI] [PMC free article] [PubMed] [Google Scholar]
- Vargas J.E., Chicaybam L., Stein R.T., Tanuri A., Delgado-Cañedo A., Bonamino M.H. Retroviral vectors and transposons for stable gene therapy: advances, current challenges and perspectives. J. Transl. Med. 2016;14:288. doi: 10.1186/s12967-016-1047-x. [DOI] [PMC free article] [PubMed] [Google Scholar]
- Wei L., Lee D., Law C.-T., Zhang M.S., Shen J., Chin D.W.-C., Zhang A., Tsang F.H.-C., Wong C.L.-S., Ng I.O.-L., et al. Genome-wide CRISPR/Cas9 library screening identified PHGDH as a critical driver for Sorafenib resistance in HCC. Nat. Commun. 2019;10:4681. doi: 10.1038/s41467-019-12606-7. [DOI] [PMC free article] [PubMed] [Google Scholar]
- Woltjen K., Michael I.P., Mohseni P., Desai R., Mileikovsky M., Hämäläinen R., Cowling R., Wang W., Liu P., Gertsenstein M., et al. piggyBac transposition reprograms fibroblasts to induced pluripotent stem cells. Nature. 2009;458:766–770. doi: 10.1038/nature07863. [DOI] [PMC free article] [PubMed] [Google Scholar]
- Yeo N.C., Chavez A., Lance-Byrne A., Chan Y., Menn D., Milanova D., Kuo C.-C., Guo X., Sharma S., Tung A., et al. An enhanced CRISPR repressor for targeted mammalian gene regulation. Nat. Methods. 2018;15:611–616. doi: 10.1038/s41592-018-0048-5. [DOI] [PMC free article] [PubMed] [Google Scholar]
- Yusa K., Zhou L., Li M.A., Bradley A., Craig N.L. A hyperactive piggyBac transposase for mammalian applications. Proc. Natl. Acad. Sci. U S A. 2011;108:1531–1536. doi: 10.1073/pnas.1008322108. [DOI] [PMC free article] [PubMed] [Google Scholar]
- Zalatan J.G., Lee M.E., Almeida R., Gilbert L.A., Whitehead E.H., Russa M.L., Tsai J.C., Weissman J.S., Dueber J.E., Qi L.S., Lim W.A. Engineering complex synthetic transcriptional programs with CRISPR RNA scaffolds. Cell. 2015;160:339–350. doi: 10.1016/j.cell.2014.11.052. [DOI] [PMC free article] [PubMed] [Google Scholar]
- Zhang X., Wang J., Cheng Q., Zheng X., Zhao G., Wang J. Multiplex gene regulation by CRISPR-ddCpf1. Cell Discov. 2017;3:17018. doi: 10.1038/celldisc.2017.18. [DOI] [PMC free article] [PubMed] [Google Scholar]
- Zufferey R., Nagy D., Mandel R.J., Naldini L., Trono D. Multiply attenuated lentiviral vector achieves efficient gene delivery in vivo. Nat. Biotechnol. 1997;15:871–875. doi: 10.1038/nbt0997-871. [DOI] [PubMed] [Google Scholar]
Associated Data
This section collects any data citations, data availability statements, or supplementary materials included in this article.
Supplementary Materials
Data Availability Statement
All data needed to evaluate the conclusions in the paper are present in the paper and supplementary tables.
-
•
Bulk RNA-Seq data from barcoded cDNA overexpression experiments, NGS data from pooled MegaGate cloning, BAR-Seq, and TAR-Seq have been deposited at GEO and are publicly available as of the date of publication. Accession numbers are listed in the key resources table. Any additional raw data reported in the paper will be made available upon request by the lead contact.
-
•
All original code for computational methods for target identification has been deposited on a Github repository (https://github.com/pranam16/STAMPScreen/) with corresponding Juptyer notebook tutorials and step by step instructions for seamlessly running the code for any given RNA-Seq dataset. DOIs are listed in the key resources table.
-
•
Any additional data or information needed to reproduce or reanalyze the data reported in this paper is available upon request from the lead contact.