

Abstract
Objective:
Understanding how different parts of the immune system contribute to pathogenesis in Parkinson’s disease is a burning challenge with important therapeutic implications. We studied enrichment of common variant heritability for Parkinson’s disease stratified by immune and brain cell types.
Methods:
We used summary statistics from the most recent meta-analysis of genomewide association studies in Parkinson’s disease and partitioned heritability using linkage disequilibrium score regression, stratified for specific cell types, as defined by open chromatin regions. We also validated enrichment results using a polygenic risk score approach and intersected disease-associated variants with epigenetic data and expression quantitative loci to nominate and explore a putative microglial locus.
Results:
We found significant enrichment of Parkinson’s disease risk heritability in open chromatin regions of microglia and monocytes. Genomic annotations overlapped substantially between these 2 cell types, and only the enrichment signal for microglia remained significant in a joint model. We present evidence suggesting P2RY12, a key microglial gene and target for the antithrombotic agent clopidogrel, as the likely driver of a significant Parkinson’s disease association signal on chromosome 3.
Interpretation:
Our results provide further support for the importance of immune mechanisms in Parkinson’s disease pathogenesis, highlight microglial dysregulation as a contributing etiological factor, and nominate a targetable microglial gene candidate as a pathogenic player. Immune processes can be modulated by therapy, with potentially important clinical implications for future treatment in Parkinson’s disease.
Understanding how the immune system contributes to pathogenesis is a burning challenge in Parkinson’s disease (PD) and other neurodegenerative disorders, which could have major importance for future therapy. To date, the treatment for PD is merely symptomatic, yet the prospect of immune modulation is one of the most promising disease-modifying strategies. However, immune processes are likely to have both protective and harmful influences in the context of neurodegeneration. Thus, a deeper understanding of the role of different cell types and molecular processes is urgently needed.
Microglia are the primary immune cells of the central nervous system, similar to peripheral macrophages, yet specialized for the immunoprivileged environment inside the blood–brain barrier. Neuropathological and experimental studies have demonstrated microglial activation in PD brains,1 yet it is not clear whether this activation is part of the pathogenic process or a protective response. Furthermore, several lines of evidence have suggested a role for the peripheral immune system,2–7 but the specific significance of different immune mechanisms for pathogenesis, their role in the causal hierarchy of the disease, and the interrelation between microglial and peripheral immune processes remain poorly understood.
Genetic approaches have the great advantage that the direction of causality is generally straightforward to interpret. A signal from the HLA region was among the earliest identified susceptibility loci in genomewide association studies (GWAS) of PD, highlighting a potential causal role of the immune system.8 The latest meta-analysis of PD GWAS identified 90 genomewide significant risk variants, for which the relevant genes and mechanisms remain largely unknown.9 Recently, a number of powerful statistical methods have been developed to infer involvement of biological pathways and cell types in disease pathogenesis based on association data from large GWAS combined with functional annotation of the human genome.10
Previously published analyses of heritability enrichment have unequivocally highlighted immune mechanisms in Alzheimer’s disease (AD),11 implicating monocytes, macrophages, and microglia as likely relevant cell types.12 However, similar analyses in PD have thus far yielded mixed results. Although some studies have reported evidence of heritability being enriched in immune-related regions,3,11 other large-scale analyses have seen significant results for brain or neurons only,13 potentially due to methodological differences. Importantly, no study to date has reported enrichment of heritability linking genetics to microglia in PD.
We used the largest set of summary statistics from PD GWAS to date to investigate heritability enrichment partitioned by cell type, focusing on immune and brain cells. We show significant enrichment of PD heritability in open chromatin regions of microglia, an enrichment that was stronger than that observed for neurons. Significant enrichment was also observed for monocytes, but only the microglial signal remained significant in a joint model including both these related cell types. Combining available GWAS statistics, genomic annotations, and published gene expression data to interpret an individual GWAS locus, we highlight P2RY12 as an example of a suggestive microglial causal gene underlying a PD association signal.
Methods
Genetic Association Data
For stratified linkage disequilibrium score regression (s-LDSC) analyses, we used the full summary statistics from the latest meta-analysis of PD GWAS, which included a total of 37,688 PD patients, 18,618 proxycases and 1,417,791 controls.9 To validate the results from s-LDSC, we also performed polygenic risk score analyses, following the same approach as we applied in a recently published study.14 Similar to this study, we took advantage of genetic data available through the International Parkinson’s Disease Genomics Consortium (IPDGC): summary statistics from an earlier meta-GWAS of 26,035 PD cases and 403,190 controls of European ancestry15 were used as a reference data set to define risk allele weights, and individual genotypes not included in this earlier meta-GWAS were assigned to a training dataset (7,218 patients with PD and 9,424 healthy controls) and a test data set (5,429 PD patients and 5,814 controls).
Tissue and Cell Type Annotations
With an interest to understand the contribution of microglia and peripheral immune cells, we primarily aimed to analyze cell-specific data from brain and immune cells. However, as previous studies have used different methods to define regions of relevance for specific tissues and cell types, we initially contrasted tissue-level approaches based on gene expression versus approaches based on open chromatin regions as assessed by Assay for Transposase-Accessible Chromatin sequencing (ATAC-seq). As an example of an expression-based approach, we mirrored the method followed for data from the Genotype-Tissue Expression (GTEx) project database16 in a previous publication on heritability enrichment of specifically expressed genes.17 In that study, normalized gene expression values were compared across tissues and t-statistics were calculated for specific expression in each focal tissue. Genes were ranked by their t-statistic, and the 10% of genes with the highest t-statistic were defined as the set of specifically expressed genes corresponding to the focal tissue. We downloaded the relevant specifically expressed gene sets as provided by the authors (Alkes lab, see Data Availability) for the immune and central nervous systems, as well as 3 additional systems as negative controls (musculoskeletal, cardiovascular, and gastrointestinal), merging gene sets for 21 different tissues into these 5 tissue categories. We used the online Ensembl tool BioMart to download b37 coordinates for all genes and added 100 kb of flanking sequence, still following the method from Finucane et al.17
To define open chromatin in individual brain cell types, we used ATAC-seq peak data from neurons, oligodendrocytes, astroglia, and microglia generated by Nott et al.18 The union of all these data sets was merged into a common brain ATAC-seq dataset. Similarly, ATAC-seq data from monocytes, B cells, CD4+, and CD8+ T cells generated in a study by Corces et al19 were downloaded as BigWig files, peaks were called using macs220 and the union of all peaks combined to form a merged set of immune cell peaks. ATAC-seq peaks from 3 negative control tissues were downloaded from the ENCODE Reference Epigenome21 and merged into combined open chromatin sets for gastrointestinal tissue, striated muscle, and cardiovascular tissue. To visualize and analyze the degree of overlap across different tissues and annotation approaches, we used the command-line tool Intervene.22
Stratified Linkage Disequilibrium Score Regression
Linkage disequilibrium (LD) is the nonrandom association of alleles at different loci in a given population, as when variants located close to each other on the same chromosome tend to be inherited together as a haplotype. LD score regression is a statistical framework that takes summary statistics from GWAS as an input and examines the relationship between test statistics and LD in order to estimate common variant heritability. Combined with a set of annotations that assign genomic regions to functional categories, a stratified version of this approach (s-LDSC) can be used to infer relevant pathways or cell types showing a significant enrichment of heritability relative to the rest of the genome. We applied s-LDSC to partition heritability for PD across tissue and cell-type annotations and assessed enrichment, following the method as described by Finucane et al.23 We used downloadable LD scores estimated from 1000 Genomes data and included single-nucleotide polymorphisms (SNPs) present in HapMap 3 with an allele frequency above 0.05, excluding the major histocompatibility complex region (see Data Availability). Enrichment of heritability was assessed controlling for the effects of 53 functional annotations included in the full baseline model version 1.2. The p values were calculated based on the coefficient z-score, as recommended by the authors. Enrichment of heritability linked to the brain and immune system has been reported before, and we considered enrichment passing a nominal p value threshold (p < 0.05) as replication of previous work in the initial tissue-level analysis, although we also included 3 other tissues as negative controls. In the analyses of brain and immune cell types, we adjusted the significance threshold for 8 individual cell types (p < 0.00625).
Polygenic Risk Score Analysis
A polygenic risk score (PRS) is a score that summarizes the effect of many alleles on an individual’s phenotype, using summary statistics from a large GWAS to determine allele weights, which are then applied to individual-level data in an independent sample set for which scores are generated. As with LDSC, the analysis can be restricted to subsets of the genome to stratify for functional pathways or cell types of interest. To validate our heritability enrichment results using an independent method, we implemented a PRS approach recently used to investigate genetic risk across curated functional pathways in PD.14 PRSice version 2.3e24 was used to estimate individual PRS in the training and test data sets, based on allele weights from reference data summary statistics restricted to SNPs within open chromatin regions of specific brain and immune cell types, as defined by ATAC-seq peaks. PRSice allows for empirical optimization of the p value threshold for inclusion of SNPs into the PRS calculation. However, to avoid overfitting and obtain comparable results across cell types, we set a predefined threshold of p < 0.05. We used 1,000 permutations to calculate Nagelkerke’s pseudo r2, coefficient, and empirical p values for the association between PRS and disease status in the training and test sets, adjusting for an estimated PD prevalence of 0.005, age at onset for cases, and age at examination for controls, sex, and 20 principal components to account for population stratification.
Overlap With GWAS Loci
After assessing enrichment of heritability based on genomewide summary statistics, we wanted to explore if potentially causal SNPs at significant GWAS-loci locate specifically to microglial ATAC-seq peaks, and if a functional role in microglia could be supported by other publicly available data for any PD GWAS locus. We used the statistical fine-mapping method PAINTOR (Probabilistic Annotation INTegratOR; version 3.1)25 to prioritize 95% credible sets at PD GWAS loci without functional annotations as priors. We excluded the GBA locus, where causal variants are known to be protein coding,26 and 2 loci of particularly complicated LD structure, namely the HLA region and the H1/H2 inversion haplotype region on chromosome 17q21.31. Following the approach from the GWAS,9 SNPs less than 250 kb apart were assigned to the same locus. For each locus in a total of 74 loci, we extracted summary statistics for all variants within a window extending 10 kb from the first and last genomewide significant SNP within the locus. PAINTOR was run according to the recommendations in the online documentation using reference data from 1000 Genomes Phase 3 without priors (see Data Availability) to generate 95% credible sets from all 74 loci. We then followed 5 steps to identify loci potentially driven by microglial mechanisms: (1) credible SNP sets were assessed for overlap with ATAC-seq peaks for different cell types using bedtools. (2) Overlaps were evaluated to identify loci showing colocalization of credible set SNPs and open chromatin uniquely in microglia and no other brain cell type. (3) Genes within 500 kb of these colocalized SNPs were intersected with the human brain “microglial signature” published by Gosselin et al, comprising 881 transcripts showing minimum 10-fold increased expression in microglia relative to cortex tissue.27 (4) These microglial signature genes were checked against 82 genes identified as differentially expressed in PD brains by RNA sequencing, also revisited by Gosselin et al. (5) Finally, candidate genes were further evaluated taking advantage of publicly available databases and relevant published results.28–31 Overlap between credible set SNPs and genomic annotations at the P2RY12 locus were visualized using LocusZoom and UCSC Genome Browser.
Results
Stratified LD Score Regression Shows Enrichment for Microglia and Monocytes
Previous studies of heritability enrichment in PD have varied both with respect to methods and reported results. Reviewing the literature, we noted that some studies link genomic regions to cell types based on the location of expressed genes,14,32 whereas others take an approach based on available epigenetic data.18,33 Regions annotated based on GTEx-expressed genes span several 100 kilobases compared to narrow ATAC-seq peaks of typically a few 100 base pairs, indicating that the power to detect enrichment may be very different depending on annotation approach, in line with previous reports.34
Analyzing heritability enrichment on the tissue group level using s-LDSC with both annotation approaches, we found enrichment for brain tissue with both GTEx (coefficient p = 0.0038) and ATAC-seq annotations (coefficient p = 0.0072), whereas immune tissue enrichment was nominally significant only using ATAC-seq annotations (coefficient p = 0.032; Fig 1). Cardiovascular, gastrointestinal, or muscle tissue did not show enrichment with either method. We took these results as an indication that the annotation approach based on open chromatin, as a means to identify genomic regulatory elements, would be the most relevant to take forward to cell type specific enrichment analysis of brain and immune cells. We note, however, that a methodological comparison of annotation approaches was not the main aim of our work, and that the methods were not identical in all other respects, for example, starting from tissue versus cell-type level data.
FIGURE 1:

Stratified LD score regression at tissue level. Results from s-LDSC applied to 5 major tissue groups using either specifically expressed genes or open chromatin regions as identified by ATAC-seq to partition heritability. The dashed line represents a nominal significance threshold of 1-sided p < 0.05. ATAC-seq = Assay for Transposase-Accessible Chromatin sequencing; GTEx = Genotype-Tissue Expression; LD = linkage disequilibrium; s-LDSC = stratified linkage disequilibrium score regression. [Color figure can be viewed at www.annalsofneurology.org]
Assessing partitioned heritability in open chromatin regions of specific brain cell types, the strongest enrichment was seen for microglia (coefficient p = 0.0046), with nominally significant enrichment also for oligodendrocytes (coefficient p = 0.0097) and neurons (coefficient p = 0.048; Fig 2). In immune cells, enrichment was significant for monocytes, but did not pass a corrected p value threshold for B cells, CD4+, or CD8+ T cells. Calculating the pairwise Jaccard statistics between brain and immune cell pairs confirmed that microglia shared more open chromatin with immune cells than with other brain cell types, and most of all with monocytes (Figs 3 and 4). To further explore whether enrichment signals for microglia and monocytes are independent, we followed a previously reported strategy34 and jointly analyzed microglia and monocyte annotations in the same model, conditional on the baseline annotations. In a joint model, the microglia enrichment signal retained nominal significance (coefficient p = 0.037), whereas monocytes did not (coefficient p = 0.26).
FIGURE 2:
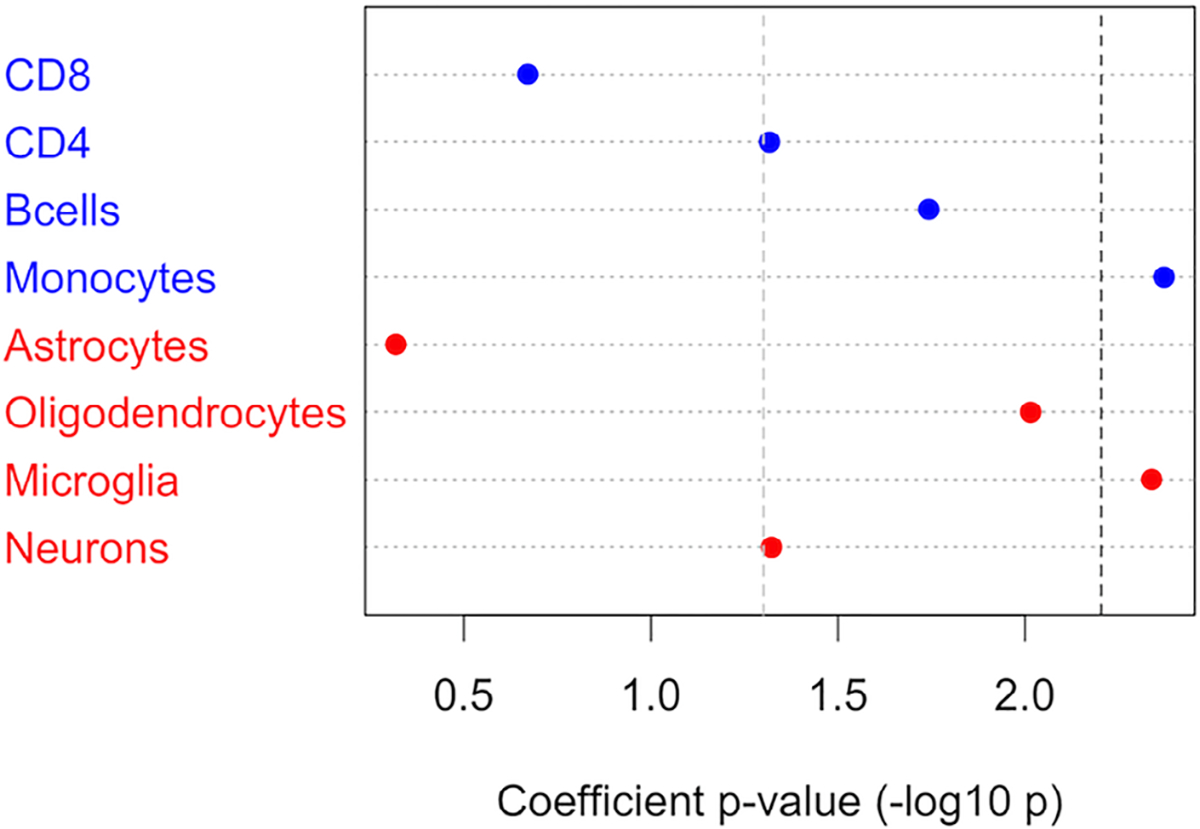
Stratified LD score regression in immune and brain cells. Results from s-LDSC applied to immune and brain cells using open chromatin regions as identified by ATAC-seq to partition the genome. The dashed line represents a Bonferroni-corrected significance threshold of 1-sided p < 0.00625. ATAC-seq = Assay for Transposase-Accessible Chromatin sequencing; LD = linkage disequilibrium; s-LDSC = stratified linkage disequilibrium score regression. [Color figure can be viewed at www.annalsofneurology.org]
FIGURE 3:

Pairwise Jaccard statistics for brain and immune cell ATAC-seq peaks. The plot shows Jaccard statistics for the pairwise intersection of ATAC-seq peaks for investigated immune and brain cell types (left) and the total size of open chromatin regions for each cell type (right). Microglia show more overlap with immune cells than other brain cells, and highest overlap with monocytes. ATAC-seq = Assay for Transposase-Accessible Chromatin sequencing.
FIGURE 4:

Venn diagram of genomic positions within ATAC-seq peaks of microglia and monocytes. Venn diagram showing the proportion of overlapping versus unique open chromatin as assessed by ATAC- seq in monocytes and microglia. ATAC-seq = Assay for Transposase-Accessible Chromatin sequencing. [Color figure can be viewed at www.annalsofneurology.org]
A Polygenic Risk Score Approach Provides Further Support for Microglial Enrichment
Investigating the performance of PRS calculated across open chromatin regions, we expectedly found very strong p values for all cell types. We note that this method is far less conservative, as it does not control for other colocalizing annotations in the same way as the baseline model in s-LDSC. Of interest, however, is the relative performance of each cell-specific PRS. In line with the results from s-LDSC, we found that PRS estimates based on SNPs in microglial open chromatin regions showed the strongest association with PD of all the brain cell types in both the training and test datasets (Table). In immune cells, the training data set ranked cell types in the same order as s-LDSC with the strongest association for monocytes, whereas the smaller test dataset showed a different pattern (Table).
TABLE.
Polygenic Risk Score Results Stratified by Brain Cell Type
| Data set | Tissue | Cell type | R2 | P | Coefficient | No. of SNPs |
|---|---|---|---|---|---|---|
| Training data set 7,218 PD 9,424 controls | Brain | Microglia | 0.058 | 6.9e-163 | 0.48 | 1,032 |
| Neurons | 0.055 | 2.9e-152 | 0.46 | 886 | ||
| Astrocytes | 0.048 | 1.3e-134 | 0.43 | 847 | ||
| Oligodendrocytes | 0.050 | 9.0e-141 | 0.44 | 842 | ||
| Immune | Monocytes | 0.084 | 1.4e-227 | 0.58 | 1,915 | |
| B cells | 0.061 | 4.8e-168 | 0.49 | 1,049 | ||
| CD4+ T cells | 0.056 | 2.4e-156 | 0.47 | 890 | ||
| CD8+ T cells | 0.055 | 9.0e-153 | 0.46 | 888 | ||
| Test data set 5,429 PD 5,814 controls | Brain | Microglia | 0.029 | 6.1e-56 | 0.31 | 1,032 |
| Neurons | 0.024 | 3.6e-46 | 0.28 | 886 | ||
| Oligodendrocytes | 0.020 | 2.6e-39 | 0.26 | 842 | ||
| Astrocytes | 0.019 | 7.1e-37 | 0.25 | 847 | ||
| Immune | B cells | 0.029 | 2.4e-54 | 0.31 | 1,049 | |
| CD4+ T cells | 0.029 | 3.8e-54 | 0.31 | 890 | ||
| CD8+ T cells | 0.026 | 6.4e-49 | 0.29 | 888 | ||
| Monocytes | 0.026 | 1.7e-48 | 0.29 | 1,915 |
Association results of polygenic risk scores modeled on summary statistics from an independent genomewide association study and stratified to include variants within open chromatin regions for various cell types. Scores were generated using the PRSice software tool with a cutoff of p < 0.05 in the reference data. Within each dataset and tissue, results are ordered with the best performing model first.
SNPs = single-nucleotide polymorphisms.
Nominating the Microglial Signature Gene P2RY12 as Driver of a Specific GWAS Signal in PD
Having shown microglial enrichment of common variant heritability based on genomewide summary statistics, we explored whether available data could support examples of specific significant GWAS loci being driven by gene regulation in microglia. The estimated 95% credible sets included 1,695 SNPs in total across 74 GWAS loci, out of which 33 SNPs across 22 loci overlapped with open chromatin in microglia, as compared to 21 SNPs across 16 loci in neurons. At 8 loci, such an overlap was observed for microglia only, and no other brain cell types. A total of 13 microglial signature genes were identified within 500 kb of colocalizing SNPs across 6 of these 8 loci (RNF49, SUCNR1, P2RY12, P2RY13, ISGF10, PROX2, GPR65, ITGAL, ITGAX, ITGAM, PYCARD-AS1, SNX20, and ADCY7). Of these 13 genes, 3 were also highlighted previously as showing significant differential brain mRNA expression in PD, namely P2RY12, P2RY13, and ITGAM.
Further exploration of expression quantitative locus (eQTL) databases revealed the most interesting candidate to be P2RY12, which is located close to a PD GWAS signal on chromosome 3. Credible set SNPs at this locus overlap uniquely with microglial open chromatin upstream and in intron 1 of P2RY12 (Fig 5). The expression profile across all tissues included in GTEx demonstrates that P2RY12 is primarily expressed in brain tissue. We queried the Brain xQTLserve browser28 and found that the top-hit GWAS SNP rs11707416 was associated with P2RY12 expression at p = 1.2e-4, with no other gene reaching nominal significance. The strongest credible set SNP overlapping with microglia open chromatin, rs17283010 (r2 = 1 with rs11707416 in 1000 Genomes EUR), showed association with expression levels at p = 1.5e-5. Similar results were found in the BRAINEAC database30 (rs11707416 eQTL for P2RY12 at p = 2.3e-4 averaged across brain regions) and PsychENCODE data31 (rs11707416 eQTL for P2RY12 at p = 1.2e-6; see Data Availability). Conversely, significant associations were not seen between GWAS SNPs and expression of P2RY13 or ITGAM. A PD GWAS locus browser was launched in 2020, summarizing the evidence supporting causality for specific genes at significant GWAS loci.35 The article presenting the browser also highlighted P2RY12 as an example of a strong functional candidate, top ranked in the locus based on brain29,31 and blood36 eQTL data, with a correlation between p values for PD risk and P2RY12 expression (Pearson correlation coefficient from 0.50 to 0.80 for the referenced eQTL datasets). Colocalization with regulatory regions of open chromatin was, however, not considered in this study.
FIGURE 5:
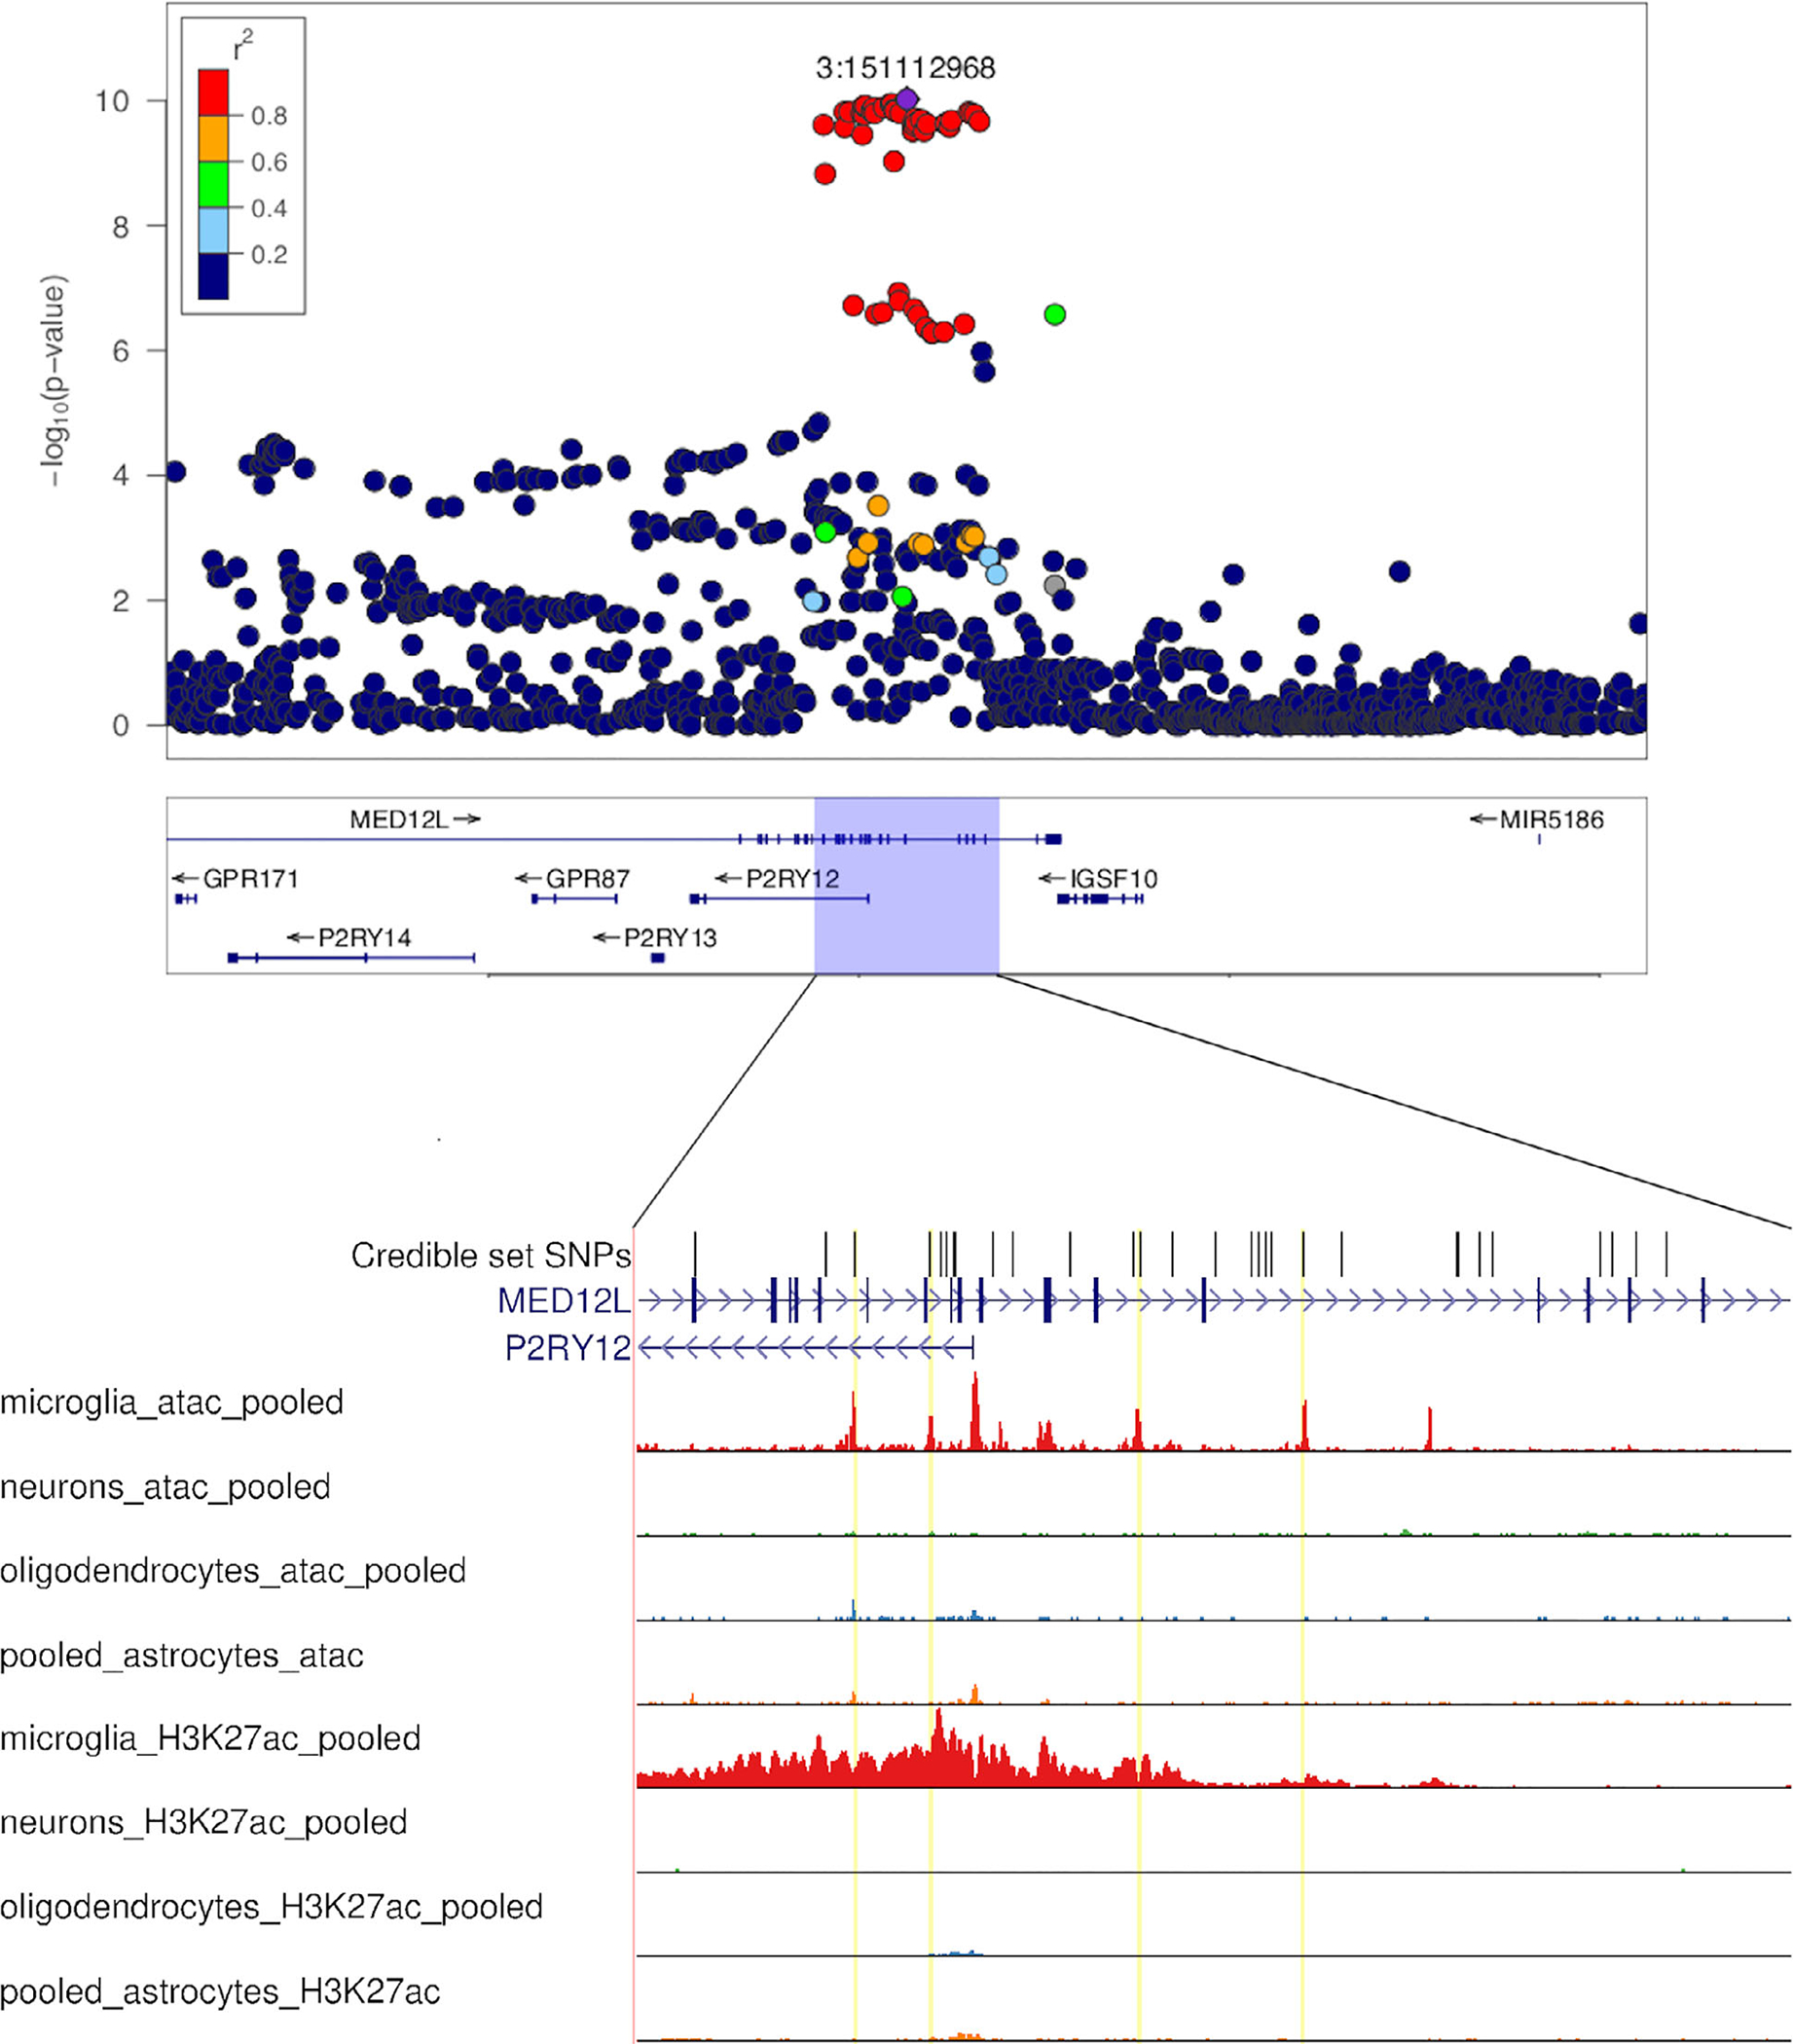
Overview of the P2RY12 locus. The top panel shows a regional Manhattan plot of the MED12L/P2RY12 locus in PD based on summary statistics from the most recent meta-analysis of PD GWAS.9 Below, the region containing significant SNPs is expanded to show the location of SNPs belonging to the 95% credible set in relation to brain cell specific results from ATAC-seq and Chromatin immunoprecipitation (ChIP)-seq of H3K27ac, a histone modification marking active enhancers. Credible set variants that colocalize with ATAC-seq peaks within a microglia-specific enhancer region are highlighted with yellow lines. ATAC-seq = Assay for Transposase-Accessible Chromatin sequencing; GWAS = genomewide association studies; PD = Parkinson’s disease; SNPs = single-nucleotide polymorphisms.
Discussion
In this study, we aimed to shed light on immune mechanisms in PD pathogenesis by investigating common variant heritability enrichment for specific cell types in the human brain and immune system. We observed significant enrichment in open chromatin regions of microglia, stronger than for any other class of brain cells. Although a role for microglia in pathogenesis is well established based on other lines of evidence, this finding is important in suggesting microglial dysregulation as a primary contributing cause of PD, not merely a secondary downstream phenomenon.
Microglial enrichment of heritability has been demonstrated in several studies of AD12 but has, to our knowledge, not been reported previously in PD. Reynolds et al applied s-LDSC to PD summary statistics in microglia and other brain cells, but found no significant enrichment.32 A recent large-scale unbiased analysis taking a PRS approach to functional partitioning of genetic PD risk highlighted immune-related processes as major contributors to PD etiology but did not report a specific enrichment for microglia.14 Common to both these studies, however, is that annotation was gene-centered. Our comparison of expression-based and open chromatin-based annotation approaches suggests that closing in on cell-specific regulatory DNA may provide higher sensitivity to detect enrichment in immune cells. Indeed, the p value we observed for PRS-based enrichment analyses in the present work would have passed the significance threshold in the pathway-study published by Bandres-Ciga et al.14 The ATAC-seq data we used on brain cell types was generated as part of a previous study that also included s-LDSC analyses of PD.18 Similarly, the combination of single-cell ATAC-seq and s-LDSC was applied in a very recent study of PD and AD.33 Both these studies highlighted microglial enrichment in AD, yet reported no significant heritability enrichment for any brain cell type in PD. We note, however, that both analyses used summary statistics originating from a smaller sample set than we included here, and included more GWAS studies and cell-types resulting in a substantially higher multiple testing burden.
In addition to the significant finding observed for microglia, we detected an equally strong enrichment of heritability in monocyte open chromatin regions, the only immune cell type to pass an adjusted significance threshold. Several lines of evidence implicate both the innate and adaptive immune system in PD, recently reviewed by Tan et al.2 A study based on eQTL analyses across leukocyte populations has proposed that whereas the adaptive immune system dominates in autoimmune disorders, innate immune mechanisms are of primary importance in neurodegenerative disorders, such as AD and PD.5 In line with this hypothesis, a study created composite annotations for different immune cell types, incorporating both gene expression and epigenetic data, and found the strongest immune cell enrichment signal for PD in monocytes.11 PD loci have also been associated with monocyte eQTLs in a transcriptome-wide association study.13 In contrast, others have applied s-LDSC combined with gene expression and epigenetic data and observed enrichment for most classes of immune cells in AD, yet only T cells passing the significance threshold in PD.3
Microglia and monocytes both belong to the myeloid lineage, and we note a substantial overlap in their open chromatin regions as identified by ATAC-seq. This complicates the interpretation of our findings. Jointly analyzing heritability enrichment for microglia and monocytes in the same model, we found that only the microglial signal remained significant. Importantly, all types of genetic enrichment studies depend on experimentally generated data to annotate the genome, which for many years have been far more available for different classes of blood cells than for individual brain cell types. With functional genomic regions of monocytes largely overlapping those of microglia, there is a possibility that similarity to microglia could have been a driving factor behind some of the previously reported results linking monocytes to neurodegeneration.
An improved understanding of the genetic contribution to neuroinflammation in PD must not only highlight cell types, but also close in on specific risk loci to identify relevant genes and molecular mechanisms. Intersecting credible set SNPs from GWAS with cell-specific annotations and eQTL data, we suggest P2RY12 as a likely microglial gene driving a PD association signal, in line with a recent article presenting the PD GWAS browser.35 Very shortly before submission of our article, a preprint (not yet peer reviewed) was published mapping microglia-specific eQTLs to brain disorders, also nominating P2RY12 in PD.37 It should be emphasized, however, that current evidence is all based on associations, and that functional studies in relevant experimental models will be required to conclusively validate a link between the gene and PD risk.
P2RY12 encodes the ADP receptor purinergic receptor P2Y, G protein-coupled 12, whose expression is often reported in the neuroscience literature as a marker of homeostatic, nonactivated microglia.38 Disease-associated activation of microglia is associated with downregulation of P2RY12, coupled with upregulation of other genes, including the strongly AD-associated risk gene TREM2.39–41 Evidence indicates that P2RY12 serves as a chemotactic receptor, directing movement of microglial cell processes toward sites of injury to enable repair, including maintenance of the blood-brain barrier.42 Interestingly, P2RY12 is also the target molecule of the antithrombotic compound clopidogrel, which has been shown experimentally to inhibit microglial P2RY12 in the context of blood-brain barrier breakdown.43 Further studies are clearly needed, but given that fact that this molecule is an established drug-target, we anticipate potentially important clinical implications if more evidence can be provided to support a causal role for P2RY12 in PD.
Genetic evidence supporting a role for microglia have been abundant in AD.12,18,33 Although our study links common susceptibility variants to microglia also in PD, the genes and mechanisms involved are likely to be distinct, as previous studies have shown very limited genetic correlation between PD and AD.44 An important future challenge will be to disentangle how pathogenic microglial responses differ across different neurodegenerative disorders.
We note that the present study has several limitations. Our narrow focus on open chromatin in the cell type specific analyses prioritizes regulatory DNA while leaving out other classes of functionally relevant polymorphisms, such as coding variants and variants affecting splicing. Furthermore, the applied methodology captures only common variation. We therefore emphasize that our findings do not represent any attempt to provide a complete or final picture of the relative importance of different cell types for heritable PD risk. Furthermore, we found several sources of data to be compatible with the hypothesis that a PD GWAS locus on chromosome 3 is driven by an effect on P2RY12 regulation, adding up to a compelling picture. Our study cannot, however, exclude other theoretically possible mechanisms, including variants in LD affecting a different gene through splicing or coding mechanisms, or effects involving other cell types than those studied here. Only functional experiments can ultimately resolve the mechanisms underlying typical GWAS signals in complex disorders.
In conclusion, we studied common variant PD heritability stratified for brain and immune cell types and found significant enrichment in microglia and monocytes. These results add to the growing body of evidence for immune mechanisms in PD pathogenesis and highlight microglia dysregulation as a primary contributing etiological factor. We also nominate the key microglial gene and clopidogrel target P2RY12 as a candidate driver of a PD GWAS signal. We anticipate further research into immune mechanisms and microglial function in neurodegeneration, ultimately aiming to develop targeted strategies to modulate these processes and develop novel effective therapies for PD.
Supplementary Material
Acknowledgments
The GWAS summary statistics used in this study were generated in a meta-analysis including data from 23andMe, Inc. We would like to thank the research participants and employees of 23andMe for making this work possible. The full GWAS summary statistics for the 23andMe discovery data set will be made available through 23andMe to qualified researchers under an agreement with 23andMe that protects the privacy of the 23andMe participants. Please visit https://research.23andme.com/dataset-access/ for more information and to apply to access the data. M.S.A. was funded by a grant from the South-Eastern Regional Health Authority, Norway. L.P. is supported by the Norwegian Health association. J.H. was supported by the UK Dementia Research Institute, which receives its funding from DRI Ltd., funded by the UK Medical Research Council, Alzheimer’s Society, and Alzheimer’s Research UK. J.H. is also supported by the Medical Research Council (award number MR/N026004/1), Wellcome Trust Hardy (award number 202903/Z/16/Z), the Dolby Family Fund, National Institute for Health Research, University College London Hospitals Biomedical Research Centre, and BRCNIHR Biomedical Research Centre at University College London Hospitals NHS Foundation Trust and University College London.
Footnotes
Potential Conflicts of Interest
Nothing to report.
Additional supporting information can be found in the online version of this article.
Data Availability
23andMe: https://research.23andme.com/dataset-access
Alkes group repository: https://alkesgroup.broadinstitute.org/LDSCORE
BioMart: http://grch37.ensembl.org/biomart
Brain xQTLserve browser: http://mostafavilab.stat.ubc.ca/xqtl
BRAINEAC: www.braineac.org
ENCODE: https://www.encodeproject.org Genotype-Tissue Expression (GTEx): www.gtexportal.org
Linkage disequilibrium score regression: https://github.com/bulik/ldsc
LocusZoom: locuszoom.org
MACS2: https://github.com/macs3-project/MACS/tree/master/MACS2
PAINTOR: https://github.com/gkichaev/PAINTOR_V3.0/wiki
PD GWAS locus browser: https://pdgenetics.shinyapps.io/GWASBrowser
PRSice: https://www.prsice.info
PsycENCODE: www.nimhgenetics.org/resources/psychencode
UCSC Genome Browser: https://genome.ucsc.edu
References
- 1.Ransohoff RM. How neuroinflammation contributes to neurodegeneration. Science 2016;353:777–783. [DOI] [PubMed] [Google Scholar]
- 2.Tan EK, Chao YX, West A, et al. Parkinson disease and the immune system - associations, mechanisms and therapeutics. Nat Rev Neurol 2020;16:303–318. [DOI] [PubMed] [Google Scholar]
- 3.Gagliano SA, Pouget JG, Hardy J, et al. Genomics implicates adaptive and innate immunity in Alzheimer’s and Parkinson’s diseases. Ann Clin Transl Neurol 2016;3:924–933. [DOI] [PMC free article] [PubMed] [Google Scholar]
- 4.Coetzee SG, Pierce S, Brundin P, et al. Enrichment of risk SNPs in regulatory regions implicate diverse tissues in Parkinson’s disease etiology. Sci Rep 2016;6:30509. [DOI] [PMC free article] [PubMed] [Google Scholar]
- 5.Raj T, Rothamel K, Mostafavi S, et al. Polarization of the effects of autoimmune and neurodegenerative risk alleles in leukocytes. Science 2014;344:519–523. [DOI] [PMC free article] [PubMed] [Google Scholar]
- 6.Mosley RL, Gendelman HE. T cells and Parkinson’s disease. Lancet Neurol 2017;16:769–771. [DOI] [PubMed] [Google Scholar]
- 7.Prinz M, Priller J. The role of peripheral immune cells in the CNS in steady state and disease. Nat Neurosci 2017;20:136–144. [DOI] [PubMed] [Google Scholar]
- 8.Hamza TH, Zabetian CP, Tenesa A, et al. Common genetic variation in the HLA region is associated with late-onset sporadic Parkinson’s disease. Nat Genet 2010;42:781–785. [DOI] [PMC free article] [PubMed] [Google Scholar]
- 9.Nalls MA, Blauwendraat C, Vallerga CL, et al. Identification of novel risk loci, causal insights, and heritable risk for Parkinson’s disease: a meta-analysis of genome-wide association studies. Lancet Neurol 2019;18:1091–1102. [DOI] [PMC free article] [PubMed] [Google Scholar]
- 10.Reynolds RH, Hardy J, Ryten M, Gagliano Taliun SA. Informing disease modelling with brain-relevant functional genomic annotations. Brain 2019;142:3694–3712. [DOI] [PMC free article] [PubMed] [Google Scholar]
- 11.Lu Q, Powles RL, Abdallah S, et al. Systematic tissue-specific functional annotation of the human genome highlights immune-related DNA elements for late-onset Alzheimer’s disease. PLoS Genet 2017;13:e1006933. [DOI] [PMC free article] [PubMed] [Google Scholar]
- 12.Tansey KE, Cameron D, Hill MJ. Genetic risk for Alzheimer’s disease is concentrated in specific macrophage and microglial transcriptional networks. Genome Med 2018;10:14. [DOI] [PMC free article] [PubMed] [Google Scholar]
- 13.Yl Li, Wong G, Humphrey J, Raj T. Prioritizing Parkinson’s disease genes using population-scale transcriptomic data. Nat Commun 2019;10:994. [DOI] [PMC free article] [PubMed] [Google Scholar]
- 14.Bandres-Ciga S, Saez-Atienzar S, Kim JJ, et al. Large-scale pathway specific polygenic risk and transcriptomic community network analysis identifies novel functional pathways in Parkinson disease. Acta Neuropathol 2020;140:341–358. [DOI] [PMC free article] [PubMed] [Google Scholar]
- 15.Chang D, Nalls MA, Hallgrimsdottir IB, et al. A meta-analysis of genome-wide association studies identifies 17 new Parkinson’s disease risk loci. Nat Genet 2017;49:1511–1516. [DOI] [PMC free article] [PubMed] [Google Scholar]
- 16.GTEx Consortium. The genotype-tissue expression (GTEx) project. Nat Genet 2013;45:580–585. [DOI] [PMC free article] [PubMed] [Google Scholar]
- 17.Finucane HK, Reshef YA, Anttila V, et al. Heritability enrichment of specifically expressed genes identifies disease-relevant tissues and cell types. Nat Genet 2018;50:621–629. [DOI] [PMC free article] [PubMed] [Google Scholar]
- 18.Nott A, Holtman IR, Coufal NG, et al. Brain cell type-specific enhancer-promoter interactome maps and disease-risk association. Science 2019;366:1134–1139. [DOI] [PMC free article] [PubMed] [Google Scholar]
- 19.Corces MR, Buenrostro JD, Wu B, et al. Lineage-specific and single-cell chromatin accessibility charts human hematopoiesis and leukemia evolution. Nat Genet 2016;48:1193–1203. [DOI] [PMC free article] [PubMed] [Google Scholar]
- 20.Zhang Y, Liu T, Meyer CA, et al. Model-based analysis of ChIP-Seq (MACS). Genome Biol 2008;9:R137. [DOI] [PMC free article] [PubMed] [Google Scholar]
- 21.Davis CA, Hitz BC, Sloan CA, et al. The encyclopedia of DNA elements (ENCODE): data portal update. Nucleic Acids Res 2018;46: D794–D801. [DOI] [PMC free article] [PubMed] [Google Scholar]
- 22.Khan A, Mathelier A. Intervene: a tool for intersection and visualization of multiple gene or genomic region sets. BMC Bioinform 2017; 18:287. [DOI] [PMC free article] [PubMed] [Google Scholar]
- 23.Finucane HK, Bulik-Sullivan B, Gusev A, et al. Partitioning heritability by functional annotation using genome-wide association summary statistics. Nat Genet 2015;47:1228–1235. [DOI] [PMC free article] [PubMed] [Google Scholar]
- 24.Choi SW, O’Reilly PF. PRSice-2: polygenic risk score software for biobank-scale data. Gigascience 2019;8:giz082. [DOI] [PMC free article] [PubMed] [Google Scholar]
- 25.Kichaev G, Yang WY, Lindstrom S, et al. Integrating functional data to prioritize causal variants in statistical fine-mapping studies. PLoS Genet 2014;10:e1004722. [DOI] [PMC free article] [PubMed] [Google Scholar]
- 26.Berge-Seidl V, Pihlstrom L, Maple-Grodem J, et al. The GBA variant E326K is associated with Parkinson’s disease and explains a genome-wide association signal. Neurosci Lett 2017;658:48–52. [DOI] [PubMed] [Google Scholar]
- 27.Gosselin D, Skola D, Coufal NG, et al. An environment-dependent transcriptional network specifies human microglia identity. Science 2017;356:eaal3222. [DOI] [PMC free article] [PubMed] [Google Scholar]
- 28.Ng B, White CC, Klein HU, et al. An xQTL map integrates the genetic architecture of the human brain’s transcriptome and epigenome. Nat Neurosci 2017;20:1418–1426. [DOI] [PMC free article] [PubMed] [Google Scholar]
- 29.Qi T, Wu Y, Zeng J, et al. Identifying gene targets for brain-related traits using transcriptomic and methylomic data from blood. Nat Commun 2018;9:2282. [DOI] [PMC free article] [PubMed] [Google Scholar]
- 30.Ramasamy A, Trabzuni D, Guelfi S, et al. Genetic variability in the regulation of gene expression in ten regions of the human brain. Nat Neurosci 2014;17:1418–1428. [DOI] [PMC free article] [PubMed] [Google Scholar]
- 31.PsychENCODE Consortium, Akbarian S, Liu C, et al. The PsychENCODE project. Nat Neurosci 2015;18:1707–1712. [DOI] [PMC free article] [PubMed] [Google Scholar]
- 32.Reynolds RH, Botia J, Nalls MA, et al. Moving beyond neurons: the role of cell type-specific gene regulation in Parkinson’s disease heritability. NPJ Parkinsons Dis 2019;5:6. [DOI] [PMC free article] [PubMed] [Google Scholar]
- 33.Corces MR, Shcherbina A, Kundu S, et al. Single-cell epigenomic analyses implicate candidate causal variants at inherited risk loci for Alzheimer’s and Parkinson’s diseases. Nat Genet 2020;52:1158–1168. [DOI] [PMC free article] [PubMed] [Google Scholar]
- 34.Hormozdiari F, Gazal S, van de Geijn B, et al. Leveraging molecular quantitative trait loci to understand the genetic architecture of diseases and complex traits. Nat Genet 2018;50:1041–1047. [DOI] [PMC free article] [PubMed] [Google Scholar]
- 35.Grenn FP, Kim JJ, Makarious MB, et al. The Parkinson’s disease genome-wide association study locus browser. Mov Disord 2020;35: 2056–2067. 10.1002/mds.28197. [DOI] [PMC free article] [PubMed] [Google Scholar]
- 36.Võsa U, Claringbould A, Westra HJ, et al. Unraveling the polygenic architecture of complex traits using blood eQTL meta-analysis. BioRxiv 2018; 10.1101/447367 [DOI] [Google Scholar]
- 37.Lopes KP, Snijders GJL, Humphrey J, et al. Atlas of genetic effects in human microglia transcriptome across brain regions, aging and disease pathologies. BioRxiv 2020. 10.1101/2020.10.27.356113. [DOI] [PMC free article] [PubMed] [Google Scholar]
- 38.Galatro TF, Holtman IR, Lerario AM, et al. Transcriptomic analysis of purified human cortical microglia reveals age-associated changes. Nat Neurosci 2017;20:1162–1171. [DOI] [PubMed] [Google Scholar]
- 39.Guerreiro R, Wojtas A, Bras J, et al. TREM2 variants in Alzheimer’s disease. N Engl J Med 2013;368:117–127. [DOI] [PMC free article] [PubMed] [Google Scholar]
- 40.Jonsson T, Stefansson H, Steinberg S, et al. Variant of TREM2 associated with the risk of Alzheimer’s disease. N Engl J Med 2013;368: 107–116. [DOI] [PMC free article] [PubMed] [Google Scholar]
- 41.Deczkowska A, Keren-Shaul H, Weiner A, et al. Disease-associated microglia: a universal immune sensor of Neurodegeneration. Cell 2018;173:1073–1081. [DOI] [PubMed] [Google Scholar]
- 42.Ransohoff RM, Cardona AE. The myeloid cells of the central nervous system parenchyma. Nature 2010;468:253–262. [DOI] [PubMed] [Google Scholar]
- 43.Lou N, Takano T, Pei Y, et al. Purinergic receptor P2RY12-dependent microglial closure of the injured blood-brain barrier. Proc Natl Acad Sci U S A 2016;113:1074–1079. [DOI] [PMC free article] [PubMed] [Google Scholar]
- 44.Brainstorm Consortium, Anttila V, Bulik-Sullivan B, et al. Analysis of shared heritability in common disorders of the brain. Science 2018;360:eaap8757. [DOI] [PMC free article] [PubMed] [Google Scholar]
Associated Data
This section collects any data citations, data availability statements, or supplementary materials included in this article.
Supplementary Materials
Data Availability Statement
23andMe: https://research.23andme.com/dataset-access
Alkes group repository: https://alkesgroup.broadinstitute.org/LDSCORE
BioMart: http://grch37.ensembl.org/biomart
Brain xQTLserve browser: http://mostafavilab.stat.ubc.ca/xqtl
BRAINEAC: www.braineac.org
ENCODE: https://www.encodeproject.org Genotype-Tissue Expression (GTEx): www.gtexportal.org
Linkage disequilibrium score regression: https://github.com/bulik/ldsc
LocusZoom: locuszoom.org
MACS2: https://github.com/macs3-project/MACS/tree/master/MACS2
PAINTOR: https://github.com/gkichaev/PAINTOR_V3.0/wiki
PD GWAS locus browser: https://pdgenetics.shinyapps.io/GWASBrowser
PRSice: https://www.prsice.info
PsycENCODE: www.nimhgenetics.org/resources/psychencode
UCSC Genome Browser: https://genome.ucsc.edu