

Abstract
Background:
Esophageal histology is critical for diagnosis and surveillance of disease activity in eosinophilic esophagitis (EoE). A validated noninvasive biomarker has not been identified. We aimed to determine the utility of blood and urine eosinophil-associated proteins to diagnose EoE and predict esophageal eosinophilia.
Methods:
Blood and urine were collected from children undergoing endoscopy with biopsy. Absolute eosinophil count (AEC), plasma eosinophil-derived neurotoxin (EDN), eosinophil cationic protein (ECP), major basic protein-1 (MBP-1), galectin-10 (CLC/GAL-10), Eotaxin-2 and Eotaxin-3, and urine osteopontin (OPN) and matrix metalloproteinase-9 (MMP-9) were determined. Differences were assessed between EoE and control, and with treatment response. The capacity to predict EoE diagnosis and esophageal eosinophil counts was assessed.
Results:
Of 183 specimens were collected from 56 EoE patients and 15 non-EoE controls with symptoms of esophageal dysfunction; 33 EoE patients had paired pre-and post-treatment specimens. Plasma (CLC/GAL-10, ECP, EDN, Eotaxin-3, MBP-1) and urine (OPN) biomarkers were increased in EoE compared to control. A panel comprising CLC/GAL-10, Eotaxin-3, ECP, EDN, MBP-1, and AEC was superior to AEC alone in distinguishing EoE from control. AEC, CLC/GAL-10, ECP, and MBP-1 were significantly decreased in patients with esophageal eosinophil counts <15/hpf in response to treatment. AEC, CLC/GAL-10, ECP, EDN, OPN, and MBP-1 each predicted esophageal eosinophil counts utilizing mixed models controlled for age, gender, treatment, and atopy; AEC combined with MBP-1 best predicted the counts.
Conclusions:
We identified novel panels of eosinophil-associated proteins that along with AEC are superior to AEC alone in distinguishing EoE from controls and predicting esophageal eosinophil counts.
Keywords: biomarker, blood, eosinophil, eosinophilic esophagitis, noninvasive
Graphical Abstract

A panel of eosinophil-associated plasma proteins along with AEC are superior to AEC alone in distinguishing EoE from non-EoE. A panel of AEC and MBP-1 predicted esophageal eosinophil counts superior to AEC alone longitudinally. Histologic responders to EoE treatment have a greater reduction in AEC, CLC/GAL-10, ECP, and MBP-1 than non-responders.
Abbreviations: EoE, eosinophilic esophagitis; AEC, absolute eosinophil count; CLC/GAL10, galectin-10; ECP, eosinophil cationic protein; EDN, eosinophil-derived neurotoxin; MBP-1, major basic protein.
1 |. INTRODUCTION
Upper endoscopy with multiple biopsies is required for diagnosis and surveillance of eosinophilic esophagitis (EoE) to identify the maximal density of eosinophils.1 This procedure is invasive, time consuming, and expensive with lost time from school and work. Currently, there are no validated noninvasive tests to assess disease activity that are well-correlated with esophageal eosinophilia.
In EoE, chronic dietary antigen exposure leads to production of chemokines Eotaxin-3 (CCL26) and −2 (CCL24) which drive sustained eosinophilic inflammation.2 Eosinophil-derived granule proteins such as major basic protein-1 (MBP-1), eosinophil-derived neurotoxin (EDN), eosinophil peroxidase (EPX), eosinophil cationic protein (ECP), and Charcot-Leyden Crystal protein/Galectin-10 (CLC/GAL-10) are present in esophageal tissue and luminal secretions of EoE subjects.3,4 Prospective cross-sectional studies have identified promising noninvasive biomarkers in the plasma and stool.5–7 Absolute eosinophil count (AEC) has a variably moderate correlation with esophageal eosinophilia,6,8,9 and several eosinophil granule cationic proteins including ECP and EDN, and chemokine Eotaxin-3 distinguish active EoE from control.6–8 In addition, studies have examined eosinophil progenitors and cell-surface markers on blood eosinophils with promising results.10–12 Despite associations with esophageal eosinophilia, an optimal individual noninvasive biomarker has not been established, such as calprotectin in inflammatory bowel disease, to guide diagnosis or management.13,14 Additionally, it is unclear whether a panel of noninvasive biomarkers is more effective than a single biomarker to identify esophageal eosinophilia. We hypothesized that a panel of biomarkers would be superior to AEC to differentiate EoE from non-EoE patient controls and to predict peak esophageal eosinophilia longitudinally.
2 |. METHODS
2.1 |. Study population
We conducted a prospective, longitudinal cohort study of children ages 1–18 years undergoing routine outpatient esophagogastroduodenoscopy (EGD) with biopsies for suspected or previously diagnosed EoE. Subjects were recruited from January 2011 to December 2015 at Ann & Robert H. Lurie Children’s Hospital of Chicago, Northwestern University Feinberg School of Medicine and Mount Sinai Medical Center, Icahn School of Medicine at Mount Sinai, New York. Parents were consented prior to the EGD for sample collection. The study was approved by the Institutional Review Boards of Lurie Children’s Hospital and Mount Sinai Medical Center.
2.2 |. Case definition
Diagnosis of EoE in children was based on presence of symptoms of esophageal dysfunction and esophageal biopsies with at least 15 eosinophils per high-powered field (eos/hpf).1 Patients were treated with twice daily proton pump inhibitor (PPI) for 8 weeks prior to their diagnostic endoscopy per the 2011 consensus recommendations for EoE diagnosis during that time.1 Other causes of esophageal eosinophilia were excluded such as medication, infection, or graft vs. host disease. Several patients had a history of co-morbid celiac or inflammatory bowel disease that were not active at the time of the diagnostic endoscopy for EoE. Samples were also collected from children previously diagnosed with EoE undergoing endoscopy to assess response to either dietary elimination, food re-introduction or “topical” corticosteroid treatment. Treatment responders and non-responders were patients on diet elimination or swallowed steroid treatment with <15 eos/hpf (inactive EoE, responder) or ≥15 eos/hpf (active EoE, non-responder) on post-treatment esophageal biopsy. Non-EoE patient controls (referred to as “controls”) comprised participants undergoing diagnostic endoscopy for symptoms of esophageal dysfunction with histologically normal esophageal biopsies. Control subjects included those with co-morbid atopic disease, but without another intestinal inflammatory disease, autoimmune illness, or history of neoplasm or transplant. Controls were found to have dyspepsia or non-erosive reflux disease (NERD). Subjects with PPI responsive EoE were excluded.
2.3 |. Histologic analysis
Four esophageal biopsies were obtained from 2 levels of the esophagus for standard of care assessment with hematoxylin & eosin by a pathologist. Eosinophilic inflammation was reported as peak esophageal eosinophil count (PEC) assessed at (400x) high power magnification (field size: 0.23 mm2).
2.4 |. Sample collection
A complete blood count with automated differential was obtained at the time of endoscopy to determine the peripheral absolute eosinophil count (AEC). Sample collection occurred longitudinally for EoE patients. A urine sample was collected the morning of endoscopy and blood was drawn when an intravenous line was placed for anesthesia. We collected 5 ml each for plasma and serum, along with 3 ml collected in potassium ethylenediaminetetraacetic acid (EDTA) and immediately processed for the peripheral absolute eosinophil count (AEC). Samples were given a unique coded study ID blinded to case/control as well as pre/post-treatment status.
2.5 |. Specimen processing
Serum was obtained by allowing the blood to clot for 30 min before centrifuging at 1100 RCF for 15 min at room temperature. Aliquots were stored frozen at −70°C until biomarker analysis. Plasma was obtained by centrifuging blood samples collected in EDTA tubes within 15 min at 1100 RCF for 15 min at room temperature and extracted plasmas were aliquoted and stored frozen at −70°C until they were processed. Urine samples were centrifuged twice at 1400 RCF for 10 min at 4°C aliquoted, frozen, and stored at −70°C until analysis.
2.6 |. Measurement of biomarkers
Analysis of samples was conducted at Lurie Children’s Hospital and at the University of Illinois at Chicago. Samples were batch analyzed with a single thaw by ELISA using commercial kits for: eosinophil-derived neurotoxin (EDN) (7830, MBL International) (detection limit; 0.62 ng/ml), eosinophil cationic protein (ECP) (7618E, MBL International) (detection limit/range; 0.125 ng/ml/0.125–40 ng/ml), Eotaxin-2 (DCC240B, R&D Systems) (detection limit/range; 14.3 pg/ml/78.0–5000 pg/ml), Eotaxin-3 (DCC260, R&D Systems) (detection limit/range; 5.2 pg/ml/7.8–500 pg/mL), osteopontin (OPN) (DOST00, R&D Systems, Minneapolis, MN) (detection limit/range; 0.024 ng/ml/0.3–20 ng/ml), and matrix metalloproteinase 9 (MMP-9) (DMP900, R&D Systems) (detection limit/range; 0.156 ng/ml/0.3–20 ng/ml). Major basic protein 1 (MBP-1) and galectin-10 (CLC/GAL-10) utilized in-house ELISAs performed in the laboratory of Dr. Ackerman with detection limits of 11.8–750 and 0.125–16 ng/ml, respectively, as previously described.3 Urine creatinine was measured using a commercial ELISA kit (KGE005, R&D Systems) (detection limit/range; 0.07 mg/dl/0.3–20 mg/dl) to normalize OPN& MMP-9 levels.
2.7 |. Pilot biomarker assessment
During the discovery phase, 10 serum, plasma, and urine aliquots from subjects with active EoE and 10 non-EoE patient controls were analyzed for eosinophil proteins (CLC/GAL-10, ECP, EDN, and MBP-1), eosinophil-associated chemokines (Eotaxin-2, Eotaxin-3), and cytokines (IL-17 and TSLP). Ten serum aliquots from children with active EoE and 10 controls were also analyzed for mast cell-associated enzymes (tryptase-alpha/beta1, carboxypeptidase A3, and matrix metalloproteinase-9). Urine from 10 subjects with EoE and 10 controls were analyzed for osteopontin (OPN) and matrix metalloproteinase-9 (MMP-9). Selection of the above biomarkers for analysis was based on previously published literature that demonstrated elevated levels of these proteins in esophageal tissue, blood and/or esophageal string test (EST) of subjects with EoE.3–9 Laboratory personnel were blinded to the status of the samples. Only biomarkers that demonstrated at least a twofold increase in plasma, serum or urine compared to controls were further analyzed in the full study cohort. Based on these findings, CLC/GAL-10, ECP, EDN, MBP-1, Eotaxin-2, Eotaxin-3, OPN, and MMP-9 were identified as the most promising biomarkers for subsequent full analysis. Plasma, rather than serum, was chosen for all subsequent biomarker assays to avoid potential coagulation-induced non-specific increases in biomarker levels in the blood samples, as demonstrated for EDN and ECP (see Figure S1) and CLC/GAL-10 (data not shown).
2.8 |. Statistical analysis
Statistical analyses were performed using R version 3.4.3 with alpha of 0.05 used to determine statistical significance. Differences in binary patient characteristics were determined by Wilcoxon rank-sum and Fisher’s exact test as appropriate. The sample size was determined based on the assumption that the standardized mean (z-score) of one biomarker is 0.5 after treatment, and the standardized mean of the same biomarker is 1.2 with a standard deviation of 1 before treatment (effect size of 0.7). To detect this difference, we determined that 29 subjects were needed to have 80% power to detect this difference using two-sided Wilcoxon signed-rank test with the overall type I error rate of 5%. Biomarker levels between EoE and patient controls were compared by non-parametric Wilcoxon rank-sum test. Receiver operating characteristics were determined for individual biomarkers. Random forest models were generated to assess AEC and panels of biomarkers to predict identification of EoE vs. non-EoE in the diagnostic EGD cohort. The randomForest function was utilized from the R package randomForest with 10,000 trees. We assessed four scenarios: 1) All plasma proteins +AEC – where random forest did not identify significant biomarkers, 2) Significant plasma proteins +AEC – where random forest determined the most significant group, 3) AEC alone, and 4) Significant plasma proteins excluding AEC. The error rate for random forest to correctly classify EoE vs non-EoE was determined. The probability to predict the outcome was utilized to generate ROC, along with the area under the curve. In addition, the sensitivity, specificity, positive predictive value, and negative predictive value were determined using the binary prediction results of the random forest models. Paired, non-parametric Wilcoxon signed-rank test was used to assess differences between biomarker levels at the time of diagnostic EGD and post-treatment. Zero-inflated Poisson models controlling for age, gender, presence of co-morbid atopic disease, and antihistamine use were fit to estimate the association between a panel of biomarkers and peak esophageal eosinophil counts, using the mixed_model function in the R package GLMMadaptive. For these models, we used all time points from all EoE patients, including those with a diagnostic EGD as well as patients with “known” EoE whose specimen collection occurred only at time points to assess treatment response (Figure 1). Each biomarker was first assessed in the model univariately followed by 2 combinations (eg, AEC +MBP-1).
FIGURE 1.

Consort diagram for EoE patients and non-EoE patient controls. Patient recruitment, reasons for inclusion/exclusion, and diagnostic/treatment status are noted. 33 of the 41 EoE patients with a diagnostic EGD, along with 15 “known” EoE patients had one or more EGDs to assess disease activity while on diet elimination or swallowed steroid treatment
Additional methods regarding collection of demographics, medical history, endoscopic findings, and symptoms in Supplemental Materials.
3 |. RESULTS
3.1 |. Patient characteristics
71 patients were enrolled and underwent at least one upper endoscopy with biopsies, with collection of plasma, serum, and urine specimens. Among the 71 subjects, 15 were non-EoE patients controls (referred to as “controls”), 15 patients had known EoE, while 41 had a diagnostic endoscopy while on high dose PPI (1–2 mg/kg/day), which identified active EoE (≥15 eos/hpf) (referred to as “diagnostic EoE”). Among the EoE patients, specimens were collected at a total of 183 endoscopies. A consort diagram is shown in Figure 1. Compared to control, there were no significant differences in age, race, ethnicity, or atopic conditions except for increased allergic conjunctivitis (diagnostic EoE: 27% vs. control: 6%, p < 0.05) (Table 1). The diagnostic EoE patients had a significant increase in endoscopic findings: edema, exudate, and furrows (p < 0.001), and a trend toward increased dysphagia (41% vs. 13%, p = 0.06) and feeding aversion (31% vs. 7%, p = 0.05) compared to control who had increased abdominal pain (73% vs. 31% p < 0.01). The median [IQR] of PEC for diagnostic EoE was 60 [35, 90]compared to control which was 0 [0, 6] (p < 0.001) (Figure S2A).
TABLE 1.
Patient characteristics for diagnostic EoE and non-EoE patient controls
| EoE (n = 41) | Control (n = 15) | p-valuea | |
|---|---|---|---|
| Age (years, Median [IQR]) | 8.8 [5.6,14.0] | 6.9 [5.9, 12.9] | 0.52 |
| Demographics, n (%) | |||
| Male | 32 (78) | 7 (47) | 0.05 |
| Hispanic | 4 (10) | 2 (13) | 0.64 |
| Asian | 3 (7) | 3 (20) | 0.14 |
| Black | 3 (7) | 0 (0) | 0.56 |
| White | 36 (88) | 12 (80) | 0.67 |
| Medical history, n (%) | |||
| Atopic | 32 (78) | 10 (67) | 0.49 |
| Asthma | 16 (39) | 5 (33) | 0.76 |
| Conjunctivitis | 2 (5) | 4 (27) | 0.04 |
| Eczema | 17 (41) | 6 (40) | 1.00 |
| Food allergy | 13 (32) | 1 (7) | 0.08 |
| Allergic rhinitis | 25 (61) | 8 (53) | 0.76 |
| Drug allergy | 5 (13) | 5 (33) | 0.12 |
| GERD | 6 (15) | 4 (27) | 0.43 |
| Celiac | 3 (7) | 0 (0) | 0.56 |
| IBD | 1 (2) | 0 (0) | 1.00 |
| Visual findings, n (%) | |||
| Edema | 33 (80) | 0 (0) | <0.001 |
| Exudate | 26 (63) | 0 (0) | <0.001 |
| Furrow | 38 (93) | 2 (13) | <0.001 |
| Rings | 10 (24) | 1 (7) | 0.26 |
| Stricture | 0 (0) | 0 (0) | ND |
| Symptoms, n (%) | |||
| Abdominal pain | 11 (27) | 11 (73) | 0.004 |
| Chest pain | 4 (10) | 2 (13) | 0.65 |
| Dysphagia | 18 (44) | 2 (13) | 0.06 |
| Early satiety | 12 (29) | 3 (20) | 0.74 |
| Feeding aversion | 14 (34) | 1 (7) | 0.05 |
| Food Impaction | 8 (20) | 3 (20) | 1.00 |
| FTT | 9 (22) | 1 (7) | 0.26 |
| Gagging | 10 (24) | 1 (7) | 0.26 |
| Heartburn | 5 (12) | 3 (20) | 0.67 |
| Nausea | 13 (32) | 4 (27) | 1.00 |
| Odynophagia | 5 (12) | 0 (0) | 0.31 |
| Pockets or spits out food | 7 (17) | 4 (27) | 0.46 |
| Slow eating | 15 (37) | 4 (27) | 0.54 |
| Vomiting | 9 (22) | 4 (27) | 0.73 |
Comparisons made by Student’s t test for age and Fisher’s Exact test for remaining dichotomous variables.
Significant p-values at p < 0.05 or better are bolded.
3.2 |. Comparison of biomarkers in diagnostic EoE and control
To address whether a noninvasive biomarker could serve as a screen for EoE, we assessed differences between the plasma and urine eosinophil-associated proteins between the diagnostic EoE and control patients. As expected, AEC was increased in diagnostic EoE compared to control (median [IQR], 445 [288, 653] vs. 160 [85, 199] cells/μl, p < 0.001) (Figure 2A). Notably, we found several plasma eosinophil-associated proteins increased in diagnostic EoE compared to control: CLC/GAL-10 (19.7 [10.3, 32.1] vs. 7.5 [5.8, 9.7] ng/ml, p < 0.001), ECP (3.9 [2.5, 5.4] vs. 1.2 [0.8, 2.5] ng/ml, p < 0.001), EDN (20.0 [15.7, 25.5] vs. 12.8 [11.2, 14.6] ng/ml, p < 0.001), Eotaxin-3 (5.5 [0.0, 14.2] vs. 0 [0, 2.7] pg/ml, p < 0.01), MBP-1 (751 [555, 1104] vs. 497 [427, 588] ng/ml, p < 0.01) (Figure 2B–F). Urine OPN was elevated in diagnostic EoE compared to control (19.4 [12.0, 29.0] vs. 8.9 [6.0, 17.8] ng/ml, p < 0.05, Figure S2D). We next assessed the receiver operating characteristics (ROC) of individual biomarkers to distinguish diagnostic EoE from control. Several plasma eosinophil-associated proteins had AUC over 0.75; AEC had an AUC of 0.9 (Figure S3). Based on the receiver operating characteristics, the optimal cut-point was determined for each biomarker, along with sensitivity, specificity, and positive/negative predictive value (Table S1). Together, these findings validate prior publications6,8,9 and identify novel biomarkers, particularly CLC/GAL-10, with potential as a screen for EoE.
FIGURE 2.
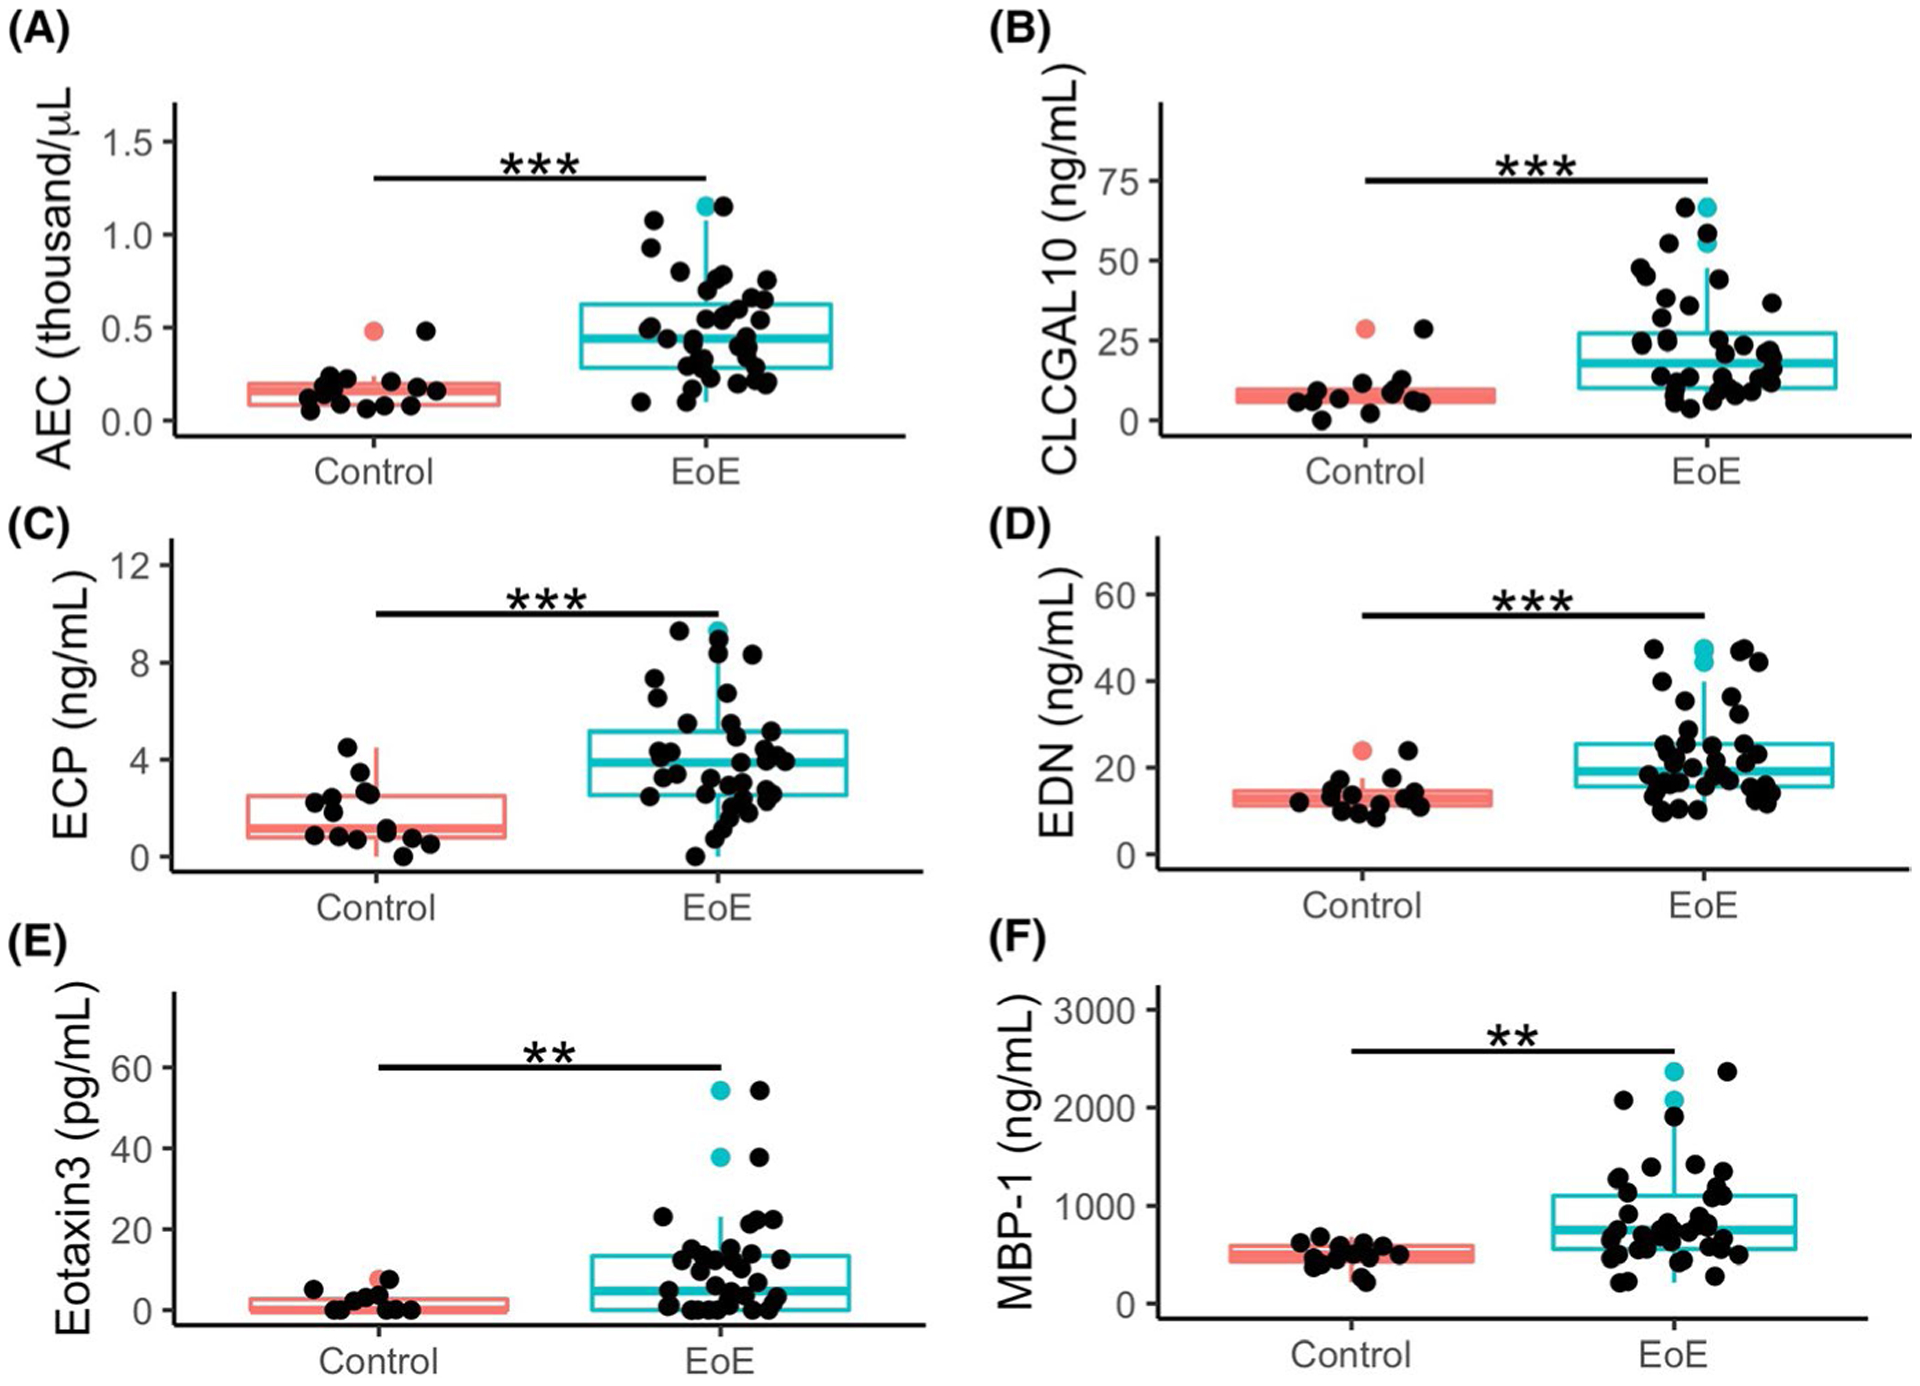
Increased AEC and plasma CLC/GAL-10, ECP, EDN, Eotaxin-3, and MBP-1 in children with EoE at diagnostic endoscopy compared to Non-EoE control subjects. Comparisons of EoE patients at diagnostic endoscopy (n = 41) vs Non-EoE control subjects (n = 15) made by non-parametric t test of absolute eosinophil count (A), and plasma levels of CLC/GAL-10 (B), ECP (C), EDN (D), Eotaxin-3 (E), and MBP-1 (F). **=p < 0.01, ***=p < 0.001. Non-EoE controls had symptoms of esophageal dysfunction with histologically normal esophageal biopsies. Non-EoE controls were found to have dyspepsia or non-erosive reflux disease (NERD)
3.3 |. Utility of single or multiple biomarkers for EoE diagnosis
We next sought to determine the utility of combinations of biomarkers to differentiate EoE diagnosis from control. We performed random forest analysis to determine an optimal set of weighted factors to predict EoE vs non-EoE. The urine biomarkers were not included as samples were not available for all patients. We simulated 10,000 trees for four scenarios: 1) all plasma biomarkers including AEC, 2) significant biomarkers (determined by random forest) including AEC, 3) AEC alone, and 4) significant biomarkers (determined by random forest) without AEC. The receiver operating characteristic (ROC) graphs for each model along with prediction model performance characteristics are shown in Figure 3. Notably, the panel of biomarkers determined to be significant by random forest (CLC/GAL-10, ECP, EDN, Eotaxin-3, and MBP-1) along with AEC was found to best predict EoE with an error rate of 16% (sensitivity: 89%, specificity 79%, PPV: 73%, NPV: 91%), and an AUC of 0.9 (Figure 3B). This was more optimal compared to AEC (Figure 3C) or the significant biomarkers alone (Figure 3D). While AEC was most useful, MBP-1 and CLC/GAL10 were most useful among the plasma biomarkers (Figure S4) We additionally assessed histologic thresholds of 10 and 30 eos/hpf but found 15 eos/hpf to have the most ideal performance characteristics (data not shown). Thus, we identified a panel of plasma eosinophil-associated proteins that along with AEC may be suitable to screen for EoE.
FIGURE 3.

A panel of biomarkers is superior to AEC alone to identify EoE diagnosis. Receiver operating characteristics (ROC) from random forest analysis for distinguishing EoE from non-EoE controls. Panels are All Biomarkers (A), Significant Biomarkers (B), AEC alone (C), and Significant Biomarkers without AEC (D). Significant biomarkers were determined by random forest and are CLC/GAL-10, ECP, EDN, Eotaxin-3, and MBP-1. The error rate and area under the curve (AUC) are shown for each random forest model, along with probabilities along the ROC curves; all curves are significant at p < 0.001. Sensitivity, specificity, positive predictive value (PPV), and negative predictive value (NPV) derived from the prediction results for each Random Forest model are shown
3.4 |. Effect of treatment on biomarkers
We next sought to determine how the eosinophil-associated proteins changed with EoE-directed treatment. Among the 33 patients with paired specimens before and after treatment (average duration between endoscopies: 7.0 ± 6.7 months), 9 were treated with swallowed corticosteroids and 24 with elimination diet. The median [IQR] PEC for these 33 patients before and after treatment was 60 [30, 95] and 6 [0, 20], respectively (Table S2, p < 0.001). Most biomarkers were significantly reduced after treatment (Table S2). Among this paired group (Figure S5A), 23 were treatment responders (PEC <15 eos/hpf on biopsy after treatment) and 10 were non-responders (PEC at least 15 eos/hpf after treatment). We found a very significant reduction in AEC, along with plasma CLC/GAL-10, ECP, and MBP-1 in histologic responders compared to non-responders (Figure 4), while a small but significant decrease was seen in EDN (Figure S5B), and no significant change in plasma eotaxin-2, eotaxin-3 and urine MMP-9 and OPN (Figure S5C–F). Thus, we identified a novel treatment responsiveness of plasma CLC/GAL-10, and validated this responsiveness in AEC, and plasma ECP and MBP-1.
FIGURE 4.

Significant Reduction in AEC and Plasma CLC/GAL-10, ECP, and MBP-1 in Histologic Responders to Treatment for Eosinophilic Esophagitis. Plasma eosinophil-associated proteins were measured by ELISA, and compared by Wilcoxon signed-rank test in paired EoE patients before (red) and after (blue) treatment with diet elimination or swallowed steroids. Patients grouped by post-treatment histologic response (responder PEC <15, non-responder PEC: 15 or more). There was a significant reduction in AEC (A), CLC/GAL-10 (B), ECP (C), and MBP-1 (D) in histologic responders. *=p < 0.05, **=p < 0.01, ***=p < 0.001
3.5 |. Utility of single or multiple biomarkers to predict esophageal eosinophil count longitudinally
We next interrogated all 183 time points from the 56 EoE patients (Figure 1), to determine the ability of one or more eosinophil-associated proteins to predict PEC. To determine whether atopic diseases (asthma, conjunctivitis, eczema, and rhinitis) or medications (antihistamine, inhaled steroid, intranasal steroid, montelukast, topic steroids, and proton pump inhibitor) influenced disease activity or biomarker level, we performed mixed effects models with the log of each biomarker as the dependent variable. This identified antihistamine treatment along with a diagnosis of asthma, eczema, and rhinitis as potential confounders (Table S3, Table S4A/B). We next utilized mixed models to assess the ability of the eosinophil-associated proteins to predict PEC in the longitudinal cohort. A zero-inflated Poisson (ZIP) mixed model was utilized to account for the significant number of time points with a PEC of 0. Unadjusted models for each individual biomarker (Table 2) identified AEC, CLC/GAL-10, ECP, EDN, and MBP-1 as significant predictors of PEC. When we adjusted for antihistamine treatment, diagnosis of asthma, eczema, or rhinitis, as well as age and gender, the model estimates of AEC, MBP-1, and CLC/GAL-10 increased with lower standard error and p-values (Table 2). AEC was the strongest predictor followed by MBP-1. Finally, we assessed whether AEC, AEC+MBP-1 (combination 1), or AEC+CLC/GAL-10+ECP+EDN+MBP-1 (combination 2) was superior to predict PEC in ZIP mixed models (Table S5). AEC+MBP-1 better predicted PEC than AEC alone (p < 0.005) but was no different than the larger combination (Table S5). Thus, we identified CLC/GAL-10 as a novel predictor of esophageal eosinophilia. In addition, we validated AEC and MBP-1 as predictors of esophageal eosinophilia, with improved utility in combination.
TABLE 2.
Individual and combinations of eosinophil-associated plasma proteins predict esophageal eosinophil count
| Unadjusted | Adjusted | |||||
|---|---|---|---|---|---|---|
| Biomarker | Estimatea | Std. Err | p-value | Estimateb | Std. Err | p-value |
| AEC | 2.39 | 0.55 | <0.0001 | 2.52 | 0.55 | <0.0001 |
| CLC/GAL-10 | 0.44 | 0.13 | <0.001 | 0.50 | 0.13 | <0.0001 |
| ECP | 0.50 | 0.14 | <0.001 | 0.59 | 0.16 | <0.001 |
| EDN | 0.49 | 0.21 | <0.05 | 0.67 | 0.26 | <0.05 |
| Eotaxin-2 | 0.01 | 0.03 | 0.65 | 0.01 | 0.04 | 0.72 |
| Eotaxin-3 | 0.06 | 0.06 | 0.31 | 0.07 | 0.07 | 0.32 |
| MBP-1 | 0.66 | 0.61 | <0.001 | 0.89 | 0.23 | <0.0001 |
| MMP-9 | 0.51 | 0.51 | 0.60 | 0.99 | 1.17 | 0.40 |
| OPN | 0.25 | 0.25 | 0.09 | 0.26 | 0.15 | 0.08 |
| Combination 1 | ||||||
| AEC | 2.07 | 0.60 | <0.001 | 2.00 | 0.57 | <0.001 |
| MBP-1 | 0.35 | 0.20 | 0.07 | 0.51 | 0.21 | <0.05 |
| Combination 2 | ||||||
| AEC | 1.73 | 0.66 | <0.01 | 1.73 | 0.67 | <0.01 |
| CLC/GAL-10 | 0.12 | 0.15 | 0.42 | 0.10 | 0.16 | 0.52 |
| ECP | 0.15 | 0.18 | 0.39 | 0.18 | 0.19 | 0.33 |
| EDN | −0.08 | 0.24 | 0.73 | −0.08 | 0.28 | 0.78 |
| MBP-1 | 0.25 | 0.21 | 0.23 | 0.48 | 0.25 | 0.05 |
Estimated mean effect of biomarker(s) to predict log PEC assessed in Zero-inflated Poisson Mixed Models. Significant biomarkers are bolded (p < 0.05). Individual models performed in the longtudinal EoE cohort (183 EGDs) for each biomarker along with combination 1 and 2.
Estimated mean effect of biomarker(s) to predict log PEC assessed in Zero-inflated Poisson Mixed Models which control for age, gender, atopic diseases/medications. Significant biomarkers are bolded (p < 0.05). Individual models performed in the longtudinal EoE cohort (183 EGDs) for each biomarker for along with combination 1 and 2.
4 |. DISCUSSION
In this prospective, longitudinal pediatric study, we identified several plasma and urine biomarkers with potential as noninvasive measures in the diagnosis and surveillance of EoE. While prior studies have typically assessed serum, our study assessed a panel of plasma and urine biomarkers in addition to Absolute Eosinophil Count (AEC). We found a combination of plasma CLC/GAL-10, ECP, EDN, Eotaxin-3, and MBP-1, along with AEC was superior to AEC alone in differentiating EoE diagnosis from control. The combination of AEC and plasma MBP-1 better predicted Peak Eosinophil Count (PEC) than AEC alone longitudinally in children with EoE. While additional validation is necessary, these novel findings of unique plasma biomarkers, and 2 panels of noninvasive measures are promising potential tools for EoE screening and surveillance.
Many studies have assessed absolute eosinophil count (AEC) as a biomarker in EoE. We found AEC was effective at identifying EoE diagnosis (AUC 0.9), and highly predictive of peak esophageal eosinophil count. Min SB et al. found AEC to be higher in 46 EoE adults and children compared to 53 controls, including predictability toward treatment response.8 Schlag et al., found AEC correlated with esophageal eosinophil density after treatment in adults.9 Both studies assessed AEC in patients treated with swallowed corticosteroids. Konikoff et al. reported greater utility of AEC compared to EDN and Eotaxin-3, for identifying EoE disease activity and differentiating from control.6 Our prospective study extends this previous work with more children with EoE, and inclusion of patients on elimination diets and swallowed corticosteroids. Together, this supports the utility of measuring AEC as a screen for EoE and for surveillance.
Unlike previous work,6,8,15–17 we found CLC/GAL-10, an eosinophil cytosolic protein,18 and MBP-1, a cytotoxic eosinophil granule cationic protein, were useful for EoE diagnosis, while Eotaxin-3, an eosinophil chemokine,19 alone was less useful.6 This is the first study to demonstrate the utility of plasma CLC/GAL-10 as an EoE biomarker. Furthermore, our findings validate the utility of eosinophil granule-associated cationic ribonucleases, EDN (RNASE2),6,8 and ECP (RNASE3),8,20 as biomarkers with potential utility to screen for EoE diagnosis. These findings reflect the ongoing recruitment and activation state of eosinophils during active EoE. We further identified a panel (AEC, CLC/GAL-10, ECP, EDN, Eotaxin-3, and MBP-1) that best predicted EoE diagnosis compared to AEC alone utilizing random forest, a data mining and machine learning analysis,21 which bootstraps random chunks of data for decision trees to increase generalizability. This novel panel warrants further prospective studies. In addition to differences between active EoE and non-EoE controls, we found AEC, CLC/GAL-10, ECP, and MBP-1 distinguished treatment responders from non-responders, a novel finding with potential utility in treatment trials. Finally, we utilized zero-inflated Poisson mixed models to assess the ability of the biomarkers to predict esophageal eosinophilia in the longitudinal EoE cohort. These models enhance generalizability by accounting for clustering of specific groups of biomarkers within subjects, and the relatively small range of eosinophil counts that identify inactive disease. This considers the dramatic difference that complete remission (0 eos/hpf) may have relative to partial remission (<15 eos/hpf) or active EoE. Individual biomarkers (AEC, CLC/GAL-10, ECP, EDN, and MBP-1) correlated with PEC longitudinally, and we identified the combination of AEC and MBP-1 as significant compared to AEC alone for predicting esophageal eosinophilia, a novel finding. Together, our findings identify biomarker panels to screen for esophageal eosinophilia and should be validated in a large longitudinal cohort.
Another key strength of our study was the methods used for both sample collection and biomarker detection. Specifically, the rapid processing and use of plasma, rather than serum, to minimize clotting-induced non-specific biomarker “secretion” from eosinophils in the blood sample itself, was used to avoid biomarker levels (ECP and EDN; Figure S1) and CLC/GAL-10 (not shown) being simple “surrogates” of the AEC at the time of blood draw. For MBP-1 analysis, reduction and alkylation of the sample were performed prior to ELISA and are established to maximize recovery and detection of MBP-1,3,20,22 a potential limitation of prior work.17 Thus, our approach is novel in peripheral protein biomarker detection in EoE, and an important contribution to the field.
Several studies have assessed potential biomarkers of EoE in urine. Cunnion KM et al. recently described a mass spectrometry-based method of measuring urinary 3-bromotyrosine, which showed excellent sensitivity and specificity in untreated EoE patients with active disease vs. atopic and non-atopic controls.23 Lexmond et al., however, found no utility in measuring urinary leukotriene E4.23,24 We found urine matrix metalloproteinase (MMP-9), a zinc-dependent endopeptidase thought to be involved in remodeling,25 was not useful to assess EoE disease activity. Osteopontin (OPN), an integrin-binding cell adhesion molecule expressed by a wide variety of immune cells,26 weakly predicted esophageal eosinophil counts. Fewer urinary than plasma specimens were collected in this study, thus more validation studies regarding OPN are warranted to confirm its utility as a biomarker.
There were a number of weaknesses in our study. While several biomarkers were reduced in treatment response, we surprisingly found some biomarkers reduced in non-responders. This may represent a reduced state of eosinophil activation with treatment, as can be seen histologically,27 and would be necessary to validate in larger studies. In addition, we found increased males in the EoE compared to non-EoE cohort. While this increased male prevalence is typical of the EoE population, future studies will need to control for gender. While atopic diseases aside from EoE could be a source of elevated peripheral biomarkers, this study could not assess this directly as we measured atopic disease prevalence and medication use, but not disease severity. Nonetheless, we did not identify any significant confounders, whether atopy, gender, or type of treatment (data not shown), in mixed models of the biomarkers to predict esophageal eosinophilia. As all EoE patients were treated with a PPI prior to diagnostic endoscopy, we were not able to assess the effect of the PPI on these biomarkers. Future studies should examine patients who are responsive vs. non-responsive to PPI therapy. Direct comparison of patients treated with either elimination diet or swallowed corticosteroids could not be made since the study was not powered to detect this. In addition, we were not able to assess the relationship of the biomarkers to symptoms given the lack of an available validated tool at the time of the study, and broad range of symptoms in children. Finally, our reliance on peak esophageal eosinophil counts (PEC) as opposed to a composite histological score27 may be a limitation, as it could underestimate the burden of eosinophilia in an entire biopsy. Utilization of the EoE histological scoring system27 and Endoscopic Reference Score (EREFS)28,29 would be beneficial for validation studies.
In conclusion, we have identified a novel panel of plasma (CLC/GAL-10, ECP, EDN, Eotaxin-3, and MBP-1) biomarkers, which along with absolute eosinophil count (AEC), are useful in identifying untreated EoE from non-EoE controls. In addition, AEC, and plasma CLC/GAL-10, ECP, EDN, and MBP-1 each predicted esophageal eosinophilia, while the combination of AEC and MBP-1 was most optimal. While further development is needed to commercialize these assays, large prospective studies are needed to address the feasibility, applicability, and action ability of these biomarker panels as a screening tool for clinicians to identify subjects for EGD referral to confirm EoE and to monitor treatment response.
Supplementary Material
ACKNOWLEDGEMENTS
The authors thank the American Partnership for Eosinophilic Disorders (APFED), Buckeye Foundation, Ann & Robert H. Lurie Children’s Hospital of Chicago, and Consortium of Eosinophilic Gastrointestinal Researchers (CEGIR) for their financial support of the study. Dr. Wechsler was a scholar trainee in CEGIR, part of the Rare Disease Clinical Research Network, an initiative of the National Institutes of Health Office of Rare Diseases Research, National Center for Advancing Translational Sciences, funded through collaboration between the National Institute of Allergy and Infectious Disease, National Institute of Diabetes, Digestive, and Kidney Diseases, and Nation Center for Advancing Translational Sciences. The authors also thank the pediatric patients and their parents for participating in the study, and the patient advocacy groups American Partnership for Eosinophilic Disorders (APFED), Campaign Urging Research for Eosinophilic Diseases (CURED) and Eosinophil Family Coalition for their support of CEGIR.
CONFLICT OF INTEREST
Joshua Wechsler receives consulting fees from Allakos, Incand Regeneron for medical advisory board and serves (no fees) on the medical advisory board of Campaign Urging Research for Eosinophilic Diseases (CURED). Steven Ackerman is a member of the American Partnership for Eosinophilic Diseases (APFED) medical advisory panel (no fees), and a co-developer of the esophageal string test (EST), holds patents on use of the EST, and is co-founder of EnteroTrack, LLC, a company commercializing the EST for clinical use in the therapeutic management of EoE. Mirna Chehade received clinical trial funding from Regeneron, Shire, Allakos, and AstraZeneca, research funding from Danone, consulting fees from Regeneron, Allakos, Adare, Shire/Takeda, Nutricia, AstraZeneca, Sanofi and Bristol Myers Squibb, and serves (no fees) on the medical advisory board for APFED and CURED. Barry K. Wershil serves (no fees) on the APFED medical advisory board.
Funding information
This work was supported in part by a HOPE pilot grant from the American Partnership for Eosinophilic Disorders (APFED) (to AFK, BKW, SJA), Buckeye Foundation (to AFK and MC), K08DK097721 (to JBW), internal funding from Ann & Robert H. Lurie Children’s Hospital of Chicago, and Consortium of Eosinophilic Gastrointestinal Researchers (CEGIR) [to JBW]. Dr. Wechsler was a trainee scholar in CEGIR (U54 AI117804) part of the Rare Disease Clinical Research Network, an initiative of the Office of Rare Diseases Research, National Center for Advancing Translational Sciences, and is funded through collaboration between National Institute of Allergy and Infectious Disease, National Institute of Diabetes, Digestive, and Kidney Diseases, and Nation Center for Advancing Translational Sciences. CEGIR is also supported by patient advocacy groups including American Partnership for Eosinophilic Disorders, Campaign Urging Research for Eosinophilic Diseases and Eosinophil Family Coalition
Abbreviations:
- AEC
absolute eosinophil count
- AUC
area under curve
- CLC/GAL-10
Charcot-Leyden Crystal protein/Galectin-10
- ECP
eosinophil cationic protein
- EDN
eosinophil-derived neurotoxin
- EGD
esophagogastroduodenoscopy
- EoE
eosinophilic esophagitis
- eos
eosinophil
- EST
esophageal string test
- hpf
high-powered field
- MBP-1
major basic protein-1
- MMP-9
matrix metalloproteinase-9
- OPN
osteopontin
- PEC
peak esophageal eosinophil count
- ROC
receiver operating characteristics
Footnotes
SUPPORTING INFORMATION
Additional supporting information may be found in the online version of the article at the publisher’s website.
REFERENCES
- 1.Liacouras CA, Furuta GT, Hirano I, et al. Eosinophilic esophagitis: updated consensus recommendations for children and adults. J Allergy Clin Immunol 2011;128:3–20 e6; quiz 21–2. [DOI] [PubMed] [Google Scholar]
- 2.Wechsler JB, Bryce PJ. Allergic mechanisms in eosinophilic esophagitis. Gastroenterol Clin North Am 2014;43:281–296. [DOI] [PMC free article] [PubMed] [Google Scholar]
- 3.Furuta GT, Kagalwalla AF, Lee JJ, et al. The oesophageal string test: a novel, minimally invasive method measures mucosal inflammation in eosinophilic oesophagitis. Gut 2013;62:1395–1405. [DOI] [PMC free article] [PubMed] [Google Scholar]
- 4.Kern E, Lin D, Larson A, et al. Prospective assessment of the diagnostic utility of esophageal brushings in adults with eosinophilic esophagitis. Dis Esophagus 2016;29:48–53. [DOI] [PubMed] [Google Scholar]
- 5.Kinoshita Y, Furuta K, Ishimura N, et al. Elevated plasma cytokines in Japanese patients with eosinophilic esophagitis and gastroenteritis. Digestion 2012;86:238–243. [DOI] [PubMed] [Google Scholar]
- 6.Konikoff MR, Blanchard C, Kirby C, et al. Potential of blood eosinophils, eosinophil-derived neurotoxin, and eotaxin-3 as biomarkers of eosinophilic esophagitis. Clin Gastroenterol Hepatol 2006;4:1328–1336. [DOI] [PubMed] [Google Scholar]
- 7.Subbarao G, Rosenman MB, Ohnuki L, et al. Exploring potential noninvasive biomarkers in eosinophilic esophagitis in children. J Pediatr Gastroenterol Nutr 2011;53:651–658. [DOI] [PubMed] [Google Scholar]
- 8.Min SB, Nylund CM, Baker TP, et al. Longitudinal evaluation of noninvasive biomarkers for eosinophilic esophagitis. J Clin Gastroenterol 2017;51:127–135. [DOI] [PubMed] [Google Scholar]
- 9.Schlag C, Miehlke S, Heiseke A, et al. Peripheral blood eosinophils and other non-invasive biomarkers can monitor treatment response in eosinophilic oesophagitis. Aliment Pharmacol Ther 2015;42:1122–1130. [DOI] [PubMed] [Google Scholar]
- 10.Schwartz JT, Morris DW, Collins MH, et al. Eosinophil progenitor levels correlate with tissue pathology in pediatric eosinophilic esophagitis. J Allergy Clin Immunol 2019;143:1221–1224 e3. [DOI] [PMC free article] [PubMed] [Google Scholar]
- 11.Henderson A, Magier A, Schwartz JT, et al. Monitoring eosinophilic esophagitis disease activity with blood eosinophil progenitor levels. J Pediatr Gastroenterol Nutr 2020;70:482–488. [DOI] [PMC free article] [PubMed] [Google Scholar]
- 12.Johansson MW, McKernan EM, Fichtinger PS, et al. alphaIIb-Integrin (CD41) associated with blood eosinophils is a potential biomarker for disease activity in eosinophilic esophagitis. J Allergy Clin Immunol 2020;145:1699–1701. [DOI] [PMC free article] [PubMed] [Google Scholar]
- 13.Chang JY, Cheon JH. Fecal immunochemical test and fecal calprotectin measurement are noninvasive monitoring tools for predicting endoscopic activity in patients with ulcerative colitis. Gut Liv 2018;12:117–118. [DOI] [PMC free article] [PubMed] [Google Scholar]
- 14.Mak WY, Buisson A, Andersen MJ Jr, et al. Fecal calprotectin in assessing endoscopic and histological remission in patients with ulcerative colitis. Dig Dis Sci 2018;63:1294–1301. [DOI] [PubMed] [Google Scholar]
- 15.Ishihara S, Shoda T, Ishimura N, et al. Serum biomarkers for the diagnosis of eosinophilic esophagitis and eosinophilic gastroenteritis. Intern Med 2017;56:2819–2825. [DOI] [PMC free article] [PubMed] [Google Scholar]
- 16.Dellon ES, Rusin S, Gebhart JH, et al. A clinical prediction tool identifies cases of eosinophilic esophagitis without endoscopic biopsy: a prospective study. Am J Gastroenterol 2015;110:1347–1354. [DOI] [PMC free article] [PubMed] [Google Scholar]
- 17.Dellon ES, Rusin S, Gebhart JH, et al. Utility of a noninvasive serum biomarker panel for diagnosis and monitoring of eosinophilic esophagitis: a prospective study. Am J Gastroenterol 2015;110:821–827. [DOI] [PMC free article] [PubMed] [Google Scholar]
- 18.Grozdanovic MM, Doyle CB, Liu L, et al. Charcot-Leyden crystal protein/galectin-10 interacts with cationic ribonucleases and is required for eosinophil granulogenesis. J Allergy Clin Immunol 2020;146(2):377–389.e10. [DOI] [PMC free article] [PubMed] [Google Scholar]
- 19.Nyenhuis SM, Alumkal P, Du J, et al. Charcot-Leyden crystal protein/galectin-10 is a surrogate biomarker of eosinophilic airway inflammation in asthma. Biomark Med 2019;13:715–724. [DOI] [PMC free article] [PubMed] [Google Scholar]
- 20.Makiya MA, Herrick JA, Khoury P, et al. Development of a suspension array assay in multiplex for the simultaneous measurement of serum levels of four eosinophil granule proteins. J Immunol Methods 2014;411:11–22. [DOI] [PMC free article] [PubMed] [Google Scholar]
- 21.Sallis BF, Erkert L, Monino-Romero S, et al. An algorithm for the classification of mRNA patterns in eosinophilic esophagitis: Integration of machine learning. J Allergy Clin Immunol 2018;141(4):1354–1364.e9. [DOI] [PMC free article] [PubMed] [Google Scholar]
- 22.Wassom DL, Loegering DA, Solley GO, et al. Elevated serum levels of the eosinophil granule major basic protein in patients with eosinophilia. J Clin Invest 1981;67:651–661. [DOI] [PMC free article] [PubMed] [Google Scholar]
- 23.Cunnion KM, Willis LK, Minto HB, et al. Eosinophil Quantitated Urine Kinetic: A novel assay for assessment of eosinophilic esophagitis. Ann Allergy Asthma Immunol 2016;116:435–439. [DOI] [PubMed] [Google Scholar]
- 24.Lexmond WS, Pardo M, Rooney K, et al. Elevated levels of leukotriene C4 synthase mRNA distinguish a subpopulation of eosinophilic oesophagitis patients. Clin Exp Allergy 2013;43:902–913. [DOI] [PMC free article] [PubMed] [Google Scholar]
- 25.Yabluchanskiy A, Ma Y, Iyer RP, et al. Matrix metalloproteinase-9: Many shades of function in cardiovascular disease. Physiology (Bethesda) 2013;28:391–403. [DOI] [PMC free article] [PubMed] [Google Scholar]
- 26.Rittling SR, Singh R. Osteopontin in immune-mediated diseases. J Dent Res 2015;94:1638–1645. [DOI] [PMC free article] [PubMed] [Google Scholar]
- 27.Collins MH, Martin LJ, Alexander ES, et al. Newly developed and validated eosinophilic esophagitis histology scoring system and evidence that it outperforms peak eosinophil count for disease diagnosis and monitoring. Dis Esophagus 2017;30:1–8. [DOI] [PMC free article] [PubMed] [Google Scholar]
- 28.Bolton SM, Kagalwalla AF, Wechsler JB. Eosinophilic esophagitis in children: endoscopic findings at diagnosis and post-intervention. Curr Gastroenterol Rep 2018;20:4. [DOI] [PMC free article] [PubMed] [Google Scholar]
- 29.Wechsler JB, Bolton SM, Amsden K, et al. Eosinophilic esophagitis reference score accurately identifies disease activity and treatment effects in children. Clin Gastroenterol Hepatol 2018;16:1056–1063. [DOI] [PMC free article] [PubMed] [Google Scholar]
Associated Data
This section collects any data citations, data availability statements, or supplementary materials included in this article.