

SUMMARY
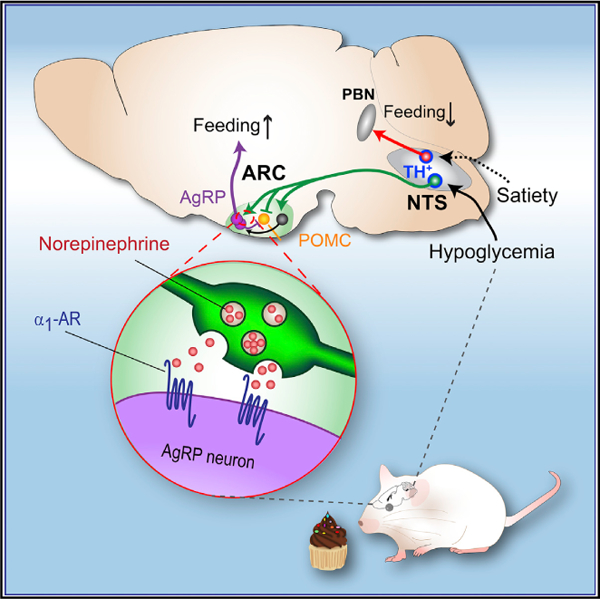
Glucose is the essential energy source for the brain, whose deficit, triggered by energy deprivation or therapeutic agents, can be fatal. Increased appetite is the key behavioral defense against hypoglycemia; however, the central pathways involved are not well understood. Here, we describe a glucoprivic feeding pathway by tyrosine hydroxylase (TH)-expressing neurons from nucleus of solitary tract (NTS), which project densely to the hypothalamus and elicit feeding through bidirectional adrenergic modulation of agouti-related peptide (AgRP)- and proopiomelanocortin (POMC)-expressing neurons. Acute chemogenetic inhibition of arcuate nucleus (ARC)-projecting NTSTH neurons or their target, AgRP neurons, impaired glucoprivic feeding induced by 2-Deoxy-D-glucose (2DG) injection. Neuroanatomical tracing results suggested that ARC-projecting orexigenic NTSTH neurons are largely distinct from neighboring catecholamine neurons projecting to parabrachial nucleus (PBN) that promotes satiety. Collectively, we describe a circuit organization in which an ascending pathway from brainstem stimulates appetite through key hunger neurons in the hypothalamus in response to hypoglycemia.
Graphical Abstract
In Brief
Increased appetite is a key line of defense against hypoglycemia. Aklan et al. have identified an ascending pathway from the brainstem to the hypothalamus that is required for hypoglycemia-induced food intake.
INTRODUCTION
Effective integration of peripheral signals is likely to require close coordination between brainstem and hypothalamus. A number of recent studies have started to elucidate rules of communication between these two key regions in terms of behavioral function and the cell types involved (Blevins et al., 2004; D’Agostino et al., 2016; Liu et al., 2017). However, there are still significant knowledge gaps. For example, most of the described appetite-relevant brainstem efferents are anorexigenic. Indeed, very few orexigenic signals, both hormonal and neuronal, are known to arrive at the hypothalamus in general (Duerrschmid et al., 2017; Grosse et al., 2014; Nakazato et al., 2001). For arcuate nucleus (ARC) in particular, the extrahypothalamic signals for energy regulation are even less understood. On the other hand, presence of such direct or indirect inputs that modulate activity of hunger-sensitive neurons is evident based on in vivo and ex vivo studies, which show rapid changes in activity with external food-related cues and internal gut-derived signals (Betley et al., 2015; Liu et al., 2012; Mandelblat-Cerf et al., 2015; Su et al., 2017; Yang et al., 2011).
Intrahypothalamic microinjections of pharmacological agents have identified multiple molecules that can elicit food intake. Among those, neuropeptide Y (NPY) and norepinephrine (NE) are particularly notable for their rapid and robust effect on feeding (Stanley and Leibowitz, 1985). While the NPY-activated pathway has been extensively studied, relatively little is known about the mechanisms and physiological contexts of norepinephrine-dependent appetite regulation. Within the ARC, NE has been shown to modulate the activity of AgRP and proopiomelanocortin (POMC) neurons (Paeger et al., 2017). In addition, ablation of ARC-projecting catecholaminergic neurons by saporin-conjugated anti-dbh (D-SAP) injections alters AgRP and NPY levels and impairs glucoprivic or ghrelin-induced feeding (Date et al., 2006; Fraley and Ritter, 2003). These studies suggest catechol-aminergic modulation of ARC feeding circuits; however, the source of input and their precise role in behavioral response are not well understood. Here, we identified that nucleus of solitary tract (NTS) tyrosine hydroxylase (TH)-expressing neurons make robust projections to the hypothalamus, and their activity regulates glucoprivic feeding, in part, through adrenergic modulation of AgRP and POMC neurons.
RESULTS
Mediobasal Hypothalamus Receives Robust Catecholaminergic Input from the NTS
Based on the effect of intrahypothalamic norepinephrine micro-injections and D-SAP lesions on feeding (Fraley and Ritter, 2003; Leibowitz, 1978; Wellman, 2000), we first aimed to determine the main source of catecholaminergic input to this region. Earlier neuroanatomical studies have implicated several hindbrain areas for providing catecholaminergic projections to forebrain. Among those, predominantly locus coeruleus (LC) and NTS, along with several other nuclei, give rise to ascending dorsal and ventral noradrenergic bundles, respectively, which travel rostrally to provide inputs to the hypothalamus. Since A2/C2 neurons of the NTS have been extensively examined for their hypothalamic projections, we focused on this region (Ricardo and Koh, 1978; Rinaman, 2010, 2011; Sawchenko and Swanson, 1981, 1982a, 1982b; Ter Horst et al., 1989). To validate whether the NTS is a significant upstream source of catecholaminergic fibers, we anterogradely labeled NTSTH axons in transgenic mice expressing cre-recombinase in TH+ neurons using cre-dependent rAAV2-CAG-FLEX-tdTomato virus and imaged axonal projections. Transduction of NTSTH neurons resulted in robust axonal labeling in the ARC, where the first order feeding regulatory neurons are located, as well as in several other hypothalamic structures (Figures 1A–1C). Arborization was present across the rostro-caudal axis. In the anterior coronal sections, axons covered the entire ARC, whereas in the most posterior sections, innervation was concentrated laterally (Figure 1D).
Figure 1. Medial Hypothalamus Receives Robust Input from NTSTH Neurons.
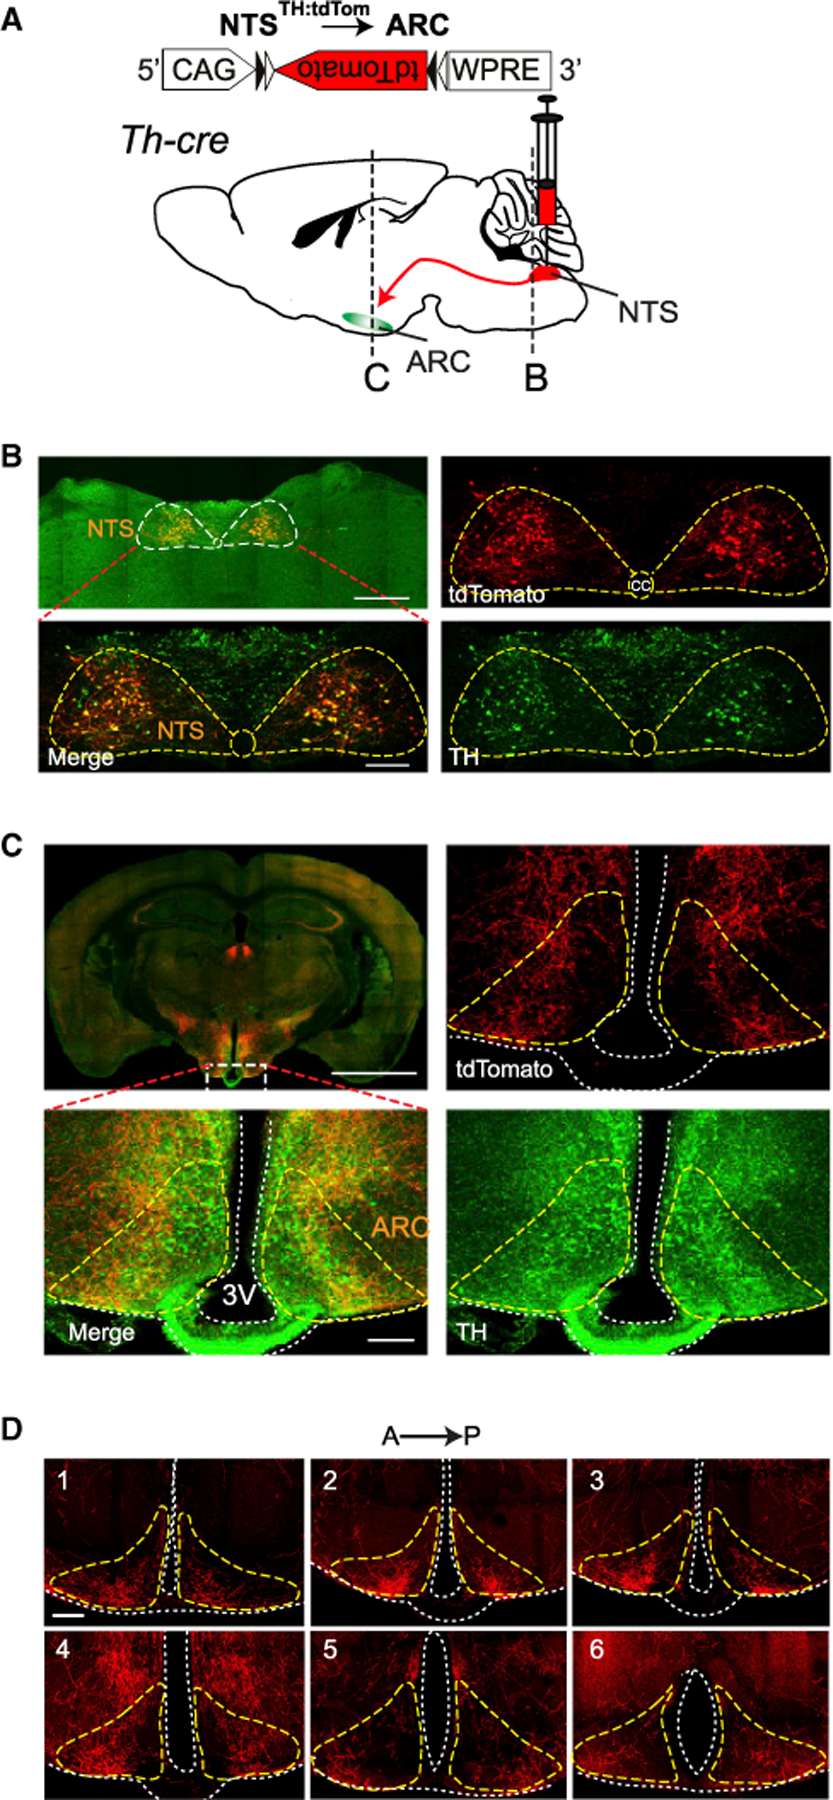
(A) Anterograde labeling of NTSTH axons in Th-cre mice with tdTomato.
(B) Representative images of transduced TH neurons in NTS (outlined by dashed line) expressing tdTomato (red) and immunolabeled for TH (green). Scale bars: 500 and 100 µm.
(C) TdTomato-expressing NTSTH neuron axons in ARC (outlined by dashed lines) immunolabeled for TH (green). Scale bars: 2 mm and 100 µm.
(D)TdTomato-expressing NTSTH neuron axons in coronal ARC sections (outlined by dashed lines) across the rostro-caudal axis. Scale bar: 100 µm.
NTSTH neurons are involved in a number of physiological functions and project to several brain regions (Rinaman, 2011). To estimate the fraction projecting to the ARC, we injected fluorescent retrobeads into the ARC, where they were taken up by axon terminals and retrogradely transported back to the neuronal soma in the NTS. Immunolabeling of brain slices from these mice using anti-TH antibody revealed that nearly a fifth of all NTSTH neurons (19%) were retrogradely labeled from ARC. However, not all ARC-projecting NTS neurons were TH+; indeed, 40% of the retrogradely labeled neurons were negative for TH staining (Figures S1A–S1C). These results suggest that NTS is a major source of catecholaminergic input for ARC.
Activation of NTSTH → ARC Fibers Promote Food Intake
Because of the dense projections by NTSTH neurons to the ARC and the known role of NTS as a relay hub of nutritional-state-related visceral information, we next asked whether NTSTH → ARC fibers convey signals that might influence energy homeo-stasis. To address this, we used optogenetics to selectively activate NTSTH fibers over the ARC. We injected cre-dependent rAAV2-EF1a-FLEX-ChR2-eYFP virus into the NTS region of mice expressing cre-recombinase in TH+ neurons and placed an optical fiber over the ARC (Figure 2A). Surprisingly, photostimulation of NTSTH → ARC axons in ad libitum-fed mice during the day induced a robust increase in food consumption (Figures 2B and 2C). Similarly, photoactivation in the early dark period, during which mice typically eat more, also caused a further increase in food intake (Figure S2A). The amount of consumed food was proportional to the efficiency of ChR2 transduction of NTSTH neurons and stimulation frequency, which saturated at 10 Hz (Figures 2D–2F). Evaluation of evoked feeding pattern revealed that both meal frequency and meal size were increased during the day and meal frequency during dark onset photostimulation (Figures 2G–2I, S2B, and S2C).
Figure 2. NTSTH Projections to ARC Stimulate Appetite.
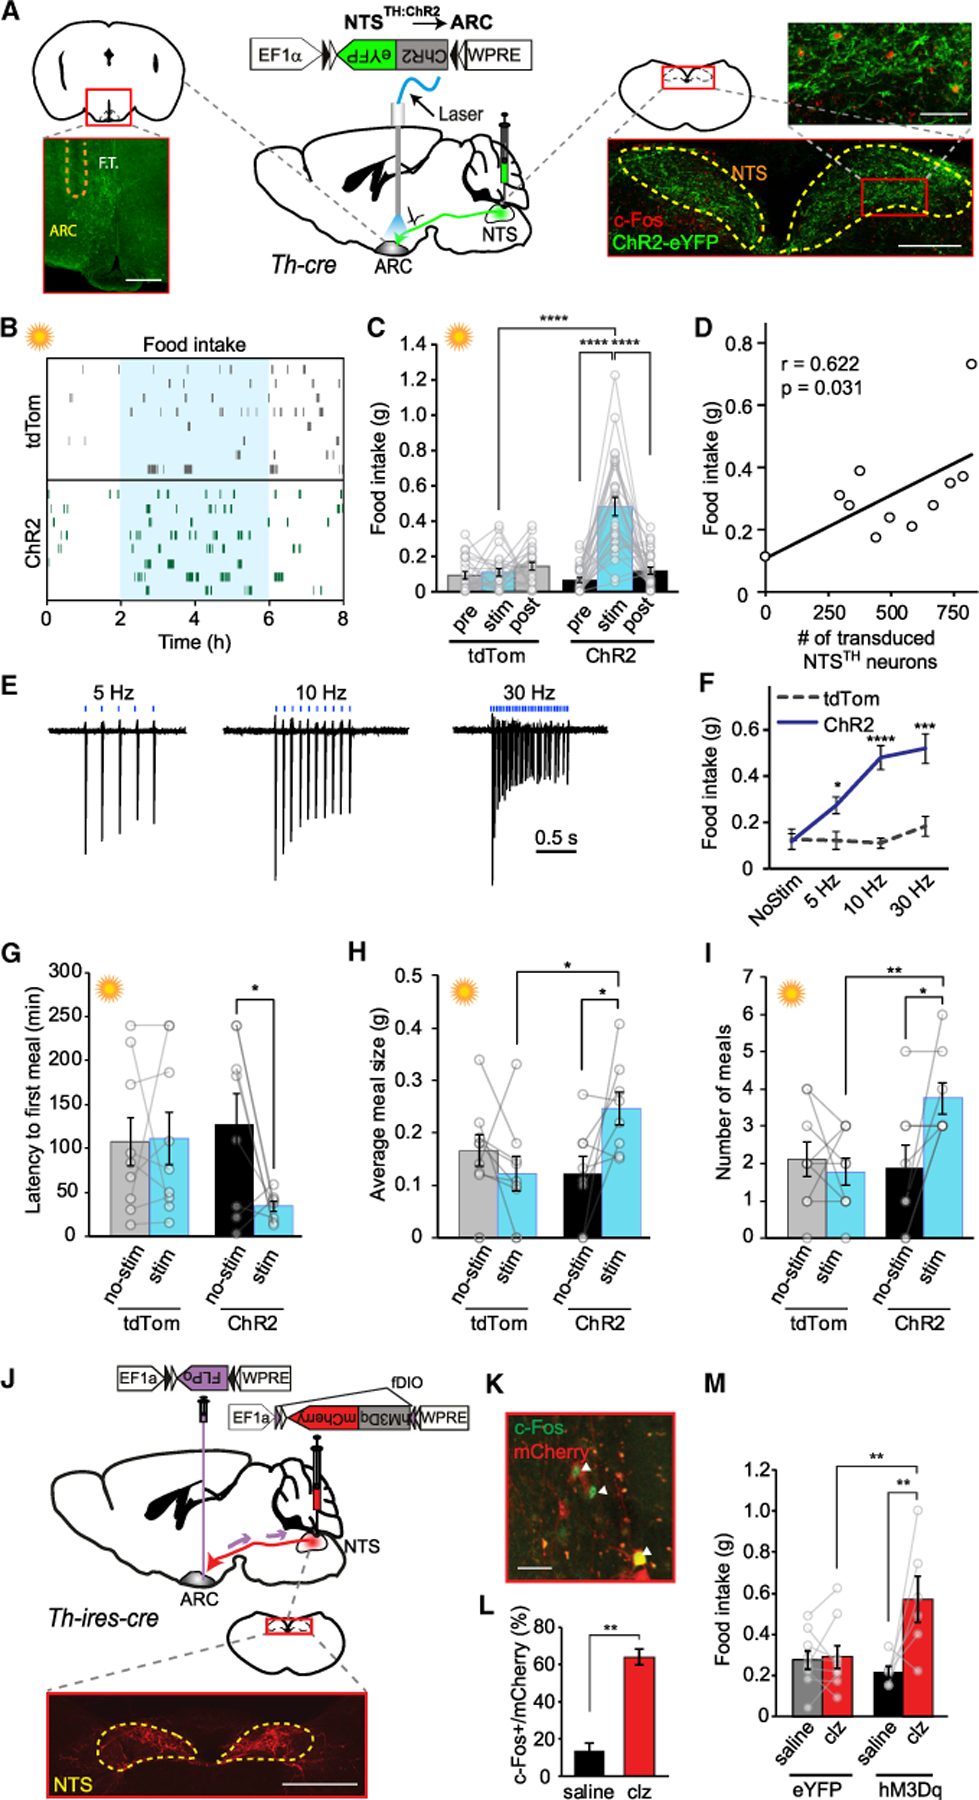
(A) ChR2 expression in NTSTH neurons of Th-cre mice. Left: Schematic and representative photomicrograph showing ARC, innervated by NTSTH:ChR2 axons and implanted with optical fiber tract (F.T., outlined by dashed line). Scale bar: 200 µm. Middle: Schematic of ChR2 viral transduction and optical fiber placement. Right: Schematic and representative photomicrographs showing transduced TH neurons expressing ChR2 (green) and c-Fos expression in a subset of neurons (red) in NTS (outlined by dashed line). Scale bars: 200 and 50 µm.
(B) Raster plot of feeding patterns generated by NTSTH:ChR2 → ARC and NTSTH:tdTom → ARC axonal photostimulation of ad libitum-fed mice during day. Each row represents an individual mouse, and each tick mark represents a single food pellet consumed, and blue shade represents the stimulation time.
(C) Daytime food intake in response to NTSTH:ChR2 → ARC and NTSTH:tdTom → ARC axonal stimulation of ad libitum-fed mice. Each bar represents 2 h of food intake (n = 23 tdTomato mice; n = 28 ChR2 mice; two-way RM ANOVA; interaction: F(2,98) = 27.82; p < 0.0001; Sidak’s corrected p value).
(D) Counts of ChR2 transduced NTSTH neurons (eYFP+ somata) versus light cycle food consumption in response to axonal photostimulation over the ARC in ad libitum-fed mice (Pearson correlation; n = 11 mice).
(E and F) Representative traces of loose seal recordings from ChR2-expresing NTSTH neurons photostimulated at various frequencies with 1 ms light pulses (E). Summary graph (F) of food intake in response to NTSTH:ChR2 → ARC and NTSTH:tdTom → ARC axonal stimulation of ad libitum-fed mice in 5, 10, and 30 Hz stimulation (n = 10 tdTomato; n = 15 ChR2 mice; two-way RM ANOVA; interaction: F(3,69) = 7.746; p = 0.0002; Sidak’s corrected p value).
(G–I) Impact of NTSTH:ChR2 → ARC or NTSTH:tdTom → ARC axonal stimulation on meal pattern of ad libitum-fed mice: latency to first meal (G; p = 0.0379; Sidak’s multiple comparison test), average meal size (H; two-way RM ANOVA; interaction: F(1,15) = 7.336; p = 0.0162), and total number of meals (I; two-way RM ANOVA; interaction: F(1,15) = 7.580; p = 0.0148). Each bar represents feeding data (4 h) on non-stimulated days (gray or black bars) or stimulated days (blue bars) on the same time period of light cycle (n = 9 tdTomato mice; n = 8 ChR2 mice; Sidak’s corrected p values).
(J) Top: Viral transduction strategy for hM3Dq-mCherry expression in ARC-projecting NTSTH neurons Bottom: Photomicrographs showing transduced TH neurons expressing hM3Dq (red). Yellow dashed outline: NTS. Scale bar: 500 µm.
(K and L) Photomicrograph (K) and quantification of c-Fos expression (L) in hM3Dq-mCherry-transduced neurons in NTS (n = 3 saline treated; n = 3 clozapine [clz, 0.3 mg/kg] treated mice; Student’s t test p = 0.0044). Scale bar: 50 µm.
(M) Chemogenetic activation of ARC-projecting NTSTH neurons. Each bar represents feeding data (4 h) stimulated by saline versus clozapine (clz: 0.3 mg/kg; n = 9 tdTomato; n = 6 hM3Dq mice; two-way RM ANOVA; interaction: F(1,13) = 7.653; p = 0.0160; Sidak’s corrected p value).
Data are expressed as mean ± SEM. *p < 0.05, **p < 0.01, ***p < 0.001, and ****p < 0.0001.
We also monitored additional behavioral parameters to test the specificity of the food intake response. There was no significant change in grooming, while nesting behavior was slightly increased. In addition, water consumption was significantly increased, but this typically followed eating bouts, suggesting that it is likely related to postprandial thirst (Figures S2D–S2H). Finally, we evaluated the valence and anxiogenic capacity of this pathway by measuring several behavioral responses to NTSTH → ARC axon photostimulation. Open-field, elevated plus maze, and active place preference assays showed no significant change in activity of mice, indicating that this pathway may not play a major role in reward and anxiety behaviors (Figure S3). Together, these results show that NTSTH → ARC fibers specifically convey orexigenic signals.
Although all stimulation frequencies we tested resulted in feeding, physiologically relevant activity pattern of ARC-projecting NTSTH neurons is not known. Thus, we sought to verify behavioral results using an alternative neuronal activation approach. For this, we applied chemogenetic activation with DREADDs (designer receptors exclusively activated by designer drugs), which relies on a modified muscarinic receptor, hM3Dq, and mimics GPCR-induced activation pattern (Alexander et al., 2009; Atasoy and Sternson, 2018). To selectively stimulate ARC-projecting NTSTH neurons, we used an intersectional approach by first injecting retroAAV-EF1a-DIO-FLPo virus into the ARC of Th-ires-cre mice, which was transported back to NTS neurons and drove FLP-recombinase expression in a cre-dependent manner. A second virus, rAAV2-EF1a-fDIO-hM3Dq-mCherry, which expresses hM3Dq in a FLP-recombinase-dependent manner, was stereotaxically targeted to NTS (Figures 2J–2L). Consistent with the optogenetic activation of NTSTH:ChR2 → ARC axons, selective chemogenetic activation of NTSTH:hM3Dq → ARC neurons by intraperitoneal (i.p.) delivery of low dose clozapine ligand resulted in rapid feeding response in ad libitum-fed mice during daytime (Figure 2M).
To further verify ARC as a functionally pertinent downstream site of action as opposed to activation of NTSTH collaterals in other regions, we directly activated NTSTH terminals in the ARC using DREADDs. For this, we expressed rAAV2-EF1a-DIO-hM3Dq-mCherry in NTSTH neurons and placed a cannula over the ARC (Figure S4A). Local delivery of the Clozapine-N-Oxide ligand (CNO) into the ARC caused significant increase in food intake in ad libitum-fed mice, suggesting that local activation of NTSTH axons in this region underlies the observed feeding effect (Figure S4B). Although we cannot completely rule out the possibility that axonal hM3Dq activation might drive action potential generation, existing literature suggest direct enhancement of vesicle release by Gq-coupled G protein-coupled recep tors (GPCRs) (Betke et al., 2012).
Collectively, these experiments suggest that NTSTH → ARC projection carries orexigenic signals. This is a surprising result, since all other NTS cell types that have been linked to appetite regulation (i.e., POMC, GLP1, CCK, DBH, 5HT2C, and GDF15-expressing neurons) were reported to be anorexigenic (Blouet and Schwartz, 2012; D’Agostino et al., 2016, 2018; Hsu et al., 2017; Liu et al., 2017; Roman et al., 2016; Zhan et al., 2013). It is notable that even NTSDBH neurons, a population with substantial overlap with NTSTH neurons, were previously shown to be suppressing food intake (Roman et al., 2016).
Inhibition of ARC-Projecting NTSTH Neurons Impairs Glucoprivic Hunger
To examine the physiological context in which NTSTH → ARC projection operates, we chemogenetically inhibited this pathway during behavior. For this, we used an intersectional approach to express hM4Di silencer in retro-labeled NTSTH neurons. First, retro AAV-EF1α-DIO-FLPo virus was injected into the ARC of Th-ires-cre mice. As described above, this approach would selectively mark ARC-projecting NTSTH neurons with FLP-recombinase expression. Injection of a second virus, rAAV2-EF1α-fDIO-hM4Di-mCherry, into the NTS, which expresses hM4Di in FLP-recombinase-dependent manner, allowed selective expression only in ARC-projecting NTSTH subpopulation (Figures 3A–3C). Silencing of ARC-projecting NTSTH neurons with i.p.-delivered clozapine did not cause significant decrease in refeeding response of food-deprived mice (Figure 3D). Likewise, microinjection of α1 and α2 adrenergic receptor (AR)-blocker cocktail (prazosin [PRA] + yohimbine [YOH]) into the ARC of food-deprived mice did not cause significant change in refeeding response (1 h feeding PBS: 0.612 ± 0.0398; PRA + YOH: 0.606 ± 0.0448; paired t test: p = 0.988). These results suggest that this pathway might be dispensable for deprivation-induced hunger.
Figure 3. Inhibition of ARC-Projecting NTSTH Neurons Impairs Glucoprivic Hunger.
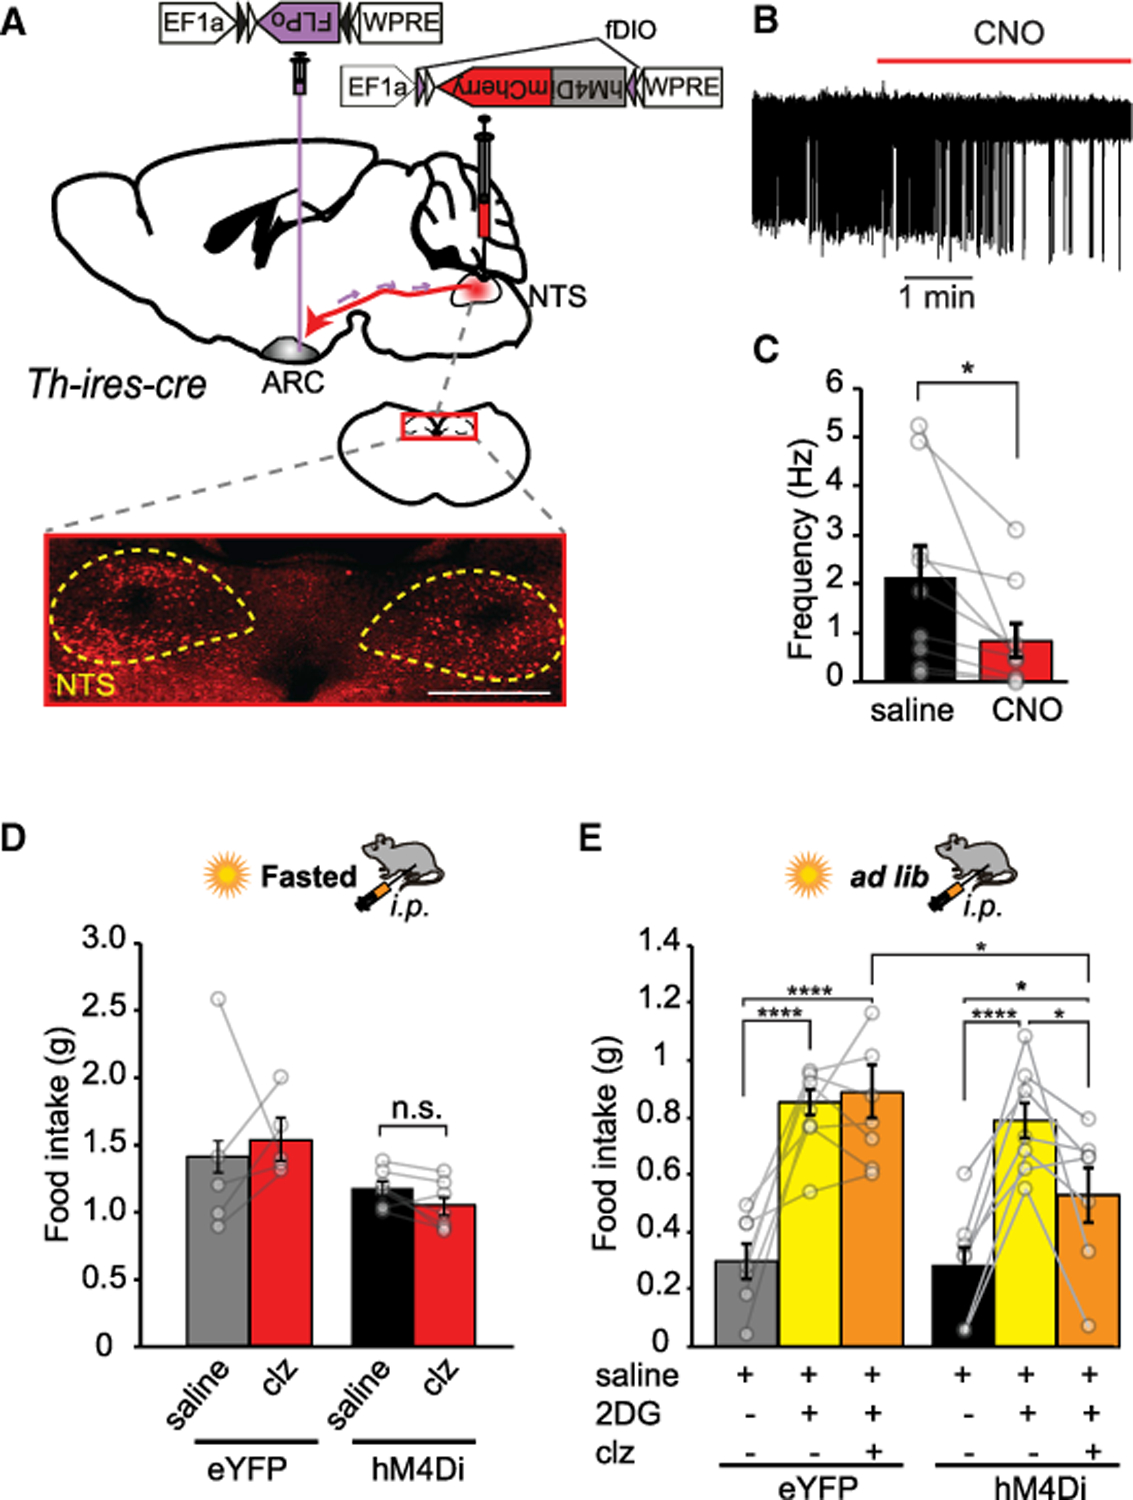
(A) Top: Intersectional viral transduction strategy for hM4Di-mCherry expression in ARC-projecting NTSTH neurons. Bottom: Representative photomicrographs showing transduced TH neurons expressing hM4Di (red). Yellow dashed outline: NTS. Scale bar: 400 µm.
(B and C) CNO-dependent silencing of ARC-projecting NTSTH neurons. Representative trace (B) and summary graph showing firing rate before and after addition of CNO (C) (n = 9 cells; paired t test).
(D) Impact of silencing of ARC-projecting NTSTH neurons on deprivation-induced food intake (fasted for 18 h; n = 5 eYFP; n = 7 hM4Di mice; two-way RM ANOVA; interaction: F(1,10) = 0.8348; p = 0.3824; Tukey corrected p values).
(E) Impact of silencing of ARC-projecting NTSTH neurons on 2DG-induced food intake (n = 5 eYFP,; n = 7 hM4Di; two-way RM ANOVA; interaction: F(2,10) = 4.229; p = 0.0294).
Data are expressed as mean ± SEM. *p < 0.05 and ****p < 0.0001.
Previous D-SAP injection studies have shown that ablation of medial hypothalamus-projecting catechol-amine neurons impairs glucoprivic feeding (Fraley et al., 2002; Fraley and Ritter, 2003; Ritter et al., 2001). Several adrenergic populations were affected by these lesions, including dorsal medullary A2/C2 neurons located in the NTS. Thus, we next tested the contribution of NTSTH neu rons to glucoprivic feeding. Notably, chemogenetic inhibition of ARC-projecting NTSTH neurons significantly impaired glucoprivic feeding induced by 2DG injection (Figure 3E) suggesting that A2/C2 adrenergic population is a major contributor of hypoglycemic hunger.
NTSTH Axons Elicit Heterogeneous Response in the ARC
We next investigated the functional impact of NTSTH axons on ARC neuronal activity. To address this, we transduced NTSTH neurons with rAAV2-EF1α-FLEX-ChR2(H134R)-eYFP virus and performed loose-seal recordings from blindly targeted ARC neurons in acute brain slices while photostimulating the NTSTH → ARC axons (Figure 4A). Firing rate was not altered in the majority of the neurons, but a subset of neurons increased their activity (12%), while a small fraction was silenced (8%) (Figures 4B and 4C). For the activated ARC neurons (Figure 4D), we pharmacologically dissected the signaling mediators. Bath application of PRA, an a1 adrenergic receptor antagonist, completely or partially blocked light-induced increase in activity for most ARC neurons (six out of seven neurons). The residual photostimulation-dependent response was abolished by blockers of ionotropic glutamatergic antagonist cocktail CNQX and D-AP5 (Figures 4D and 4E). These results suggest that mainly adrenergic but also glutamatergic signaling molecules are used by NTSTH → ARC axon terminals.
Figure 4. NTSTH Axons Elicit Heterogeneous Response in ARC Neurons.
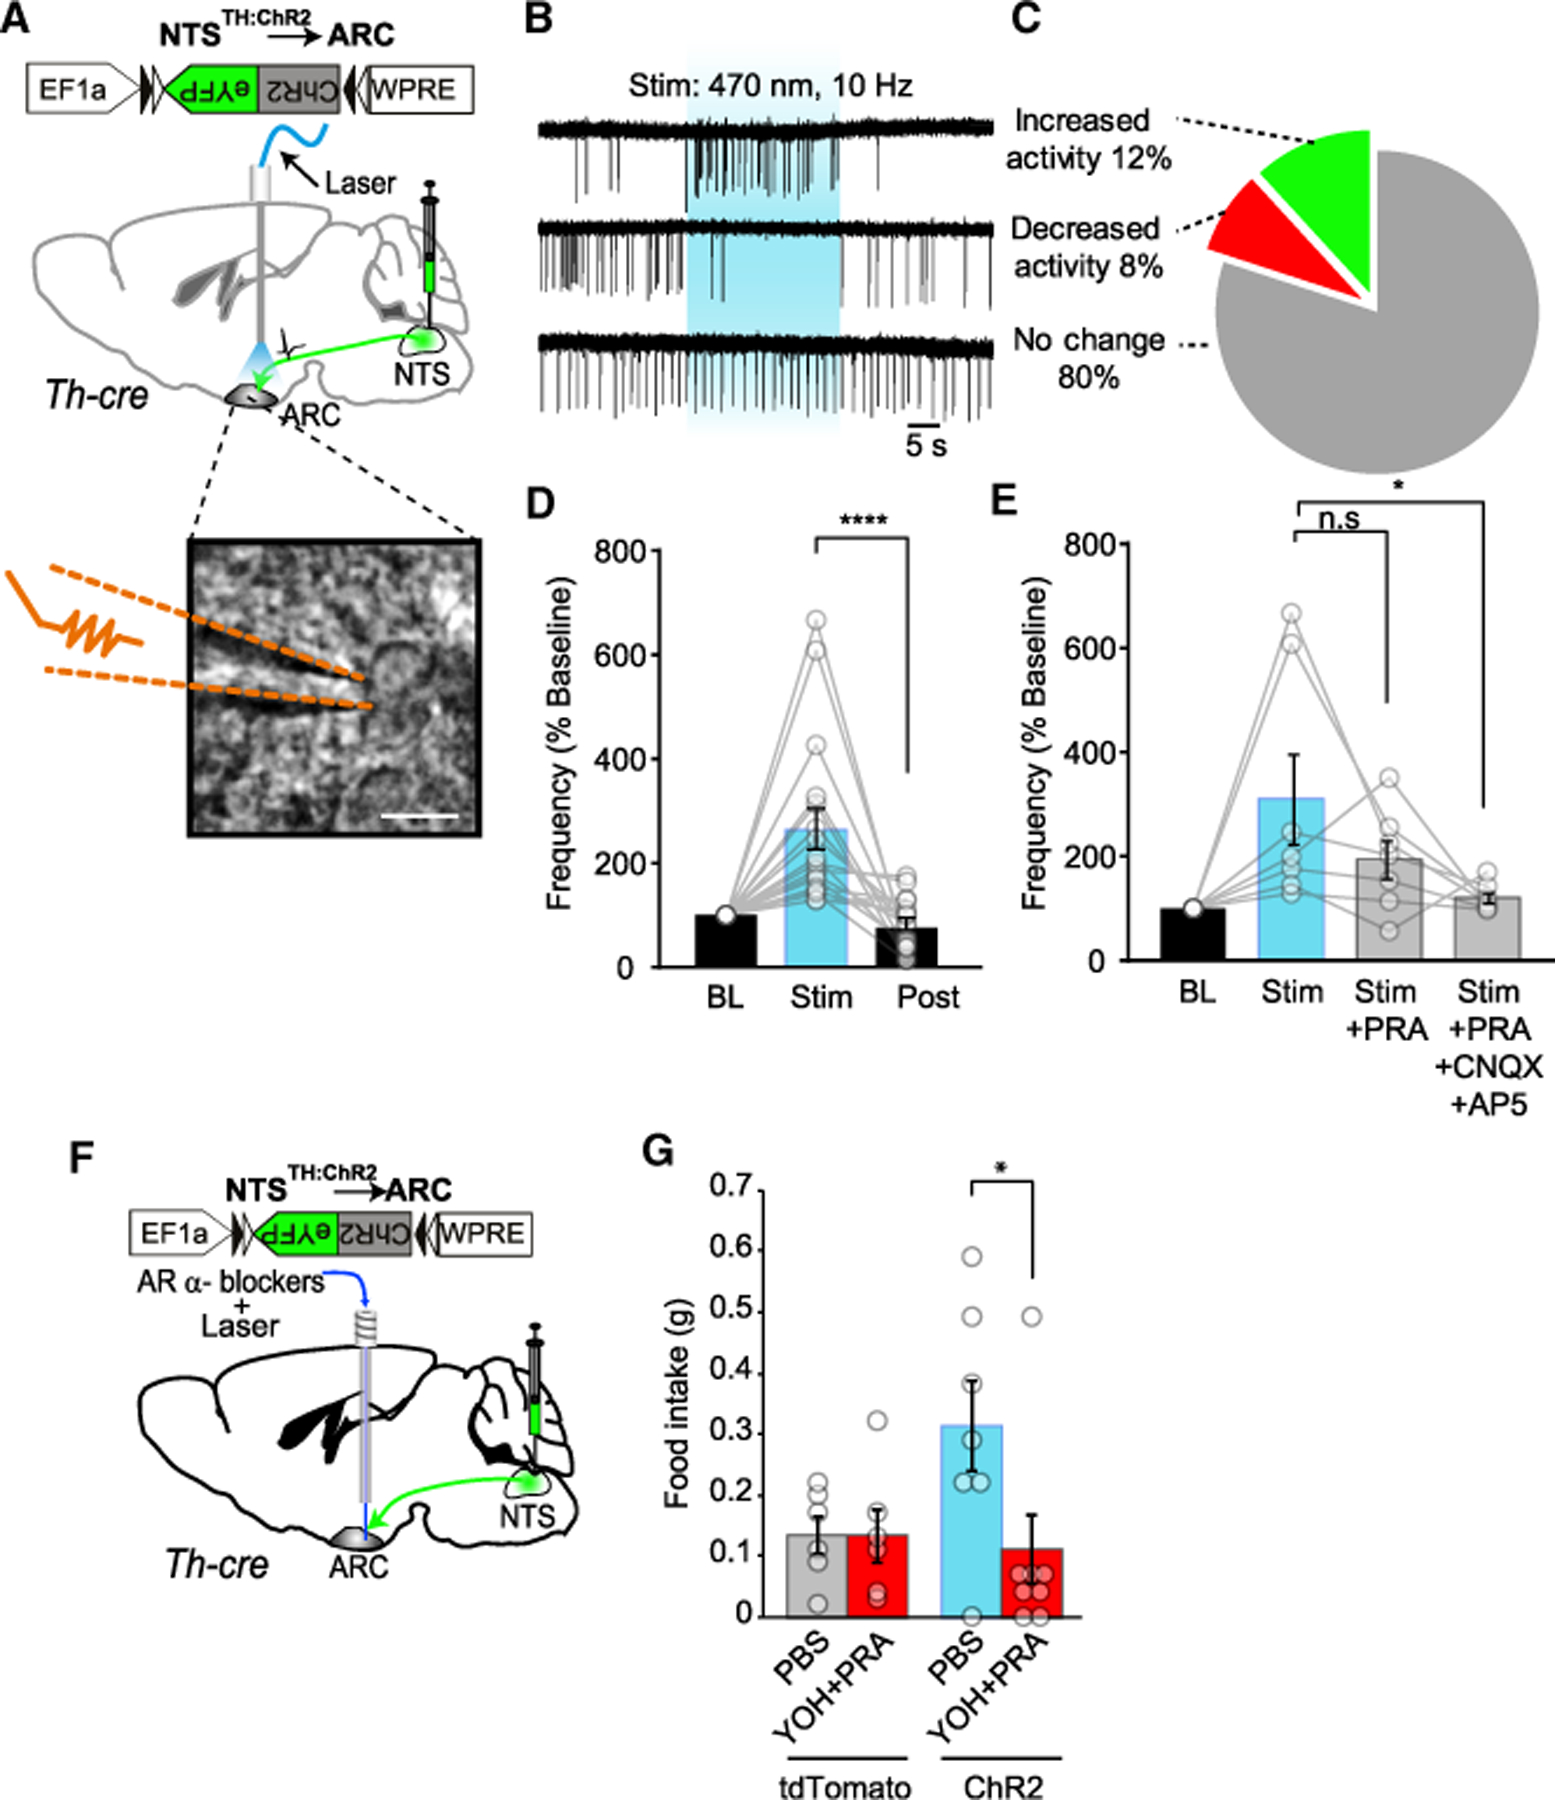
(A) ChR2 expression in NTSTH axons and their photostimulation in ARC-containing brain slices of Th-cre mice. Inset: representative image depicting loose seal recording from an ARC neuron; recording pipette highlighted with dashed lines. Scale bar: 15 µm.
(B and C) Representative loose seal recording traces (B) for various response patterns in action currents observed from randomly recorded ARC neurons upon stimulation of NTSTH:ChR2 → ARC axons. Blue shading represents the photostimulation period. Summary pie chart (C) depicting relative fraction of different responses in firing rates observed from recorded ARC neurons (n = 13 neurons increased activity; n = 9 neurons decreased activity; n = 88 neurons no change in activity; recorded from n = 14 mice).
(D) Impact of photo activation of NTSTH:ChR2 axons on a subset of ARC neurons that responded by increased firing rate. Each bar represents baseline-normalized firing frequency, and each circle represents an individual neuron (n = 17 neurons; RM ANOVA; treatment: F(2,32) = 16.18; p < 0.0001; Tukey’s corrected p values).
(E) Impact of α1 adrenergic receptor blocker (PRA) with or without ionotropic glutamatergic blockers (CNQX+AP5) on firing rate of a subset of ARC neurons that originally responded to the blue light with increased activity. Each bar represents the firing rate during 30 s stimulation normalized to the baseline spontaneous firing rate immediately prior to the stimulation in the same sweep, α1 adrenergic receptor blocker (Stim+PRA) and α1 adrenergic receptor blocker + glutamatergic blockers (Stim+PRA+CNQX+AP5). Each circle represents an individual neuron (n = 7 neurons; RM ANOVA; treatment: F(3,18) = 4.437; p = 0.0168; Tukey’s corrected p values).
(F) ChR2 expression in NTSTH neurons and cannula placement over the ARC for adrenergic receptor blocker delivery and optical fiber placement.
(G) Impact of local infusion of α1 and α2 adrenergic receptor blocker cocktail (PRA + YOH) or PBS, immediately followed by photostimulation of NTSTH:ChR2 → ARC axons in ad libitum-fed mice during light cycle (n = 6 PBS and blocker treated tdTomato mice; n = 7 PBS and n = 8 blocker treated ChR2 mice; 2 h food intake; unpaired t test).
Data are expressed as mean ± SEM. N.s., not significant; *p < 0.05; ****p < 0.0001.
These results are in agreement with a recent study reporting the expression of excitatory and inhibitory (α1 and α2, respectively) adrenergic receptors in feeding related ARC neurons (Paeger et al., 2017). To evaluate in vivo functional significance of adrenergic signaling in NTSTH → ARC-mediated feeding, we transduced NTS region of Th-cre mice with rAAV2-EF1α -FLEX-ChR2(H134R)-eYFP virus and placed a cannula over the ARC. We then microinjected a cocktail of blockers for ARs, PRA (α1) and YOH (α2), into the ARC prior to photostimulation of NTSTH → ARC axons with an optical fiber placed through the same cannula (Figure 4F). In agreement with in vitro electrophysiological recordings, pharmacologic inhibition of adrenergic signaling abolished the feeding behavior in response to photostimulation (Figure 4G). These results confirm the requirement for adrenergic signaling we observed in ex vivo recordings and further corroborated intracranial chemogenetic activation results, which showed that the site of action for appetite enhancement is likely due to release in the ARC, but not elsewhere.
NTSTH Axons Oppositely Regulate ARCAgRP and ARCPOMC Neuronal Activity
To determine the molecular identity of the cell types affected by NTSTH → ARC activation, we collected the intracellular contents of the recorded neurons into the patch pipette and performed single-cell real-time PCR analysis. Several molecularly defined cell types have been implicated in appetite regulation in ARC; among those, AgRP and POMC have been most extensively characterized (Aponte et al., 2011; Atasoy et al., 2012; Fenselau et al., 2017; Zhang and van den Pol, 2016). Furthermore, these cell types have also been shown to express adrenergic receptors (Paeger et al., 2017). Thus, we focused on evaluating the presence of these two transcripts in the collected neurons. Results of the real-time PCR analysis showed that the majority of the neurons that responded by increased activity upon NTSTH → ARC axon photostimulation were also positive for Agrp-transcript (67%), whereas only a small fraction expressed Pomc transcript (8%) (Figures 5A and 5B). Conversely, all of the neurons that reduced activity in response to photoactivation had Pomc transcripts, but none had detectable mRNA for Agrp (Figure 5C). These results show a clear dichotomy in the pattern by which distinct molecularly defined and appetite-relevant subpopulations of ARC neurons are inversely regulated by NTSTH input to promote positive energy balance.
Figure 5. NTSTH Input Regulates Glucoprivic Feeding through AgRP Neurons.
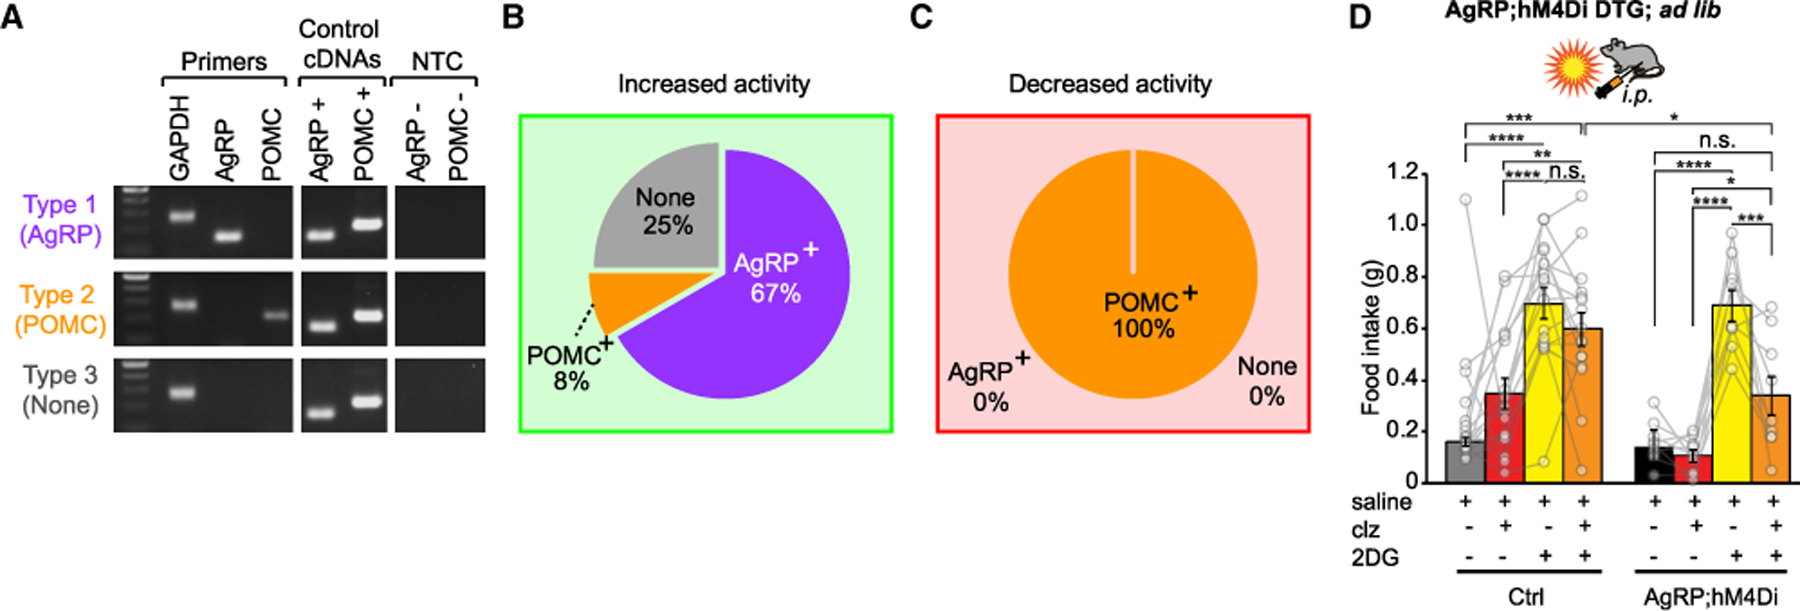
(A) Representative image of gel electrophoresis outcomes of real-time PCR for three different cell types (Type 1: Agrp+;Type 2: Pomc+; and Type 3: Agrp —: Pomc —). Reactions were performed on individual neurons that were collected after loose seal recordings. DNA ladder: 100–500 bp: Gapdh = 239 bp; Agrp = 146 bp; Pomc = 200 bp; NTC: No template control.
(B and C) Relative abundance of three different cell types among a subset of recorded neurons that were collected into the recording pipette. (B) Neurons that responded with increased firing rate were mostly AgRP positive (n = 8 AgRP+ neurons; n = 1 POMC+ neuron; total n = 12/110 neurons from n = 10 mice). (C) All of the neurons that responded to light by decreased activity were POMC+ and none were AgRP+ (n = 4/45 neurons from n = 3 mice).
(D) Impact of AgRP neuron inhibition on 2DG-induced food intake in AgRP;hM4Di double transgenic mice (n = 16 Ctrl littermate mice; n = 9 DTG mice; two-way RM ANOVA; treament: F(3,69) = 36.56; p < 0.0001; Tukey corrected p value).
Data are expressed as mean ± SEM. *p < 0.05, **p < 0.01, ***p < 0.001, and ****p < 0.0001.
AgRP Neuron Activity Is Required for Glucoprivic Feeding
The observations that ARC-projecting NTSTH neurons are required for glucoprivic feeding and AgRP neurons are their major target in the ARC suggest that AgRP neurons may contribute to hypoglycemic appetite. Involvement of AgRP neurons in glucoprivic feeding was previously ruled out on the basis of neonatal ablation studies (Luquet et al., 2007); nevertheless, we revisited their possible role using a rapid and reversible silencing approach. For this, we crossed the transgenic mice expressing hM4Di in a cre-dependent manner, R26-LSL-Gi-DREADD, with Agrp-irescre mice. The resulting Agrp-ires-cre;R26-LSL-Gi-DREADD double transgenic (AgRP;hM4Di DTG) offspring allowed us to acutely inhibit activity in the entire AgRP neuron population. This approach also eliminated the possibility of compensatory circuit reorganization that has been reported in previous studies in which AgRP neurons were neonatally ablated (Luquet et al., 2005). Interestingly, acute chemogenetic inhibition of AgRP neurons significantly reduced 2DG-induced food intake, suggesting that AgRP neurons are a major hub in the hypoglycemic hunger pathway (Figure 5D). However, compared with the ‘‘clz only’’ control group, ‘‘clz + 2DG’’ still elicited significant feeding response (Figure 5D), suggesting that either the hM4Di-based mechanism of AgRP inhibition was incomplete or functional redundancy exists in additional glucoprivation-activated targets.
Norepinephrine Directly Drives AgRP Neuron Activation
To better understand the circuit mechanism of interaction be tween NTSTH axons and AgRP neurons, we performed fluorescence-guided electrophysiological recordings. To achieve this, we generated double transgenic mice, Th-ires-cre;Npy-gfp, and transduced NTSTH neurons with rAAV9-CAG-FLEX-ChR2-mCherry virus by stereotaxic injection. This configuration allowed us to perform whole-cell recordings from GFP-labeled AgRP (NPY) neurons while activating NTSTH axons (Figure 6A). Since the majority of NTSTH neurons were reported to be glutamatergic (Stornetta et al., 2002), and loose seal recording suggested partial involvement of glutamate receptors (Figure 4E), we first tested the possibility of direct glutamatergic synaptic contact between NTSTH axons and AgRP neurons. Using optogenetic circuit mapping, we did not detect any evoked excitatory synaptic currents (eEPSCs) from AgRP neurons that were in synchrony with photostimulation of NTSTH axons, which would have indicated presence of direct synaptic contact (Figure 6B).
Figure 6. NE from NTSTH Axons Directly Excites AgRP Neurons.
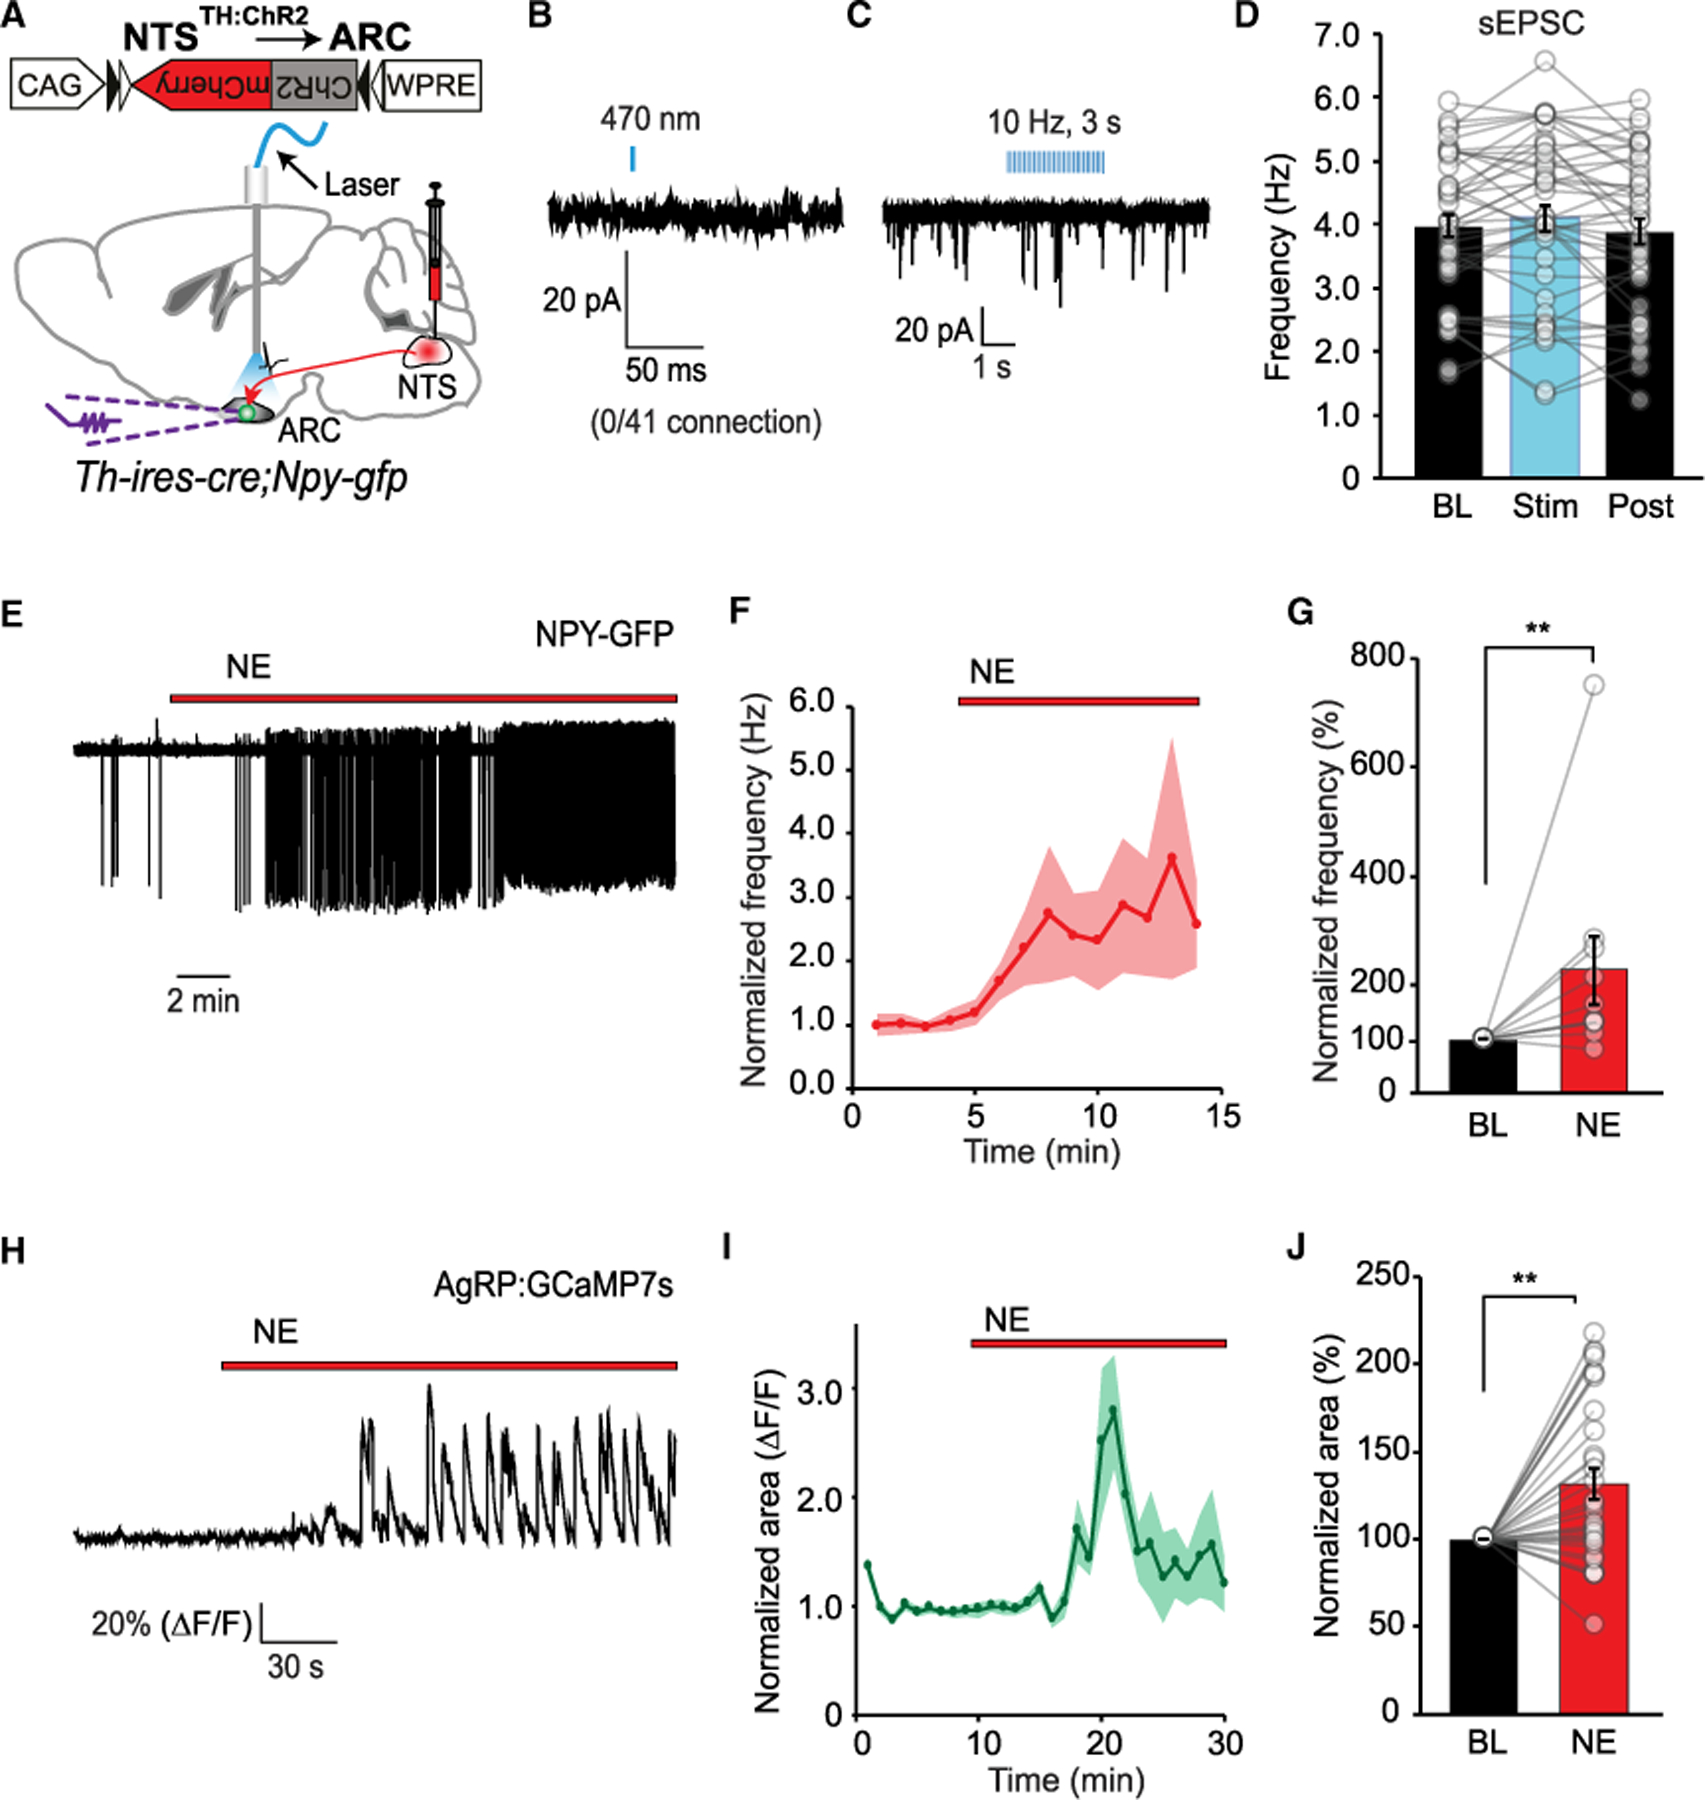
(A) ChR2 assisted interrogation of NTSTH → AgRP communication in Th-ires-cre;Npy-gfp mice.
(B–D) Representative traces of whole-cell voltage clamp recordings from ARC NPY neurons during NTSTH axonal photostimulation by single light pulse (B) or train pulse (C). Summary graph for the sEPSC frequency in ARC NPY neurons during NTSTH axonal photostimulation (D) (n = 41 cells; four mice).
(E–G) Representative loose seal traces (E) and summary graphs showing temporal change (F) and average (G) for frequency of action currents from NPY neurons in Npy-gfp mice before and after bath application of norepinephrine (NE, 10µM; BL: Baseline) in the presence of synaptic blockers (n = 10 cells; Wilcoxon signed rank test).
(H–J) Representative Ca2+-based fluorescence intensity traces (H) and summary graphs showing temporal change (I) and average (J) for normalized fluorescence (ΔF/F) from AgRP neurons in Agrp-ires-cre mice expressing GCaMP7s in response to bath application of NE (10µM) in the presence of synaptic blockers (n = 31 neurons; four mice; Wilcoxon signed rank test).
Data are expressed as mean ± SEM. **p < 0.01.
Activated NTSTH axons may release neuromodulators like NE, which, in turn, can activate nearby glutamatergic synapses onto the AgRP neurons, causing indirect excitation. If this were the case, NTSTH axonal stimulation would be expected to increase spontaneous glutamate release (sEPSC) onto the AgRP neurons. However, even prolonged repetitive photostimulation of NTSTH axons did not cause any significant change in the overall sEPSC frequency onto the AgRP neurons (Figures 6C and 6D). These results suggest that NTSTH neurons neither make direct glutamatergic synapse onto the AgRP neurons nor upregulate sEPSC from other terminals through adrenergic modulation. Indeed, we performed additional experiments and confirmed that even with bath application of NE at pharmacologic doses, excitatory drive onto AgRP neurons does not increase; on the contrary, sEPSC was mildly suppressed (Figures S5A–S5D). These results strongly suggest that NE signaling does not appear to stimulate AgRP neuron activity through synaptic modulation.
Taken together, these observations suggest that NTSTH-derived NE likely acts on AgRP neurons directly. To test this possibility, we monitored the impact of bath-applied NE on AgRP neuron activity in the presence of synaptic blockers. Both loose seal recordings and GCaMP-based activity imaging in brain slices showed that NE rapidly increased AgRP neuronal activity (Figures 6E–6J), consistent with an earlier report (Paeger et al., 2017), suggesting that NE action is mediated cell autonomously.
ARC-Projecting NTSTH Neurons Have Limited Overlap with PBN-Projecting NTSTH Neurons
With respect to feeding regulation, NTS has commonly been associated with satiety. This is also true for NTSDBH neurons, which overlap greatly with NTSTH neurons. Indeed, we confirmed the anorexigenic nature of global NTSTH activation. In contrast to the activation of the ARC-projecting subpopulation of NTSTH neurons, chemogenetic activation of the entire NTSTH population in mice drastically suppressed dark-onset feeding (Figure S4C). This is consistent with a previous study which determined the appetite suppressing subpopulation of NTSDBH neurons to be those projecting to parabrachial nucleus (PBN) (Roman et al., 2016).
The striking difference in behavioral impact of activating PBN-projecting versus ARC-projecting NTSTH neurons would imply presence of at least two distinct catecholamine neuron subpopulations. If this were the case, then a limited overlap between ARC- and PBN-projecting NTSTH neurons would be expected. This is because if there were substantial overlap, placing the stimulating optical fiber on either target location, PBN or ARC, would result in a comparable behavioral effect due to back-propagating action potentials. To evaluate this possibility, we made double injections of retrogradely transported fluorescent beads of different colors into the ARC and PBN in the same mice and visualized NTSTH neurons by immunostaining for TH antigen. As anticipated, our analysis of colocalization patterns showed that the retrograde labeling of NTSTH → ARC and NTSTH → PBN projections marked largely distinct subpopulations with limited overlap (15% were double-bead-labeled out of all bead-labeled TH+ neurons) (Figures 7A–7D). It must be noted that since not all terminals were probably labeled by retrograde beads, this percentage is likely an underestimation.
Figure 7. ARC-Projecting NTSTH Neurons Are a Distinct Subpopulation.
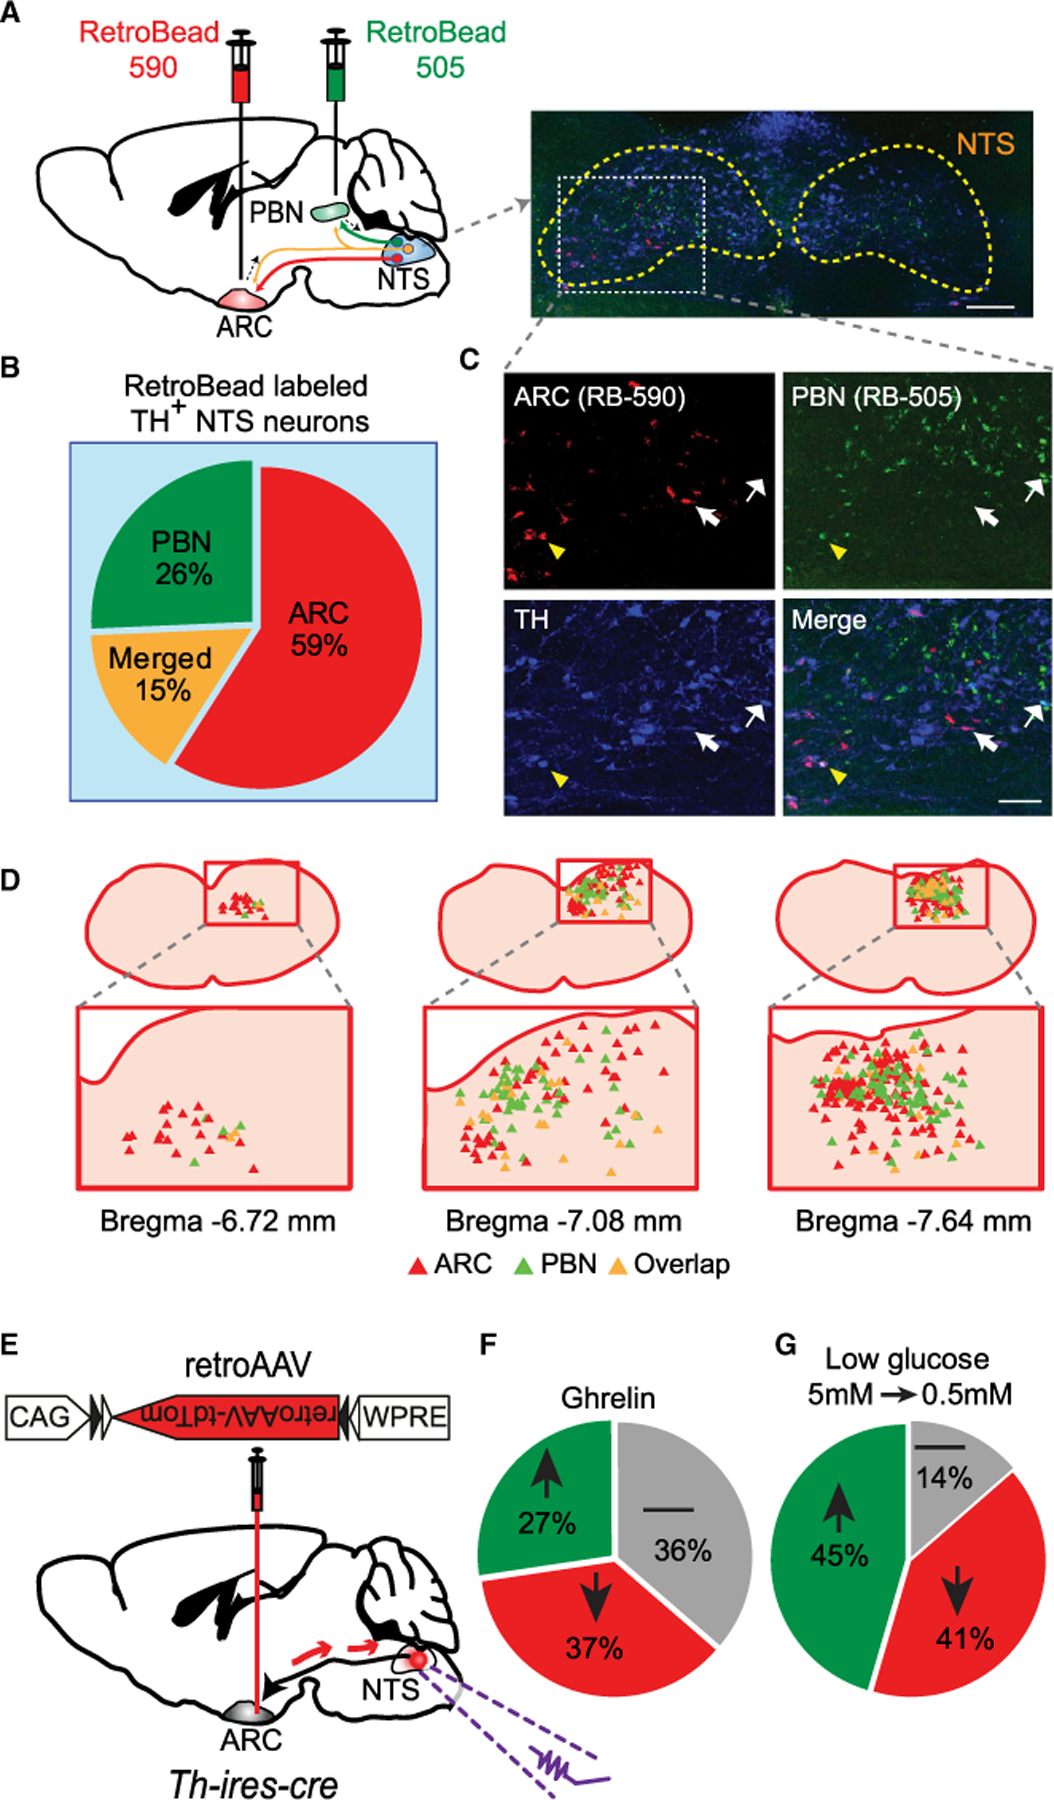
(A) Schematic diagram and representative image depicting retrograde labeling of NTSTH neurons (blue, TH staining) using red (from ARC) and green (from PBN) fluorescent retrobeads. Scale bar: 100 µm.
(B and C) Relative abundance of double-labeled neurons (TH+retroARC in red slice, TH+retroPBN in green slice, or triple: TH+retroARC+retroPBN in orange slice) and zoomed-in images. A total of n = 531 NTSTH neurons from four mice were detected to be retrogradely labeled either from ARC or PBN.
(D) Distribution of retrogradely labeled NTSTH neurons.
(E) Virus-mediated retrograde labeling of ARC-projecting NTSTH neurons in Th-ires-cre mice.
(F and G) Summary pie charts for the impact of bath-applied ghrelin (30 nM) or low glucose (0.5 mM) on the firing rate of ARC-projecting NTSTH neurons determined by fluorescence-guided loose seal recordings (n = 11 neurons for ghrelin; n = 22 neurons for glucose responses).
Given that ARC-projecting NTSTH neurons are required for hypoglycemic feeding, we next explored whether these neurons respond to deprivation-related metabolic and hormonal signals. To achieve this, we retrogradely labeled ARC-projecting NTSTH neurons by injecting ARC of Th-ires-cre mice with retro AAV-CAG-FLEX-td Tomato virus. We then performed fluorescence-guided electrophysiological recordings from NTS slices and evaluated responsiveness of labeled NTSTH → ARC neurons to ghrelin and low glucose. Surprisingly, we observed a heterogeneous response profile in individual ARC-projecting NTSTH neurons for ghrelin application with a similar number of excited, inhibited, and unresponsive neurons. Similarly, most neurons responded to glucose concentration reduction to hypoglycemic levels with 45% of the neurons increasing their activity, while another 41% were suppressed (Figures 7E–7G). These results suggest that a substantial fraction of ARC-projecting NTSTH neurons have a functional response profile that is consistent with a role in energy deficit state. This is in striking contrast to the general NTSTH population, which was previously shown to be inhibited by ghrelin and activated by high glucose (Cui et al., 2011; Roberts et al., 2017). Thus, limited anatomical overlap of ARC-projecting NTSTH neurons with anorexigenic NTSTH neurons appears to extend into functional domain as well, further corroborating the key role these neurons may play in hypoglycemic feeding.
DISCUSSION
Here, we describe an ascending pathway from brainstem that conveys orexigenic signals to the hypothalamus. We showed that a TH-expressing NTS neuron subpopulation projects to the ARC to upregulate and downregulate AgRP- and POMC-expressing neuron activity, respectively. NTSTH → ARC projection appears to play a key role in glucoprivic feeding, and acute inhibition of AgRP neuron activity significantly reduces hypoglycemia-induced food intake. These are surprising findings given the general consensus on the role of NTS neurons in promoting satiety.
Multiple lines of evidence indicate that optogenetic activation of NTSTH → ARC fibers drive food intake through actions in the hypothalamus but not elsewhere. First, local delivery of AR antagonists blocked NTSTH:ChR2 → ARC-dependent feeding, indicating that NE release in the ARC is critical. Second, local delivery of CNO into ARC in NTSTH:hM3Dq mice stimulated feeding. Third, activation and inhibition of ARC-projecting NTSTH neurons increased food intake and suppressed glucoprivic feeding responses, respectively. In addition, both NTSTH → ARC activation and direct NE perfusion acutely enhanced electrical activity of AgRP neurons. Consistently, acute inhibition of AgRP neurons, similar to the inhibition of ARC-projecting NTSTH neurons, impaired glucoprivic feeding. Together, these results suggest the ARC as a critical site of action for NTSTH → ARC circuits, and that AgRP neurons are among the main local targets.
Informing forebrain circuits about ongoing hypoglycemia is critical for survival. Impairment in this function may underlie hypoglycemia unawareness, a potentially fatal condition seen in advanced diabetic patients (Cryer, 2013; Martín-Timón and Del Cañizo-Gómez, 2015). Given that some glucoprivic feeding response remains even after silencing of ARC-projecting NTSTH neurons or their target AgRP neurons suggests that additional parallel pathways likely exist. Those likely involve the NTS projections to the paraventricular hypothalamus (PVH), lateral hypothalamus (LH), and adrenergic pathways originating from ventrolateral medulla (VLM) (Ritter et al., 2001; Ritter et al., 2006; Ritter et al., 2019). Indeed, activation of LH orexin-expressing neurons by VLM catecholamine neurons was previously reported (Li et al., 2015). Considering the vital role of arousal and food seeking upon glucoprivation threat, it would be expected that redundant pathways might have evolved to ensure survival. Therefore, further research is warranted to address additional components of this pathway and assess whether they also contribute to hormonal and sympathoadrenal elements of glucose regulation.
Hypothalamus-projecting catecholamine neurons have been known to be required for glucoprivic feeding. D-SAP injections into both the ARC and PVH ablate catecholaminergic neurons projecting to these regions. In addition to several other sites, both VLM and NTS adrenergic and noradrenergic populations were significantly affected by these chemical lesions (Fraley et al., 2002; Hudson and Ritter, 2004; Jokiaho et al., 2014; Ritter et al., 2001). Nevertheless, the role of their forebrain projections in glucoprivic appetite was unclear, since decerebrate rats were still capable of consummatory behavior upon glucoprivation (Flynn and Grill, 1983). However, these subjects were fed through a cheek fistula and were unable to perform complex appetitive behaviors. Our results suggest that hypothalamus-innervating NTSTH axons mediate appetitive phase of glucoprivic hunger. Inhibition of ARC-projecting NTSTH neurons as well as their hypothalamic target, AgRP neurons, both impaired glucoprivic feeding. Slice recordings confirmed that a subset of ARC-projecting NTSTH neurons were responsive to hypoglycemia. Further support comes from Ca2+ imaging studies from NTS slices, which showed rapid and robust activation of TH+ neurons by hypoglycemic challenge (Rogers et al., 2018). However, others have reported opposite results with respect to NTSTH neuronal response to glucose and ghrelin (Cuiet al., 2011; Date et al., 2006; Roberts et al., 2017). Discrepancies in the existing literature might reflect the presence of multiple NTSTH subpopulations whose physiological properties are likely defined by the projection target. Indeed, this notion is supported by the results showing that activation of NTSTH → PBN projections is strongly anorexigenic, whereas activation of NTSTH → ARC projections is orexigenic.
Our findings suggest that in the ARC, NTSTH axons oppositely influence multiple targets, including AgRP- and POMC-expressing neurons, and use both adrenergic and glutamatergic transmissions. Consistent with these results, inverse regulation of AgRP and POMC neurons was recently demonstrated by pharmacologic application of NE (Paeger et al., 2017), where the presence of α1 and α2 ARs, respectively, was described. Using electrophysiology and Ca2+ imaging, we confirmed NE-dependent activation of AgRP neurons, which appears to be direct and cell autonomous, rather than through indirect synaptic modulation. Although adrenergic blockers diminished the response to NTSTH axon stimulation dramatically, some neurons required additional inhibition of glutamatergic signaling. Given that we did not detect any direct glutamatergic signaling onto the AgRP neurons by NTSTH axons, it is likely that glutamate may contribute to activation of some AgRP neurons polysynaptically through another local pathway. Notwithstanding, adrenergic signaling appears to be a key component of NTSTH-dependent activation for most of the affected AgRP neurons in vitro, and inhibition of adrenergic signaling was sufficient to abolish NTSTH-dependent feeding response in vivo.
Involvement of AgRP neurons in glucoprivic feeding was previously ruled out based on neonatal ablation studies (Luquet et al., 2007). However, extensive homeostatic circuit reorganization in AgRP-neuron-ablated mice might have hindered their role in hypoglycemic feeding. Therefore, here we took an alternative approach to suppress AgRP neuron activity using chemogenetics, which revealed that AgRP neurons contribute to hypoglycemic feeding. This is consistent with the reports of increased ARC Npy, Agrp mRNA levels and the activity marker c-Fos expression in AgRP neurons upon 2DG-induced gluco-privation (Fraley and Ritter, 2003; Minami et al., 1995; Sergeyev et al., 2000; Sindelar et al., 2004). Interestingly, this increase was blunted when mediobasal hypothalamic norepinephrine fibers were ablated (Date et al., 2006; Fraley et al., 2002; Fraley and Ritter, 2003). Further evidence was provided by recent studies in which AgRP-specific overexpression of the glucocorticoid-inactivating enzyme 11b-hydroxysteroid dehydrogenase 2 (11b-HSD2), AgRP-specific ablation of AMPK, or growth hormone receptor (GHR) impaired glucoprivation-induced food intake (Furigo et al., 2019; Lockie et al., 2018; Perry et al., 2019). Moreover, AgRP neurons might be involved in counter-regulatory response beyond appetite modulation, as evidenced by its effect in systemic insulin sensitivity as well as in glucore-gulation by leptin and ghrelin (Steculorum et al., 2016; Üner et al., 2019; Wang et al., 2013; Winkler et al., 2019; Xu et al., 2018).
In addition to glucose deprivation, recruitment of hypothalamic appetite circuits by ascending adrenergic pathways might be a general response to anticipated energy needs under challenging conditions such as emotional or physical stress and cardiovascular, and inflammatory challenges (Buller et al., 1999; Chan and Sawchenko, 1994; Hollis et al., 2004; Kasparov and Teschemacher, 2008; Rinaman, 2010, 2011). A well-described target of this pathway is the hypothalamic-pituitary-adrenal (HPA) axis, which is also recruited during counterregulatory response and results in corticosterone rise (Herman et al., 2003; Herman et al., 2016). It is interesting to note that AgRP neurons are also directly activated by corticosterone and AgRP-neuron-specific ablation of glucocorticoid receptor (GR) results in impaired AgRP neuron function. Moreover, adrenalectomized mice have reduced number of excitatory synapses onto AgRP neurons (Gyengesi et al., 2010; Perry et al., 2019; Shibata et al., 2016). Taken together with our results, these studies suggest that, in addition to direct activation by epinephrine (or norepinephrine), ascending brainstem catecholamine axons may also upregulate hypothalamic feeding circuits indirectly through recruitment of HPA axis, with the two pathways likely working on different timescales.
Brain stem is considered as the converging hub of peripheral satiation signals; however, our data showed that robust appe-tite-generating signals can be conveyed from the NTS to hypothalamus. Critical contribution of this pathway to glucoprivic feeding is notable given the potential clinical relevance for hypoglycemia unawareness. Given that a significant number of antiobesity drugs increase adrenergic transmission along with serotonergic transmission, strategies to block their collateral actions in hypothalamus may increase their efficiency. Understanding upstream signaling pathways that control hypothalamic pathways of appetite and glucose metabolism, as the one described here, may open new avenues for therapeutic control of impaired glucose homeostasis and obesity.
Limitations of Study
We acknowledge the limitations of optogenetic and chemogenetic approaches used in this study. Specifically, we lack detailed information on the endogenous firing patterns of ARC-projecting NTSTH neurons upon hypoglycemia. Nevertheless, we used a range of optogenetic stimulation frequencies as well as chemogenetic activation approach, all of which resulted in increased food consumption. We also cannot rule out activation of passing NTSTH axons that terminate in the nearby hypothalamic areas, since detailed information about the collateralization of these axons is missing. However, the observations that cell-type-specific manipulation of the target AgRP neurons affects glucoprivic appetite and the presence of functional interactions in slice recordings, along with other experiments discussed above, corroborate involvement of ARC region in NTSTH axon-dependent behavioral response.
Although most AgRP neurons responded to pharmacologic application of NE, our study does not identify what fraction of them are actually affected by NTSTH axon stimulation. Indeed, our cell-type blind slice recordings revealed that 12% of all recorded ARC neurons activated by NTSTH axonal photostimulation. The long distance between NTS and ARC may have caused underestimation of the actual rate, since achieving sufficient ChR2 levels at distal NTSTH axons would take longer. Neverthe-less, it is possible that only a small fraction of total AgRP neurons are actually activated by NTSTH axons; however, as we have previously reported, stimulating as little as a quarter of AgRP neurons was sufficient to give full feeding response due to functional redundancy (Aponte et al., 2011; Betley et al., 2013). Finally, we acknowledge the limitation of chemogenetic experiments that use CNO or its reverse metabolite clozapine, both of which were utilized in this study (Gomez et al., 2017; Mahler and Aston-Jones, 2018). We have addressed the issue of potential off-target effects of these ligands by including non-DREADD-ex pressing control groups.
STAR★METHODS
LEAD CONTACT AND MATERIALS AVAILABILITY
Further information and requests for resources and reagents should be directed to and will be fulfilled by the Lead Contact, Deniz Atasoy (deniz-atasoy@uiowa.edu). Any sharing of materials may be subject to material transfer agreements per the requirements of the study sponsors. Otherwise, any reagents used in this study can be made available upon request.
EXPERIMENTAL MODEL AND SUBJECT DETAILS
Animals
Mice used in this study were housed on 12 h light and dark cycle at 20◦C-24◦C, having ad libitum access to standard chow food (Teklad Diets 7913) and water, unless indicated otherwise. Cre-recombinase-expressing lines Th-cre (B6.Cg-7630403G23Rik < Tg(Th-cre)1Tmd>/J Jackson Labs Stock 008601), Th-ires-cre (Lindeberg et al., 2004), Agrp-ires-cre (Agrptm1(cre)Lowl, Jackson Labs Stock 012899) as well as Npy-gfp (Jackson Labs Stock 006417), and R26-LSL-Gi-DREADD (Jackson Labs Stock 026219) were backcrossed with C57BL/6 (Jackson Labs Stock 000664) for maintenance. Electrophysiological and behavioral studies were performed with 6–12 weeks old male and female mice. Animal care and experimental procedures were approved by University of Iowa Animal Research Committee and Istanbul Medipol University (IMU) Animal Care and Use Committee. Mice welfare and health checks were conducted in accordance with the Institutional Animal Care and Use Committee (IACUC) guidelines. Overall animal health status was monitored on daily basis and abnormalities reported to facility veterinarian. Mice that displayed more than 20% weight loss were removed from the study. In addition, sentinel mice cages were periodically screened for pathogens.
METHOD DETAILS
rAAV Production
Cre dependent rAAV plasmids were purchased from http://www.addgene.org/ or generated (FLP dependent DREADD expressing viral plasmids). rAAV was produced and purified in house with following titers: rAAV2/1-CAG-FLEX-tdTomato (1013 vg/mL), rAAV2/1-EF1α-FLEX-hChR2(H134R)-eYFP (1.78 3 1014 vg/mL), and rAAV2/1-EF1α-DIO-hM3Dq(Gq)-mCherry (3.36 3 1013 vg/mL) using the protocol previously described (Mathews et al., 2002). Other viruses used: retroAAV-CAG-FLEX-tdTomato (Addgene, 7 3 1012 vg/mL), rAAV9-CAG-FLEX-ChR2-mCherry (Addgene, 1 3 1013 vg/mL), pGP-AAV1-syn-FLEX-jGCaMP7s (Addgene, 1 3 1013 vg/mL), retroAAV-EF1α-DIO-FLPo-WPRE-hGHpA (2 3 1012 vg/mL), rAAV2-EF1α-fDIO-hM3DGq-mCherry (5 3 1011 vg/mL), rAAV2-EF1α-fDIO-hM4DGi-mCherry (4 3 1012 vg/mL) CAG: Cytomegalovirus (CMV) enhancer/chicken beta-actin promoter, syn: synapsin promoter, Efl1a: Human elongation factor-1 alpha promoter, FLEX: Cre-dependent flip-excision switch, fDIO: FLP-recombinase dependent DIO.
Stereotaxic Surgeries
rAAV Injections
Stereotaxic surgeries were performed as described previously (Atasoy et al., 2012). Briefly, P40-P50 mice were anaesthetized with isoflurane in the stereotaxic instrument (David Kopf instruments, Tujunga-CA). Skull was exposed after an incision on the scalp and drilled to obtain a small hole for injection. ~200 to 600 nL virus was injected to each side intracranially using a pulled glass pipette (Drummond Scientific, Wiretrol, Broomall-PA) with 50 µm tip diameter. Viral injections were performed on the NTS (bregma: —7.00 mm, midline: ± 0.50 mm, dorsal surface —3.00 mm) for 30 nL/min by a micromanipulator (Narishige, East Meadow, NY), allowing 10 min time for each injection. Scalp was stitched after removing the pipette. At least 5 to 6 weeks were given for animal recovery and transgene expression before further experiments.
Optical Fiber or Cannula Placement
Ferrule capped optical fiber (200 mm core diameter, NA = 0.50, ThorLabs) or guide cannula (26-gauge, Plastics One) was implanted above the ARC (bregma: —1.20 mm, midline: ± 0.30 mm) for in vivo photostimulation assays. Tip locations positioned to be above ARC approximately ~300 mm for optical fibers and ~800 mm for cannula. For cannula experiments, optical fiber or injector was inserted into the cannula such that their tip protrudes additional ~500 mm ventrally from the cannula tip. Ferrule and cannula placements were performed following viral injections and fixed with dental cement. As needed, a dummy cannula (33GA) was inserted to keep the cannula passage unclogged.
Behavioral Studies
Food Intake
Following recovery time, animals were single housed in Coulbourn Habitest cages (Coulbourn Instruments, Allentown, PA) with free access to chow food and cotton bedding, handled for 3–4 days for acclimatization. Two h into the light cycle, food and water intake was started to be monitored and continued for another 2 h before any manipulation was performed. At the end of baseline recording, photostimulation was applied over the ARC using a 473 nm diode laser for 2 h (Figures 2C–2F and S2D–S2H) or 4 h (Figures 2B and 2G–2I) (10–15 mW from fiber tip, Doric Lenses Inc., Quebec). Pulse protocol used in this study was 10 Hz for 1 s repeated every 4 s, each pulse is 10 ms long, unless otherwise noted. Food intake was recorded before, during and after photostimulation by weighing food pellets or measuring Coulbourne automated pellet dispenser. Each animal was tested twice for both light and dark onset feeding. For dark onset activation, 1 h stimulation protocol was used instead of 2 h (Figures S2A–S2C) and for control (no-stim) of dark cycle feeding, the same time period of preceding day was recorded. At the end of experiments, animals were processed for post hoc analysis to evaluate fiber placement and viral transduction efficiency.
CNO/Clozapine and Antagonist Injections
For global chemogenetic activation experiments, 3 mg/kg CNO or saline was intraperitoneally (i.p.) administered to NTSTH:hM3Dq mice at the dark onset (Figure S4C). For activation of ARC-projecting NTSTH neurons, 0.3 mg/kg clozapine or saline was administered during day time (Figure 2M). The effect of chemogenetic activation/inhibition of TH neurons on feeding behavior was recorded before, during and after CNO/clozapine treatment. Control mice also received viral injections expressing tdTomato or eYFP in a cre or FLP-dependent manner. For AgRP;hM4Di DTG inhibition experiments (Figure 5D) both clozapine and CNO (data not shown) were used in separate sets of experiments. For local activation of NTSTH:hM3Dq → ARC mice (Figure S4B), following recording of baseline food intake in ad libitum fed mice during daytime, cannulated animals (over ARC) were intracranially injected using 33G injector (Plastics One) with 0.2 ng CNO (dissolved in PBS) or PBS alone with 400 nL volume. In all groups, mice were monitored in terms of their hourly food consumption as described above.
For local adrenergic inhibition experiments in the ARC (Figures 4F and 4G), cannulated NTSTH:ChR2 → ARC mice were treated with 400 nL of cocktail containing 50 µM prazosin and 1 mM yohimbine or PBS alone. Immediately after drug injection optical fiber was inserted through the same guide cannula and mice were photostimulated constantly for 2 h using the stimulation protocol: 10 Hz for 1 s repeated every 4 s, each pulse is 10 ms long. Separate cohorts of mice received either antagonists or saline. Food consumption levels of mice were monitored before, during, and after antagonist treatment and photostimulation.
Feeding Pattern Analysis
In a subset of experiments, those involving feeding pattern analyses, Coulbourn Habitest single pellet food delivery system was used to measure food consumption. NTSTH:ChR2 and NTSTH:tdTomato mice were placed in Coulbourn Habitest cages and acclimatized to automated pellet delivery for 2 to 3 days. For both light and dark cycles, consumption of 20 mg pellets (Bio-Serv, Flemington, NJ) was recorded for 2 h as baseline activity. Photostimulation protocol was applied as described above with the exception that 4 h stim-ulation were used to collect sufficient data for meal pattern analysis for both light and dark onset feeding (Figures 2B, 2G–2I, S2B, and S2C). A ‘‘meal’’ was defined as 4 or more pellets consumed within 10 min.
Real-Time Place Preference
NTSTH:ChR2 → ARC and NTSTH:tdTom → ARC mice were put in a custom-made behavior chamber (25 × 50 × 25 cm), where one half of the chamber was coupled with constant 10 Hz photostimulation and no photostimulation was applied on the other half of the chamber. Mice were traced with a CCD camera by ANY-maze software (Stoelting Co., Wood Dale, IL) for 30 min. Time spent on each side of the chamber was recorded.
Elevated Plus Maze
Plus maze with two open arms (5 × 35 cm) and two closed arms (5 × 35 × 20 cm) was elevated for 35 cm. NTSTH:ChR2 and NTSTH:tdTom mice were habituated in the test room for an h. Mice were placed in the center of the maze, facing forward the open arm and were photostimulated and monitored for 10 min. The tests were recorded with a CCD camera and analyzed with ANY-maze software.
Open Field and Other Assays
For open field analysis, NTSTH:ChR2 and NTSTH:tdTom mice were acclimatized to the testing room before testing. Animals were placed in an open field test chamber (40 3 40 3 40 cm) and stimulated with the pulse protocol for 10 min. The assay was traced with a CCD camera and the ANY-maze software.
For other behaviors, NTSTH:ChR2 and NTSTH:tdTom mice were traced with a CCD camera before, during, and after photostimulation, and the videos were blindly analyzed by two researchers independently to detect total cumulative time spent in behaviors including grooming, nesting, eating, and drinking time. Scratching period for 8 or more seconds was defined as grooming. Shredding and bedding motions were characterized as nesting behavior.
Electrophysiology
P70-P90 mice were sacrificed, 5–6 weeks after intracranial ChR2-eYFP or tdTomato expressing virus injection, to ensure sufficient expression in distant terminals or soma. Brains were immersed in a 95% O2 / 5% CO2 aerated ice-cold cutting solution including (in mM): 234 sucrose, 28 NaHCO3, 7 dextrose, 2.5 KCl, 7 MgCl2, 0.5 CaCl2, 1 sodium ascorbate, 3 sodium pyruvate and, 1.25 NaH2PO4, and 300 mm thick fresh slices containing the hypothalamus were obtained with vibratome and transferred to 95% O2 / 5% CO2 aerated artificial cerebrospinal fluid (aCSF) containing (in mM): 119 NaCl, 25 NaHCO3, 11 dextrose, 2.5 KCl, 1.25 MgCl2, 2 CaCl2, and 1.25 NaH2PO4. The sections were incubated in this solution for at least 30 min in the room temperature and then, placed in the recording chamber. Cell-attached and whole-cell patch clamp recordings were performed on ARC neurons using electrodes with 4–5 MU tip resistances. aCSF was used as the pipette solution for cell-attached recordings. MultiClamp 700B Amplifier (Molecular Devices, San Jose, CA) and Axon pCLAMP 11 software (Molecular Devices, San Jose, CA) were used to obtain and analyze data.
LED array (Doric Lenses Inc., Quebec) was used for optogenetic stimulation of ChR2 in the brain sections, and blue light was delivered through a fiber placed over the slice. 1 ms and 10 Hz pulse protocol was used in recordings for 90 s (30 s baseline, 30 s photo-stimulation and 30 s post stimulation), pulses were generated by AMPI Master-9 Pulse stimulator. ARC recordings were performed from randomly selected neurons. For ARC neurons that increased activity upon NTSTH axon photostimulation, prazosin (5 µM) or CNQX (10 µM) + AP5 (50 µM) cocktail was added to test the effect of adrenergic and glutamatergic signaling. For loose seal recordings, multiple sweeps were collected for 5–10 min for baseline until stable response was achieved, before blocker applications. Change in firing rate during photostimulation was defined as at least 20% consistent increase (or decrease) in average firing rate during photostimulation (30 s-60 s) compared to prestimulation baseline period (0 s-30 s) across sweeps.
To test the effect of added NE (10 µM, Figures 6E–6G), ghrelin (30 nM, Figure 7F), or low glucose (0.5 mM, Figure 7G) solution, 5–10 min baseline was recorded, and drugs were perfused in bath solution. For recordings to test effect of bath applied NE (Figures 6E–6G), synaptic blockers cocktail (CNQX (10 µM) + AP5 (50 µM) + PTX (50 µM)) were present prior to start of the recording whereas in the experiments evaluating the impact of ghrelin and low glucose (Figures 7F and 7G), no synaptic blockers were added. Similarly, traces in which average pos-drug activity remain within ± 20% of baseline regarded as unresponsive.
Slice Ca2+ Imaging
Slices were prepared as described above, and CNQX (10 µM) + AP5 (50 µM) + PTX (50 µM) cocktail was added to the recording aCSF solution prior to the start of recordings. Images were obtained on Scientifica SliceScope pro3000 using Hamamatsu Orca Flash 4.0v3 camera at 3Hz. A baseline of 5–10 min was imaged using 470 nm stimulation (CooLED PE4000) and GFP filter set 525/50 m (Chroma) before bath administration of NE (10 µM). Images were first corrected for drift using ImageJ then background subtracted and DF values were obtained by subtracting baseline (Fo) fluorescence, which was defined as the minimal fluorescence value in 10 min moving window. The area under the DF/Fo curve was calculated using Axon pCLAMP software before and after administration of NE (Figures 6H–6J).
Single Cell rt-PCR
Cytoplasmic contents of the neurons were aspirated into patch-clamp pipettes following the recordings and then were collected into microtubes with RNA extraction buffer. Total RNA was obtained as indicated in the user’s manual (PicoPure RNA Extraction Kit, Thermo Fisher Scientific, Waltham, MA). First strand cDNA synthesis (RevertAid First Strand cDNA Synthesis Kit, Thermo Fisher Scientific, Waltham, MA), was followed by PCR in 20 µL reaction buffers, containing 1 µL of the single cell cDNA and the specific primers for AgRP mRNA (Forward: 5ᐟ- CTCCACTGAAGGGCATCAGAAG-3ᐟ, Reverse: 5ᐟ- ATCTAGCACCTCCGCCAAAG’), Pomc mRNA (Forward: 5ᐟ- GGAAGATGCCGAGATTCTGC-3ᐟ, Reverse: 5ᐟ- TCCGTTGCCAGGAAACAC-3ᐟ), Gapdh mRNA (Forward:5ᐟ- GTCGGTGTGAACGGATTT-3, Reverse:5ᐟ-ATGTTAGTGGGGTCTCGCTC-3ᐟ). After one round of PCR was complete (30 cycles), 0.5 µL of the PCR products were used for a second PCR round (30 cycles). PCR products were then monitored with 2% agarose gels for the presence/absence of the transcripts.
Immunohistochemistry and Imaging
Anesthetized mice were transcardially perfused with 4% paraformaldehyde in 0.1 M pH 7.4 phosphate buffer fixative and decapitated. Brains were collected, incubated in the same fixative for 4 h and transferred to 30% sucrose solution overnight. 75 µm brain sections were collected with vibratome and the sections were blocked in PBST containing 5% normal goat serum for 1 h at room temperature. Blocking solution with the primary antibody (anti-c-Fos, 1:5000, Cell Signaling, anti-TH, 1:5000, ABCAM) was then added on the sections. Following an overnight incubation at +4◦C, sections were rinsed with PBST. Secondary antibody (goat anti-rabbit IgG (H+L) Alexa Flour 488, 1:500, goat anti-rabbit IgG (H+L) Alexa Flour 568, 1:500 and goat anti-rabbit IgG (H+L) Alexa Flour 405, 1:500, Invitrogen) was added on the sections and incubated for 1 h at room temperature. Sections were then rinsed, transferred to microscope slides and mounted with Fluoromount (Sigma F4680). Imaging was performed by confocal microscopy (Carl Zeiss, Thornwood, NY).
Projection Mapping and Axon Anatomy
For projection mapping, Th-cre or Th-ires-cre mice were injected with cre-dependent tdTomato virus in the NTS as described above. Mice were allowed 3 weeks for recovery and transgene expression. Then, animals were sacrificed, and brains were collected. Brain sections including the NTS were immunostained with anti-TH primary antibody.
To observe retrograde transportation to the NTS from the ARC and PBN, Red Retrobeads and Green Retrobeads (Lumafluor, Inc.) injections were performed in the ARC (bregma: —1.20 mm, midline: ± 0.30 mm, dorsal surface —5.80 mm) and PBN (bregma: —5.00 mm, midline: ± 1.00 mm, dorsal surface —3.00 mm) respectively. Intracranial injections were performed on the wild type mice, according to the above-mentioned procedure. Mice were allowed 12 days before observing retrograde transport of the beads in the NTS. Animals were decapitated, and the brains were collected. Brain slices with ARC and NTS regions were imaged to confirm injection location and slices with the NTS region were stained with anti-TH primary antibody for colocalization analysis.
QUANTIFICATION AND STATISTICAL ANALYSIS
All results were represented as Mean ± SEM. Sufficiency of number of mice in each cohort were estimated based on pilot experiments and previously published work (Aponte et al., 2011; Atasoy et al., 2012). Outlier tests or tests for normality were not performed. Differences between two groups were tested with paired, ratio paired and unpaired Student’s t tests. Multiple group statistical comparisons were made by ANOVA, corrected p values, and Pearson r and p values were calculated using Prism 8.1 (GraphPad Software Inc.). N represents mice or neuron numbers as indicated for each experiment. A p value < 0.05 was considered to be statistically significant.
DATA AND CODE AVAILABILITY
This study did not generate/analyze datasets/code.
Supplementary Material
KEY RESOURCES TABLE
| REAGENT or RESOURCE | SOURCE | IDENTIFIER |
|---|---|---|
| Antibodies | ||
|
| ||
| anti-c-Fos | Cell Signaling | 2250S; RRID: AB_2247211 |
| Anti-TH | ABCAM | Ab112; RRID: AB_297840 |
|
| ||
| Bacterial and Virus Strains | ||
|
| ||
| rAAV2/1-CAG-FLEX-tdTomato | Addgene /home made | RRID: Addgene_28306 |
| rAAV2/1-EF1α-FLEX-hChR2(H134R)-eYFP | Addgene /home made | RRID: Addgene_20298 |
| rAAV2/1-EF1α-DIO-hM3Dq-mCherry | Addgene /home made | RRID: Addgene_50460 |
| retroAAV-CAG-FLEX-tdTomato | Addgene | RRID: Addgene_28306 |
| rAAV9-CAG-FLEX-ChR2-mCherry | Addgene | RRID: Addgene_18916 |
| pGP-AAV1-Syn-FLEX-jGCaMP7s | Addgene | RRID: Addgene_104491 |
| retroAAV-EF1α-DIO-FLPo | Addgene /U Iowa vector core | RRID: Addgene_87306 |
| rAAV1-EF1α-fDIO-eYFP | Salk Vector Core | N/A |
| rAAV2-EF1α-fDIO-hM3Dq-mCherry | Cui Lab / U Iowa vector core | N/A |
| rAAV2-EF1α-fDIO-hM4Di-mCherry | Cui Lab / U Iowa vector core | N/A |
|
| ||
| Chemicals, Peptides, and Recombinant Proteins | ||
|
| ||
| Clozapine-N-oxide | Tocris | Cat. No. 4936 |
| Clozapine | Tocris | Cat. No. 0444 |
| Prazosin | Tocris | Cat. No. 0623 |
| Yohimbine | Tocris | Cat. No. 1127 |
| Norepinephrine | Sigma | Cat. No. A0937 |
| CNQX | Tocris | Cat. No. 0190 |
| D-AP5 | Tocris | Cat. No. 0106 |
| Picrotoxin | Tocris | Cat. No. 1128 |
| Red retrobeads | Lumafluor | Cat. No. R180 |
| Green retrobeads | Lumafluor | Cat. No. G180 |
|
| ||
| Critical Commercial Assays | ||
|
| ||
| PicoPure RNA Extraction Kit | Thermo Fisher | Cat. No. KIT0214 |
| RevertAid First Strand cDNA Synthesis Kit | Thermo Fisher | Cat. No. K1622 |
|
| ||
| Experimental Models: Organisms/Strains | ||
|
| ||
| Th-cre B6.Cg-7630403G23Rik <Tg(Th-cre)1Tmd>/J | Jackson Laboratories | Stock 008601 |
| Th-ires-cre | (Lindeberg et al., 2004) | N/A |
| Agrp-ires-cre Agrptm1(cre)Lowl, | Jackson Laboratories | Stock 012899 |
| Npy-gfp | Jackson Laboratories | Stock 006417 |
| R26-LSL-Gi-DREADD | Jackson Laboratories | Stock 026219 |
| C57BL/6 | Jackson Laboratories | Stock 000664 |
|
| ||
| Oligonucleotides | ||
|
| ||
| AgRP mRNA Forward: 5ᐟ-CTCCACTGAAGGGCATCAGAAG-3ᐟ | Invitrogen | N/A |
| AgRP mRNA Reverse: 5ᐟ-ATCTAGCACCTCCGCCAAAG’ | Invitrogen | N/A |
| Pomc mRNA Forward: 5ᐟ-GGAAGATGCCGAGATTCTGC-3ᐟ | Invitrogen | N/A |
| Pomc mRNA Reverse: 5ᐟ-TCCGTTGCCAGGAAACAC-3ᐟ | Invitrogen | N/A |
| Gapdh mRNA Forward:5ᐟ-GTCGGTGTGAACGGATTT-3, | Invitrogen | N/A |
| Gapdh mRNA Reverse:5ᐟ-ATGTTAGTGGGGTCTCGCTC-3ᐟ | Invitrogen | N/A |
|
| ||
| Software and Algorithms | ||
|
| ||
| Prism 8.0 | GraphPad | N/A |
| pClamp 11 | Molecular devices | N/A |
| HCImage | Hamamatsu | U11158 |
|
| ||
| Other | ||
|
| ||
| Laser | Doric Lens | DFLS_450/075_450/075_450/075_450/075 |
Highlights.
NTSTH axons innervate the ARC and elicit food intake via norepinephrine release
ARC-projecting NTSTH neurons are required for glucoprivic feeding
AgRP neurons are targeted by NTSTH axons and contribute to glucoprivic feeding
ARC- and PBN-projecting NTSTH neurons are largely distinct
Context and Significance.
Blood glucose levels are tightly controlled, since glucose is the main energy source for the brain. Extreme drops in glucose levels, due to energy deprivation or therapeutic agents, can be life threatening. Normally, such drops are countered by defense responses that involve increased hunger. However, in many diabetic patients, the mechanisms that inform the brain about ongoing hypoglycemia to drive hunger are impaired. In this study, researchers at the University of Iowa and their collaborators have discovered a neuronal pathway that connects hypoglycemia-activated brainstem neurons with feeding control centers in the part of the brain known as the hypothalamus. These results identify key pathways that might contribute to impaired responses to hypoglycemia and provide novel targets for improved glycemic regulation.
ACKNOWLEDGMENTS
This work is supported by EMBO IG and FOEDRC grants to D.A. and by grants from the National Institutes of Health (HL127673, MH109920, and HL084207) and FOEDRC to H.C. We thank Dr. Scott Sternson and Dr. Kamal Rahmouni for critical reading of the manuscript and Tuba Oguz for technical support.
Footnotes
SUPPLEMENTAL INFORMATION
Supplemental Information can be found online at https://doi.org/10.1016/j.cmet.2019.11.016.
DECLARATION OF INTERESTS
The authors declare no competing interests.
REFERENCES
- Alexander GM, Rogan SC, Abbas AI, Armbruster BN, Pei Y, Allen JA, Nonneman RJ, Hartmann J, Moy SS, Nicolelis MA, et al. (2009). Remote control of neuronal activity in transgenic mice expressing evolved G protein-coupled receptors. Neuron 63, 27–39. [DOI] [PMC free article] [PubMed] [Google Scholar]
- Aponte Y, Atasoy D, and Sternson SM (2011). AGRP neurons are sufficient to orchestrate feeding behavior rapidly and without training. Nat. Neurosci 14, 351–355. [DOI] [PMC free article] [PubMed] [Google Scholar]
- Atasoy D, and Sternson SM (2018). Chemogenetic Tools for Causal Cellular and Neuronal Biology. Physiol. Rev 98, 391–418. [DOI] [PMC free article] [PubMed] [Google Scholar]
- Atasoy D, Betley JN, Su HH, and Sternson SM (2012). Deconstruction of a neural circuit for hunger. Nature 488, 172–177. [DOI] [PMC free article] [PubMed] [Google Scholar]
- Betke KM, Wells CA, and Hamm HE (2012). GPCR mediated regulation of synaptic transmission. Prog. Neurobiol 96, 304–321. [DOI] [PMC free article] [PubMed] [Google Scholar]
- Betley JN, Cao ZF, Ritola KD, and Sternson SM (2013). Parallel, redundant circuit organization for homeostatic control of feeding behavior. Cell 155, 1337–1350. [DOI] [PMC free article] [PubMed] [Google Scholar]
- Betley JN, Xu S, Cao ZFH, Gong R, Magnus CJ, Yu Y, and Sternson SM (2015). Neurons for hunger and thirst transmit a negative-valence teaching signal. Nature 521, 180–185. [DOI] [PMC free article] [PubMed] [Google Scholar]
- Blevins JE, Schwartz MW, and Baskin DG (2004). Evidence that paraven-tricular nucleus oxytocin neurons link hypothalamic leptin action to caudal brain stem nuclei controlling meal size. Am. J. Physiol. Regul. Integr. Comp. Physiol 287, R87–R96. [DOI] [PubMed] [Google Scholar]
- Blouet C, and Schwartz GJ (2012). Brainstem nutrient sensing in the nucleus of the solitary tract inhibits feeding. Cell Metab 16, 579–587. [DOI] [PMC free article] [PubMed] [Google Scholar]
- Buller KM, Smith DW, and Day TA (1999). NTS catecholamine cell recruitment by hemorrhage and hypoxia. Neuroreport 10, 3853–3856. [DOI] [PubMed] [Google Scholar]
- Chan RK, and Sawchenko PE (1994). Spatially and temporally differentiated patterns of c-fos expression in brainstem catecholaminergic cell groups induced by cardiovascular challenges in the rat. J. Comp. Neurol 348, 433–460. [DOI] [PubMed] [Google Scholar]
- Cryer PE (2013). Mechanisms of hypoglycemia-associated autonomic failure in diabetes. N. Engl. J. Med 369, 362–372. [DOI] [PubMed] [Google Scholar]
- Cui RJ, Li X, and Appleyard SM (2011). Ghrelin inhibits visceral afferent activation of catecholamine neurons in the solitary tract nucleus. J. Neurosci 31, 3484–3492. [DOI] [PMC free article] [PubMed] [Google Scholar]
- D’Agostino G, Lyons DJ, Cristiano C, Burke LK, Madara JC, Campbell JN, Garcia AP, Land BB, Lowell BB, Dileone RJ, and Heisler LK (2016). Appetite controlled by a cholecystokinin nucleus of the solitary tract to hypothalamus neurocircuit. eLife 5, e12225. [DOI] [PMC free article] [PubMed] [Google Scholar]
- D’Agostino G, Lyons D, Cristiano C, Lettieri M, Olarte-Sanchez C, Burke LK, Greenwald-Yarnell M, Cansell C, Doslikova B, Georgescu T, et al. (2018). Nucleus of the Solitary Tract Serotonin 5-HT2C Receptors Modulate Food Intake. Cell Metab 28, 619–630. [DOI] [PMC free article] [PubMed] [Google Scholar]
- Date Y, Shimbara T, Koda S, Toshinai K, Ida T, Murakami N, Miyazato M, Kokame K, Ishizuka Y, Ishida Y, et al. (2006). Peripheral ghrelin trans-mits orexigenic signals through the noradrenergic pathway from the hindbrain to the hypothalamus. Cell Metab 4, 323–331. [DOI] [PubMed] [Google Scholar]
- Duerrschmid C, He Y, Wang C, Li C, Bournat JC, Romere C, Saha PK, Lee ME, Phillips KJ, Jain M, et al. (2017). Asprosin is a centrally acting orexigenic hormone. Nat. Med 23, 1444–1453. [DOI] [PMC free article] [PubMed] [Google Scholar]
- Fenselau H, Campbell JN, Verstegen AM, Madara JC, Xu J, Shah BP, Resch JM, Yang Z, Mandelblat-Cerf Y, Livneh Y, and Lowell BB (2017). A rapidly acting glutamatergic ARC → PVH satiety circuit postsyn-aptically regulated by α-MSH. Nat. Neurosci 20, 42–51. [DOI] [PMC free article] [PubMed] [Google Scholar]
- Flynn FW, and Grill HJ (1983). Insulin elicits ingestion in decerebrate rats. Science 221, 188–190. [DOI] [PubMed] [Google Scholar]
- Fraley GS, and Ritter S (2003). Immunolesion of norepinephrine and epinephrine afferents to medial hypothalamus alters basal and 2-deoxy-D-glucose-induced neuropeptide Y and agouti generelated protein messenger ribonucleic acid expression in the arcuate nucleus. Endocrinology 144, 75–83. [DOI] [PubMed] [Google Scholar]
- Fraley GS, Dinh TT, and Ritter S (2002). Immunotoxic catecholamine lesions attenuate 2DG-induced increase of AGRP mRNA. Peptides 23, 1093–1099. [DOI] [PubMed] [Google Scholar]
- Furigo IC, Teixeira PDS, de Souza GO, Couto GCL, Romero GG, Perelló M, Frazão R, Elias LL, Metzger M, List EO, et al. (2019). Growth hormone regulates neuroendocrine responses to weight loss via AgRP neurons. Nat. Commun 10, 662. [DOI] [PMC free article] [PubMed] [Google Scholar]
- Gomez JL, Bonaventura J, Lesniak W, Mathews WB, Sysa-Shah P, Rodriguez LA, Ellis RJ, Richie CT, Harvey BK, Dannals RF, et al. (2017). Chemogenetics revealed: DREADD occupancy and activation via con-verted clozapine. Science 357, 503–507. [DOI] [PMC free article] [PubMed] [Google Scholar]
- Grosse J, Heffron H, Burling K, Akhter Hossain M, Habib AM, Rogers GJ, Richards P, Larder R, Rimmington D, Adriaenssens AA, et al. (2014). Insulin-like peptide 5 is an orexigenic gastrointestinal hormone. Proc. Natl. Acad. Sci. USA 111, 11133–11138. [DOI] [PMC free article] [PubMed] [Google Scholar]
- Gyengesi E, Liu ZW, D’Agostino G, Gan G, Horvath TL, Gao XB, and Diano S (2010). Corticosterone regulates synaptic input organization of POMC and NPY/AgRP neurons in adult mice. Endocrinology 151, 5395–5402. [DOI] [PMC free article] [PubMed] [Google Scholar]
- Herman JP, Figueiredo H, Mueller NK, Ulrich-Lai Y, Ostrander MM, Choi DC, and Cullinan WE (2003). Central mechanisms of stress integration: hierarchical circuitry controlling hypothalamo-pituitary-adrenocortical responsiveness. Front. Neuroendocrinol 24, 151–180. [DOI] [PubMed] [Google Scholar]
- Herman JP, McKlveen JM, Ghosal S, Kopp B, Wulsin A, Makinson R, Scheimann J, and Myers B (2016). Regulation of the Hypothalamic-Pituitary-Adrenocortical Stress Response. Compr. Physiol 6, 603–621. [DOI] [PMC free article] [PubMed] [Google Scholar]
- Hollis JH, Lightman SL, and Lowry CA (2004). Integration of systemic and visceral sensory information by medullary catecholaminergic systems during peripheral inflammation. Ann. N. Y. Acad. Sci 1018, 71–75. [DOI] [PubMed] [Google Scholar]
- Hsu JY, Crawley S, Chen M, Ayupova DA, Lindhout DA, Higbee J, Kutach A, Joo W, Gao Z, Fu D, et al. (2017). Non-homeostatic body weight regulation through a brainstem-restricted receptor for GDF15. Nature 550, 255–259. [DOI] [PubMed] [Google Scholar]
- Hudson B, and Ritter S (2004). Hindbrain catecholamine neurons mediate consummatory responses to glucoprivation. Physiol. Behav 82, 241–250. [DOI] [PubMed] [Google Scholar]
- Jokiaho AJ, Donovan CM, and Watts AG (2014). The rate of fall of blood glucose determines the necessity of forebrain-projecting catecholaminergic neurons for male rat sympathoadrenal responses. Diabetes 63, 2854–2865. [DOI] [PMC free article] [PubMed] [Google Scholar]
- Kasparov S, and Teschemacher AG (2008). Altered central catecholaminergic transmission and cardiovascular disease. Exp. Physiol 93, 725–740. [DOI] [PubMed] [Google Scholar]
- Leibowitz SF (1978). Adrenergic stimulation of the paraventricular nucleus and its effects on ingestive behavior as a function of drug dose and time of injection in the light-dark cycle. Brain Res. Bull 3, 357–363. [DOI] [PubMed] [Google Scholar]
- Li AJ, Wang Q, Elsarelli MM, Brown RL, and Ritter S (2015). Hindbrain Catecholamine Neurons Activate Orexin Neurons During Systemic Glucoprivation in Male Rats. Endocrinology 156, 2807–2820. [DOI] [PMC free article] [PubMed] [Google Scholar]
- Lindeberg J, Usoskin D, Bengtsson H, Gustafsson A, Kylberg A, Söderström S, and Ebendal T (2004). Transgenic expression of Cre recombinase from the tyrosine hydroxylase locus. Genesis 40, 67–73. [DOI] [PubMed] [Google Scholar]
- Liu T, Kong D, Shah BP, Ye C, Koda S, Saunders A, Ding JB, Yang Z, Sabatini BL, and Lowell BB (2012). Fasting activation of AgRP neurons requires NMDA receptors and involves spinogenesis and increased excitatory tone. Neuron 73, 511–522. [DOI] [PMC free article] [PubMed] [Google Scholar]
- Liu J, Conde K, Zhang P, Lilascharoen V, Xu Z, Lim BK, Seeley RJ, Zhu JJ, Scott MM, and Pang ZP (2017). Enhanced AMPA Receptor Trafficking Mediates the Anorexigenic Effect of Endogenous Glucagon-like Peptide-1 in the Paraventricular Hypothalamus. Neuron 96, 897–909. [DOI] [PMC free article] [PubMed] [Google Scholar]
- Lockie SH, Stark R, Mequinion M, Ch’ng S, Kong D, Spanswick DC, Lawrence AJ, and Andrews ZB (2018). Glucose Availability Predicts the Feeding Response to Ghrelin in Male Mice, an Effect Dependent on AMPK in AgRP Neurons. Endocrinology 159, 3605–3614. [DOI] [PMC free article] [PubMed] [Google Scholar]
- Luquet S, Perez FA, Hnasko TS, and Palmiter RD (2005). NPY/AgRP neurons are essential for feeding in adult mice but can be ablated in neonates. Science 310, 683–685. [DOI] [PubMed] [Google Scholar]
- Luquet S, Phillips CT, and Palmiter RD (2007). NPY/AgRP neurons are not essential for feeding responses to glucoprivation. Peptides 28, 214–225. [DOI] [PubMed] [Google Scholar]
- Mahler SV, and Aston-Jones G (2018). CNO Evil? Considerations for the Use of DREADDs in Behavioral Neuroscience. Neuropsychopharmacology 43, 934–936. [DOI] [PMC free article] [PubMed] [Google Scholar]
- Mandelblat-Cerf Y, Ramesh RN, Burgess CR, Patella P, Yang Z, Lowell BB, and Andermann ML (2015). Arcuate hypothalamic AgRP and putative POMC neurons show opposite changes in spiking across multiple timescales. eLife 4, 10.7554/eLife.07122. [DOI] [PMC free article] [PubMed] [Google Scholar]
- Martín-Timón I, and Del Cañizo-Gómez FJ (2015). Mechanisms of hypoglycemia unawareness and implications in diabetic patients. World J. Diabetes 6, 912–926. [DOI] [PMC free article] [PubMed] [Google Scholar]
- Mathews LC, Gray JT, Gallagher MR, and Snyder RO (2002). Recombinant adeno-associated viral vector production using stable pack-aging and producer cell lines. Methods Enzymol 346, 393–413. [DOI] [PubMed] [Google Scholar]
- Minami S, Kamegai J, Sugihara H, Suzuki N, Higuchi H, and Wakabayashi I (1995). Central glucoprivation evoked by administration of 2-deoxy-D-glucose induces expression of the c-fos gene in a subpopulation of neuropeptide Y neurons in the rat hypothalamus. Brain Res. Mol. Brain Res 33, 305–310. [DOI] [PubMed] [Google Scholar]
- Nakazato M, Murakami N, Date Y, Kojima M, Matsuo H, Kangawa K, and Matsukura S (2001). A role for ghrelin in the central regulation of feeding. Nature 409, 194–198. [DOI] [PubMed] [Google Scholar]
- Paeger L, Karakasilioti I, Altmüller J, Frommolt P, Brüning J, and Kloppenburg P (2017). Antagonistic modulation of NPY/AgRP and POMC neurons in the arcuate nucleus by noradrenalin. eLife 6, e25770. [DOI] [PMC free article] [PubMed] [Google Scholar]
- Perry RJ, Resch JM, Douglass AM, Madara JC, Rabin-Court A, Kucukdereli H, Wu C, Song JD, Lowell BB, and Shulman GI (2019). Leptin’s hunger-suppressing effects are mediated by the hypothalamic-pituitary-adrenocortical axis in rodents. Proc. Natl. Acad. Sci. USA 116, 13670–13679. [DOI] [PMC free article] [PubMed] [Google Scholar]
- Ricardo JA, and Koh ET (1978). Anatomical evidence of direct projections from the nucleus of the solitary tract to the hypothalamus, amygdala, and other forebrain structures in the rat. Brain Res 153, 1–26. [DOI] [PubMed] [Google Scholar]
- Rinaman L (2010). Ascending projections from the caudal visceral nucleus of the solitary tract to brain regions involved in food intake and energy expenditure. Brain Res 1350, 18–34. [DOI] [PMC free article] [PubMed] [Google Scholar]
- Rinaman L (2011). Hindbrain noradrenergic A2 neurons: diverse roles in autonomic, endocrine, cognitive, and behavioral functions. Am. J. Physiol. Regul. Integr. Comp. Physiol 300, R222–R235. [DOI] [PMC free article] [PubMed] [Google Scholar]
- Ritter S, Bugarith K, and Dinh TT (2001). Immunotoxic destruction of distinct catecholamine subgroups produces selective impairment of glucoregulatory responses and neuronal activation. J. Comp. Neurol 432, 197–216. [DOI] [PubMed] [Google Scholar]
- Ritter S, Dinh TT, and Li AJ (2006). Hindbrain catecholamine neurons control multiple glucoregulatory responses. Physiol. Behav 89, 490–500. [DOI] [PubMed] [Google Scholar]
- Ritter S, Li AJ, and Wang Q (2019). Hindbrain glucoregulatory mechanisms: Critical role of catecholamine neurons in the ventrolateral medulla. Physiol. Behav 208, 112568. [DOI] [PMC free article] [PubMed] [Google Scholar]
- Roberts BL, Zhu M, Zhao H, Dillon C, and Appleyard SM (2017). High glucose increases action potential firing of catecholamine neurons in the nucleus of the solitary tract by increasing spontaneous glutamate inputs. Am. J. Physiol. Regul. Integr. Comp. Physiol 313, R229–R239. [DOI] [PMC free article] [PubMed] [Google Scholar]
- Rogers RC, McDougal DH, Ritter S, Qualls-Creekmore E, and Hermann GE (2018). Response of catecholaminergic neurons in the mouse hindbrain to glucoprivic stimuli is astrocyte dependent. Am. J. Physiol. Regul. Integr. Comp. Physiol 315, R153–R164. [DOI] [PMC free article] [PubMed] [Google Scholar]
- Roman CW, Derkach VA, and Palmiter RD (2016). Genetically and functionally defined NTS to PBN brain circuits mediating anorexia. Nat. Commun 7, 11905. [DOI] [PMC free article] [PubMed] [Google Scholar]
- Sawchenko PE, and Swanson LW (1981). Central noradrenergic pathways for the integration of hypothalamic neuroendocrine and autonomic responses. Science 214, 685–687. [DOI] [PubMed] [Google Scholar]
- Sawchenko PE, and Swanson LW (1982a). Immunohistochemical identification of neurons in the paraventricular nucleus of the hypothalamus that project to the medulla or to the spinal cord in the rat. J. Comp. Neurol 205, 260–272. [DOI] [PubMed] [Google Scholar]
- Sawchenko PE, and Swanson LW (1982b). The organization of noradrenergic pathways from the brainstem to the paraventricular and supraoptic nuclei in the rat. Brain Res 257, 275–325. [DOI] [PubMed] [Google Scholar]
- Sergeyev V, Broberger C, Gorbatyuk O, and Hökfelt T (2000). Effect of 2-mercaptoacetate and 2-deoxy-D-glucose administration on the expression of NPY, AGRP, POMC, MCH and hypocretin/orexin in the rat hypothalamus. Neuroreport 11, 117–121. [DOI] [PubMed] [Google Scholar]
- Shibata M, Banno R, Sugiyama M, Tominaga T, Onoue T, Tsunekawa T, Azuma Y, Hagiwara D, Lu W, Ito Y, et al. (2016). AgRP Neuron-Specific Deletion of Glucocorticoid Receptor Leads to Increased Energy Expenditure and Decreased Body Weight in Female Mice on a High-Fat Diet. Endocrinology 157, 1457–1466. [DOI] [PubMed] [Google Scholar]
- Sindelar DK, Ste Marie L, Miura GI, Palmiter RD, McMinn JE, Morton GJ, and Schwartz MW (2004). Neuropeptide Y is required for hyperphagic feeding in response to neuroglucopenia. Endocrinology 145, 3363–3368. [DOI] [PubMed] [Google Scholar]
- Stanley BG, and Leibowitz SF (1985). Neuropeptide Y injected in the paraventricular hypothalamus: a powerful stimulant of feeding behavior. Proc. Natl. Acad. Sci. USA 82, 3940–3943. [DOI] [PMC free article] [PubMed] [Google Scholar]
- Steculorum SM, Ruud J, Karakasilioti I, Backes H, Engström Ruud L, Timper K, Hess ME, Tsaousidou E, Mauer J, Vogt MC, et al. (2016). AgRP Neurons Control Systemic Insulin Sensitivity via Myostatin Expression in Brown Adipose Tissue. Cell 165, 125–138. [DOI] [PMC free article] [PubMed] [Google Scholar]
- Stornetta RL, Sevigny CP, and Guyenet PG (2002). Vesicular glutamate transporter DNPI/VGLUT2 mRNA is present in C1 and several other groups of brainstem catecholaminergic neurons. J. Comp. Neurol 444, 191–206. [DOI] [PubMed] [Google Scholar]
- Su Z, Alhadeff AL, and Betley JN (2017). Nutritive, Post-ingestive Signals Are the Primary Regulators of AgRP Neuron Activity. Cell Rep 21, 2724–2736. [DOI] [PMC free article] [PubMed] [Google Scholar]
- Ter Horst GJ, de Boer P, Luiten PG, and van Willigen JD (1989). Ascending projections from the solitary tract nucleus to the hypothalamus. A Phaseolus vulgaris lectin tracing study in the rat. Neuroscience 31, 785–797. [DOI] [PubMed] [Google Scholar]
- Üner AG, Keçik O, Quaresma PGF, De Araujo TM, Lee H, Li W, Kim HJ, Chung M, Bjørbæk C, and Kim YB (2019). Role of POMC and AgRP neuronal activities on glycaemia in mice. Sci. Rep 9, 13068. [DOI] [PMC free article] [PubMed] [Google Scholar]
- Wang Q, Liu C, Uchida A, Chuang JC, Walker A, Liu T, Osborne-Lawrence S, Mason BL, Mosher C, Berglund ED, et al. (2013). Arcuate AgRP neurons mediate orexigenic and glucoregulatory actions of ghrelin. Mol. Metab 3, 64–72. [DOI] [PMC free article] [PubMed] [Google Scholar]
- Wellman PJ (2000). Norepinephrine and the control of food intake. Nutrition 16, 837–842. [DOI] [PubMed] [Google Scholar]
- Winkler Z, Kuti D, Polyák Á, Juhász B, Gulyás K, Lénárt N, Dénes Á, Ferenczi S, and Kovács KJ (2019). Hypoglycemia-activated Hypothalamic Microglia Impairs Glucose Counterregulatory Responses. Sci. Rep 9, 6224. [DOI] [PMC free article] [PubMed] [Google Scholar]
- Xu J, Bartolome CL, Low CS, Yi X, Chien CH, Wang P, and Kong D (2018). Genetic identification of leptin neural circuits in energy and glucose homeostases. Nature 556, 505–509. [DOI] [PMC free article] [PubMed] [Google Scholar]
- Yang Y, Atasoy D, Su HH, and Sternson SM (2011). Hunger states switch a flip-flop memory circuit via a synaptic AMPK-dependent positive feedback loop. Cell 146, 992–1003. [DOI] [PMC free article] [PubMed] [Google Scholar]
- Zhan C, Zhou J, Feng Q, Zhang JE, Lin S, Bao J, Wu P, and Luo M (2013). Acute and long-term suppression of feeding behavior by POMC neurons in the brainstem and hypothalamus, respectively. J. Neurosci 33, 3624–3632. [DOI] [PMC free article] [PubMed] [Google Scholar]
- Zhang X, and van den Pol AN (2016). Hypothalamic arcuate nucleus tyrosine hydroxylase neurons play orexigenic role in energy homeostasis. Nat. Neurosci 19, 1341–1347. [DOI] [PMC free article] [PubMed] [Google Scholar]
Associated Data
This section collects any data citations, data availability statements, or supplementary materials included in this article.
Supplementary Materials
Data Availability Statement
This study did not generate/analyze datasets/code.