

ABSTRACT
Aims/Introduction
Diabetic kidney disease (DKD) exacerbates dyslipidemia and increases the incidence of atherosclerotic cardiovascular disease. DKD is a concept that includes typical diabetic nephropathy and an atypical phenotype without proteinuria. We investigated dyslipidemia in different DKD phenotypes that have not been fully studied.
Materials and Methods
Fasting plasma was obtained from 1,073 diabetes patients enrolled in the regional diabetes cohort (ViNA cohort). Non‐proteinuric and proteinuric DKD were defined as an estimated glomerular filtration rate <60 mL/min/1.73 m2 in the absence or presence of urinary albumin‐to‐creatinine ratio >300 mg/g. Novel lipid risk factors, low‐density lipoprotein (LDL) triglyceride (TG) and small dense LDL cholesterol were measured using our established homologous assay.
Results
The proportion of atherosclerotic cardiovascular disease patients was higher in non‐proteinuric DKD and even higher in proteinuric DKD than in non‐DKD. Increased estimated glomerular filtration rate grade and albuminuric stage were independently correlated with higher TG, TG‐rich lipoprotein cholesterol and apolipoprotein CIII. Therefore, proteinuric DKD had the highest of these levels. Small dense LDL cholesterol and LDL‐TG were higher in the proteinuria without renal dysfunction group in the lipid‐lowering drug‐free subset. Lipoprotein(a) was higher in DKD regardless of proteinuria.
Conclusions
Proteinuria was associated with an atherogenic subspecies of LDL, whereas renal dysfunction was associated with increased lipoprotein(a). Proteinuria and renal dysfunction independently exacerbated TG‐rich lipoprotein‐related dyslipidemia. This is in good agreement with the results of large‐scale clinical studies in which proteinuria and renal dysfunction synergistically increased the risk of atherosclerotic cardiovascular disease in populations with diabetes.
Keywords: Diabetic kidney disease, Low‐density lipoprotein triglycerides, Small dense low‐density lipoprotein cholesterol
Both proteinuria and renal dysfunction were deeply involved in the diversity and severity of dyslipidemia associated with diabetic kidney disease.
INTRODUCTION
The incidence of atherosclerotic cardiovascular disease (ASCVD) increases significantly with the progression of chronic kidney disease (CKD) 1 . There are many possible mechanisms by which ASCVD develops in CKD, but dyslipidemia is also deeply involved 2 , 3 , 4 . The plasma lipid profile changes significantly as CKD progresses 3 , 5 , and increased triglyceride (TG) and low‐density lipoprotein (LDL) cholesterol (C), and decreased high‐density lipoprotein (HDL)‐C have each been shown to be at risk for ASCVD in CKD patients 4 , 6 . Conversely, administration of lipid‐lowering drugs, such as statins and ezetimibe, resulted in significant suppression of ASCVD events in CKD patients 7 . Diabetic kidney disease (DKD) is a part of CKD and substantially increases the incidence of ASCVD, because diabetes itself is high risk 8 , and DKD causes diverse and severe dyslipidemia 9 , 10 . DKD is a concept that includes typical diabetic nephropathy and atypical diabetes‐related renal disease in which glomerular filtration rate (GFR) is reduced without proteinuria 11 , 12 , 13 . Although there are many reports investigating dyslipidemia in diabetic nephropathy, few reports are available for dyslipidemia with different DKD phenotypes.
LDL consists of heterologous particles with different sizes and densities 14 . It is well recognized that small dense (sd)LDL particles are more atherogenic than large buoyant (lb)LDL particles 10 , 14 . Our group has established a fully automated assay kit for quantifying sdLDL‐C levels 15 , and this assay system was used in famous cohort studies, such as in the community atherosclerosis risk (ARIC) study and the Hisayama study 16 , 17 . All studies have consistently shown that sdLDL‐C is superior to LDL‐C in predicting ASCVD. We have previously reported an increase in sdLDL‐C in patients with diabetic nephropathy 18 , but have not investigated the independent effect of proteinuria or renal dysfunction on sdLDL‐C. We also established a fully automated LDL‐TG assay kit 19 , and several studies have shown that LDL‐TG levels measured by this kit can predict ASCVD beyond LDL‐C 20 , 21 , 22 . Few studies have examined LDL‐TG levels in DKD patients. The present study investigated how proteinuria and renal dysfunction independently affect conventional and novel lipid risk factors in patients with diabetes.
METHODS
Participants
The participants in the present study (n = 1,073) were participants in the "ViNA" cohort study to investigate the prognosis of diabetes patients at Ebina General Hospital, Ebina City, Japan 23 . The ViNA cohort began on October 2019, and carried out regular tests, assessment of diabetic complications and prognostic surveys. The participants were all diabetes patients aged 30–89 years who had been continuously treated for over a year. Exclusion criteria were patients with malignancies currently being treated; patients with severe hepatic, endocrine and respiratory disorders; and patients undergoing hemodialysis. This present study was a cross‐sectional study using baseline measurements from the ViNA cohort. The blood and urine samples were collected from October 2019 to September 2020. Participant characteristics were listed in Table 1. A total of 232 (21%) patients were insulin users (27 type 1 diabetes and 205 type 2 diabetes). Most participants with type 2 diabetes (n = 874) were treated with the following hypoglycemic agents alone or in combination: a sulfonylurea, metformin, pioglitazone, dipeptidase peptidase‐4 inhibitor, sodium–glucose cotransporter 2 inhibitor, α‐glucosidase inhibitor or glucagon‐like peptide‐1 receptor agonist. The majority of hypertensive patients (n = 641) used antihypertensive drugs, such as calcium channel blockers, angiotensin II receptor blockers, diuretics, or beta‐blockers alone or in combination. Participants with hyperlipidemia were treated with statins (n = 590), ezetimibe (n = 73), fibrates (n = 75), or omega‐3 fatty acids (n = 39) alone or in combination (total n = 674). All patients were taught an appropriate diet proposed by the Japan Diabetes Foundation by a dietitian.
Table 1.
Characteristics and measurements of the subjects stratified by chronic kidney disease grade
| Total subjects | CKD grade | ||||
|---|---|---|---|---|---|
| G1–2 (eGFR ≥60) | G3 (30 ≤ eGFR < 60) | G4–5 (eGFR <30) | P trend | ||
| n (male/female) | 1073 (672/401) | 776 (470/306) | 272 (187/85) | 25 (15/10) | |
| Male | 672 (62.6%) | 470 (60.6%) | 187 (68.8%) | 15 (60.0%) | NS |
| Age (years) | 67.1 (11.0) | 65.0 (11.1) | 72.7 (8.1) | 70.7 (10.2) | <0.0001 |
| Duration of diabetes (years) | 14.0 (8.0) | 14.0 (8.0) | 16.0 (9.0) | 14.0 (8.0) | <0.0001 |
| Coronary heart disease, n (%) | 117 (10.9%) | 62 (8.0%) | 45 (16.5%) | 10 (40.0%) | <0.0001 |
| Cerebrovascular disease, n (%) | 90 (8.4%) | 50 (6.4%) | 36 (13.2%) | 4 (16.0%) | 0.0002 |
| Type 1 diabetes, n (%) | 27 (2.5%) | 22 (2.8%) | 5 (1.8%) | 0 (0.0%) | ns |
| Insulin, n (%) | 228 (21.2%) | 150 (19.3%) | 69 (25.4%) | 9 (36.0%) | 0.0062 |
| No. OADs | 2 (0–6) | 2 (0–6) | 2 (0–4) | 1 (0–3) | – |
| BMI | 25.2 (4.1) | 25.2 (4.3) | 25.0 (3.7) | 25.4 (3.6) | NS |
| SBP (mmHg) | 132 (14) | 132 (14) | 132 (15) | 134 (13) | NS |
| DBP (mmHg) | 77 (12) | 79 (12) | 75 (11) | 73 (11) | <0.0001 |
| UACR (mg/creatine g) | 16.2 [6.8–51.7] | 12.8 [5.8–37.2] | 28.2 [10.0–123.8] | 397.8 [161.1–1204.0] | <0.0001 |
| Serum albumin (g/dL) | 4.4 (0.3) | 4.4 (0.3) | 4.3 (0.3) | 4.1 (0.4) | 0.0002 |
| HbA1c (%) | 7.4 (0.9) | 7.4 (0.9) | 7.4 (0.8) | 7.3 (1.2) | NS |
| FPG (mg/dL) | 149 (39) | 148 (37) | 150 (43) | 152 (53) | NS |
| Statins (n,%) | 590 (55.0%) | 416 (53.6%) | 156 (57.4%) | 18 (72.0%) | NS |
| Other hypolipidemic agents (n, %) | 154 (14.4%) | 103 (13.3%) | 44 (16.2%) | 7 (28.0%) | 0.0428 |
| Lipid‐lowering agents (n, %) | 674 (62.8%) | 475 (61.2%) | 180 (66.2%) | 19 (76.0%) | 0.0497 |
| TC (mg/dL) | 182 (31) | 182 (29) | 181 (34) | 174 (45) | ns |
| HDL‐C (mg/dL) | 54 (14) | 55 (14) | 53 (14) | 46 (10) | 0.0141 |
| nonHDL‐C (mg/dL) | 127 (28) | 127 (26) | 127 (32) | 128 (38) | NS |
| LDL‐C (mg/dL) | 102 (24) | 103 (23) | 101 (27) | 96 (30) | NS |
| LDL‐TG (mg/dL) | 14.5 [11.9–17.4] | 14.5 [11.7–17.3] | 14.8 [12.2–17.9] | 13.6 [11.7–18.9] | NS |
| LDL‐TG/LDL‐C | 0.14 [0.12–0.18] | 0.14 [0.12–0.18] | 0.15 [0.12–0.19] | 0.16 [0.12–0.19] | 0.0098 |
| sdLDL‐C (mg/dL) | 28.0 [21.3–38.1] | 28.2 [21.6–38.0] | 28.1 [20.6–38.9] | 23.9 [17.0–32.7] | NS |
| sdLDL‐C/LDL‐C | 0.28 [0.22–0.36] | 0.27 [0.22–0.36] | 0.29 [0.22–0.37] | 0.25 [0.21–0.32] | NS |
| lbLDL‐C (mg/dL) | 71 (21) | 71 (20) | 70 (22) | 68 (24) | NS |
| TG (mg/dL) | 104 [76–149] | 101 [72–146] | 112 [85–157] | 126 [105–154] | 0.0003 |
| TRL‐C (mg/dL) | 23 [18–29] | 22 [18–28] | 24 [19–32] | 29 [21–37] | 0.0050 |
| ApoB (mg/dL) | 87 (18) | 87 (17) | 88 (20) | 90 (23) | NS |
| ApoCIII (mg/dL) | 10.4 [8.3–12.9] | 10.0 [8.1–12.6] | 11.2 [8.7–14.0] | 12.0 [10.1–14.3] | <0.0001 |
| ApoE (mg/dL) | 4.1 (1.3) | 4.1 (1.3) | 4.2 (1.3) | 4.0 (1.3) | NS |
| Lipoprotein(a) (mg/dL) | 13.0 [6.2–24.8] | 12.0 [5.8–22.3] | 15.6 [7.0–31.0] | 26.1 [6.7–44.8] | 0.0002 |
Data are presented as number and percentage, mode and range, mean ± standard deviation, or median with interquartile range. The P trend was estimated by the Cochran–Armitage trend test for categorical variables or Jonckheere–Terpstra trend test for continuous variables. Apo, apolipoprotein; BMI, body mass index; CCB, calcium channel blocker; CKD, chronic kidney disease; DBP, diastolic blood pressure; eGFR, estimated glomerular filtration rate; FPG, fasting plasma glucose; GLP‐1RA, glucagon‐like peptide 1 receptor agonists; HbA1c, glycated hemoglobin; HDL, high‐density lipoprotein cholesterol; lbLDL, large buoyant low‐density lipoprotein cholesterol; LDL, low‐density lipoprotein; NS, not significant; OADs, oral antidiabetes drugs; sdLDL, small dense low‐density lipoprotein; SBP, systolic blood pressure; TC, total cholesterol; TG, triglycerides; TRL, triglyceride‐rich lipoprotein; UACR, urinary albumin‐to‐creatinine ratio.
DKD classification
GFR was estimated from calibrated serum creatinine using the Chronic Kidney Disease Epidemiology Collaboration equation 24 . Renal function was assessed by estimated (e)GFR, and classified into CKD grade (G) 1–2 (<60 mL/min/1.73 m2), G3 (59–30 mL/min/1.73 m2) and G4 + 5 (<30 mL/min/1.73 m2) 25 . In the ViNA cohort, patients receiving dialysis were excluded. The general concept of CKD includes albuminuria. However, for convenience this time, CKD was used only for renal dysfunction and did not contain albuminuria. The albuminuric stage was assessed by the urinary albumin‐to‐creatinine ratio (UACR) and classified into A1, normoalbuminuria <30 mg/g; A2, microalbuminuria (30–300 mg/g); and A3, macroalbuminuria (>300 mg/g) 25 . Proteinuria alone was defined as UACR >300 mg/g and eGFR >60 mL/min/1.73 m2. Non‐proteinuric DKD was defined as UACR <300 mg/g and eGFR <60 mL/min/1.73 m2. Proteinuric DKD was defined as UACR >300 mg/g and eGFR <60 mL/min/1.73 m2 12 .
Lipid measurements
Plasma samples were taken in the morning after overnight fasting. LDL‐TG and sdLDL‐C concentrations were measured directly in plasma by the homogeneous method established by our group 15 , 19 . All blood samples, including LDL‐TG and sdLDL‐C, were immediately measured with an automated analyzer without storage in the refrigerator. The principles of these assays have been fully explained previously 15 , 19 . LbLDL‐C was calculated by subtracting sdLDL‐C from LDL‐C 16 , 19 , nonHDL‐C was calculated by subtracting HDL‐C from total‐C (TC), and TG‐rich lipoprotein (TRL)‐C was calculated by subtracting LDL‐C and HDL‐C from TC 26 . Apolipoproteins (Apo), lipoprotein(a) (Lp[a]) and albumin were measured by commercially available test kits. C‐peptide was measured by commercially available enzyme‐linked immunosorbent assay kit.
The study complied with the principal of the Declaration of Helsinki. The study was detailed to all individuals who consented to participate, and a written informed consent form was obtained from all participants before the study. This study was approved by the Ethics Committee of Ebina General Hospital.
Statistical analysis
Categorical variables were expressed as the number and percentage of participants or as the mode and range. Continuous variables were expressed as the mean ± standard deviation or as the median with the interquartile range. The P trend was estimated by the Cochran–Armitage trend test for categorical variables or Jonckheere–Terpstra trend test for continuous variables. Significance between groups was evaluated by the χ2‐test or anova and post‐hoc Tukey–Kramer's honestly significant difference test. Correlations between variables were evaluated with Pearson correlation analysis. Multivariate linear regression was used to analyze the effects of log‐UACR or eGFR on other related factors. For non‐normally distributed variables, logarithmic transformation was carried out before anova, post‐hoc, correlation and linear regression. A P‐value <0.05 was considered statistically significant. Analyses were carried out using JMP software version 15 (SAS Institute, Cary, NC, USA).
RESULTS
Table 1 shows the characteristics and measurements of the participants stratified by CKD grade. Age was younger in G1 + 2 than in G3 and G4 + 5. The higher the CKD grade, the higher number of patients with coronary heart disease and cerebrovascular disease (CVD). The mean duration of diabetes in the total participants was 14 years, and slightly longer in G3 participants. Use of insulin was more common among patients in severe CKD grades. There was no significant difference in the use of oral antidiabetes drugs among the three groups. Body mass index and systolic blood pressure showed no difference among the groups, whereas diastolic blood pressure was lower and the antihypertensive drug rate was higher depending on the CKD stage (data not shown). UACR was significantly higher in the G4 + 5 group, but serum albumin was comparable among the groups. Glycemic control was comparable among the groups. The number of statin users was similar among the groups, but users of other lipid‐lowering drugs were more prevalent in the severe stage of CKD. TC, LDL‐C, nonHDL‐C, LDL‐TG, sdLDL‐C, lbLDL‐C, ApoB and ApoE were similar among the groups, but HDL‐C decreased with CKD grade. TG, TRL‐C, ApoCIII, Apo Lp(a) levels and LDL‐TG/LDL‐C increased with CKD grade.
Participants background and measurements stratified by stage of albuminuria are shown in Table 2. Similar to CKD grading, advanced albuminuria was associated with a higher prevalence of coronary heart disease and CVD, higher percentage of insulin and antihypertensive drug users, and higher systolic blood pressure. eGFR decreased with increasing albuminuric stage, but serum albumin levels were unchanged. Glycemic control was comparable among the groups. Users of statins and other lipid‐lowering drugs were similar among the groups. TC, LDL‐C, nonHDL‐C, HDL‐C, LDL‐TG and sdLDL‐C levels were similar among the groups. TG, TRL‐C and ApoCIII levels increased in the A3 group, but ApoB, ApoE and Lp (a) did not change. LDL‐TG/LDL‐C and sdLDL‐C/LDL‐increased with increasing albuminuric stage.
Table 2.
Characteristics and laboratory measurements of subjects stratified by albuminuric stage
| Normoalbuminuria | Microalbminuria | Macroalbuminuria | P trend | |
|---|---|---|---|---|
| A1 (<30 mg/g Cr) | A2 (30–300 mg/g Cr) | A3 (≥300 mg/hg Cr) | ||
| n (male/female) | 696 (444/252) | 284 (171/113) | 93 (57/36) | |
| Male | 444 (63.8%) | 171 (60.2%) | 57 (61.3%) | NS |
| Age (years) | 65.6 (11.4) | 69.9 (9.7) | 69.9 (9.3) | <0.0001 |
| Coronary heart disease, n (%) | 59 (8.5%) | 41 (14.4%) | 17 (18.3%) | 0.0003 |
| Cerebrovascular disease, n (%) | 44 (6.3%) | 33 (11.6%) | 13 (14.0%) | 0.0009 |
| Type 1 diabetes, n (%) | 18 (2.6%) | 8 (2.8%) | 1 (1.1%) | NS |
| Insulin, n (%) | 135 (19.4%) | 63 (22.2%) | 30 (32.3%) | 0.0077 |
| No. OADs | 2 (0–6) | 2 (0–5) | 2 (0–5) | – |
| BMI | 25.1 (4.1) | 25.2 (4.3) | 25.7 (3.8) | NS |
| SBP (mmHg) | 130 (14) | 135 (14) | 139 (14) | <0.0001 |
| DBP (mmHg) | 78 (11) | 77 (11) | 78 (14) | NS |
| eGFR | 73.5 (17.3) | 68.6 (22.4) | 57.1 (24.0) | <0.0001 |
| Serum albumin (g/dL) | 4.4 (0.3) | 4.4 (0.3) | 4.2 (0.4) | NS |
| HbA1c (%) | 7.3 (0.8) | 7.5 (0.9) | 7.5 (1.1) | NS |
| FPG (mg/dL) | 147 (39) | 151 (38) | 155 (44) | NS |
| Statins, n (%) | 379 (54.5%) | 149 (52.5%) | 62 (66.7%) | NS |
| Other hypolipidemic agents, n (%) | 96 (13.8%) | 42 (14.8%) | 16 (17.2%) | NS |
| Lipid‐lowering agents, n (%) | 434 (62.4%) | 174 (61.3%) | 66 (71.0%) | NS |
| TC (mg/dL) | 182 (29) | 179 (33) | 185 (35) | NS |
| HDL‐C (mg/dL) | 55 (14) | 54 (14) | 51 (15) | NS |
| nonHDL‐C (mg/dL) | 127 (26) | 125 (30) | 133 (34) | NS |
| LDL‐C (mg/dL) | 103 (23) | 100 (26) | 102 (24) | NS |
| LDL‐TG (mg/dL) | 14.5 [11.9–17.1] | 14.4 [11.8–17.8] | 15.7 [11.9–20.7] | NS |
| LDL‐TG/LDL‐C | 0.14 [0.12–0.18] | 0.15 [0.12–0.19] | 0.15 [0.12–0.20] | 0.0038 |
| sdLDL‐C (mg/dL) | 27.7 [21.3–37.1] | 28.2 [19.9–38.2] | 31.2 [22.3–43.9] | NS |
| sdLDL‐C/LDL‐C | 0.27 [0.22–0.35] | 0.28 [0.22–0.37] | 0.30 [0.25–0.43] | 0.0085 |
| lbLDL‐C (mg/dL) | 72 (20) | 68 (22) | 66 (22) | 0.0003 |
| TG (mg/dL) | 103 [73–145] | 106 [76–150] | 123 [89–196] | 0.0039 |
| TRL‐C (mg/dL) | 23 [18–29] | 23 [18–29] | 27 [21–37] | 0.0157 |
| ApoB (mg/dL) | 87 (17) | 87 (20) | 93 (22) | NS |
| ApoCIII (mg/dL) | 10.1 [8.2–12.3] | 10.8 [8.4–13.7] | 12.0 [9.9–15.1] | <0.0001 |
| ApoE (mg/dL) | 4.1 (1.2) | 4.2 (1.3) | 4.5 (1.7) | NS |
| Lipoprotein(a) (mg/dL) | 12.6 [5.9–24.5] | 14.7 [7.0–24.8] | 12.6 [3.8–30.2] | NS |
Data are presented as number and percentage, mode and range, mean ± standard deviation or median with interquartile range. The P trend was estimated by the Cochran–Armitage trend test for categorical variables or Jonckheere–Terpstra trend test for continuous variables. Apo, apolipoprotein; BMI, body mass index; C, cholesterol; DBP, diastolic blood pressure; eGFR, estimated glomerular filtration rate; FPG, fasting plasma glucose; GLP‐1RA, glucagon‐like peptide 1 receptor agonists; HbA1c, glycated hemoglobin; HDL, high‐density lipoprotein cholesterol; lbLDL, large buoyant low‐density lipoprotein cholesterol; LDL, low‐density lipoprotein; NS, not significant; OADs, oral antidiabetes drugs; sdLDL, small dense low‐density lipoprotein; SBP, systolic blood pressure; TC, total cholesterol; TG, triglycerides; TRL, triglyceride‐rich lipoprotein; UACR, urinary albumin‐to‐creatinine ratio.
In the DKD phenotype with proteinuria and CKD combined, participants with CKD were older than participants without CKD, and the number of coronary heart disease and CVD patients was higher in proteinuria alone or non‐proteinuric DKD, and even higher in proteinuric DKD (Table 3). Glycemic control was comparable among the groups. Users of statins and other lipid‐lowering drugs were more frequent with proteinuric DKD. TC, LDL‐C, nonHDL‐C, LDL‐TG and sdLDL‐C levels were comparable, but HDL‐C was lower in proteinuric DKD. TG, TRL‐C and ApoCIII levels were increased in proteinuria alone and non‐proteinuric DKD, and further increased in proteinuric DKD. ApoE increased in the proteinuria alone group, whereas Lp(a) increased in DKD regardless of proteinuria.
Table 3.
Characteristics and laboratory measurements of subjects stratified by proteinuria and chronic kidney disease
| Proteinuria | Non‐proteinuria | Proteinuria | Non‐proteinuria | Proteinuria | P * |
|---|---|---|---|---|---|
| CKD | Non‐CKD | Non‐CKD | CKD | CKD | |
| DKD phenotype | Non‐DKD | Proteinuria alone | Nonproteinuric DKD | Proteinuric DKD | |
| n (male/female) | 734 (445/289) | 42 (25/17) | 236 (163/73) | 61 (39/22) | |
| Male | 445 (60.6%) | 25 (59.5%) | 163 (69.1%) | 39 (63.9%) | NS |
| Age (years) | 64.8 (11.2) | 68.4 (8.9) | 72.8 (8.0) † | 71.6 (9.4) † | <0.0001 |
| Coronary heart disease, n (%) | 57 (7.8%) | 5 (11.9%) | 39 (16.5%) | 16 (26.2%) | <0.0001 |
| Cerebrovascular disease, n (%) | 45 (6.1%) | 5 (11.9%) | 30 (12.7%) | 10 (16.4%) | 0.0018 |
| Type 1 diabetes, n (%) | 22 (3.0%) | 0 (0.0%) | 4 (1.7%) | 1 (1.6%) | NS |
| Insulin, n (%) | 140 (19.1%) | 10 (23.8%) | 55 (23.3%) | 23 (37.7%) | 0.0096 |
| No. OADs | 2 (0–6) | 2 (0–5) | 2 (0–4) | 2 (0–4) | NS |
| BMI | 25.2 (4.3) | 25.9 (4.5) | 24.9 (3.7) | 25.4 (3.4) | NS |
| SBP (mmHg) | 131 (14) | 140 (16) † , § | 131 (14) ‡ , ¶ | 137 (14) † , § | <0.0001 |
| DBP (mmHg) | 78 (11) | 81 (15) § | 74 (11) † , ‡ | 75 (12) | <0.0001 |
| UACR | 11.7 [5.5–29.3] | 657.7 [346.8–905.7] † , § | 21.9 [8.2–53.3] † , ‡ , ¶ | 697.0 [371.8–1956.5] † , § | <0.0001 |
| eGFR | 79.7 (15.1) | 79.4 (12.5) § , ¶ | 50.4 (7.4) † , ‡ , ¶ | 36.5 (13.1) † , ‡ , § | <0.0001 |
| Serum albumin (g/dL) | 4.4 (0.3) | 4.4 (0.4) | 4.3 (0.3) † | 4.1 (0.5) † , ‡ , § | <0.0001 |
| HbA1c (%) | 7.4 (0.9) | 7.7 (1.2) | 7.4 (0.9) | 7.4 (0.9) | NS |
| FPG (mg/dL) | 148 (37) | 164 (44) † | 151 (44) | 148 (43) | 0.0435 |
| C‐peptide (ng/mL) | 1.2 [0.8–1.7] | 1.4 [1.0–1.8] | 1.4 [1.0–2.2] † | 1.8 [1.0–2.7] † | <0.0001 |
| Statins, n (%) | 393 (53.5%) | 23 (54.8%) | 127 (53.8%) | 47 (77.0%) | 0.0035 |
| Other hypolipidemic agents, n (%) | 99 (13.5%) | 4 (9.5%) | 37 (15.7%) | 14 (23.0%) | ns |
| Lipid‐lowering agents, n (%) | 449 (61.2%) | 26 (61.9%) | 150 (63.6%) | 49 (80.3%) | 0.0210 |
| TC (mg/dL) | 182 (29) | 189 (33) | 179 (34) | 182 (39) | NS |
| HDL‐C (mg/dL) | 55 (14) | 54 (15) | 53 (14) | 49 (14) † | 0.0029 |
| nonHDL‐C (mg/dL) | 127 (26) | 135 (33) | 126 (32) | 132 (36) | NS |
| LDL‐C (mg/dL) | 103 (23) | 105 (23) | 101 (28) | 100 (26) | NS |
| LDL‐TG (mg/dL) | 14.5 [11.7–17.1] | 15.7 [11.8–21.0] | 14.7 [12.2–17.8] | 14.3 [11.9–19.5] | NS |
| LDL‐TG/LDL‐C | 0.14 [0.12–0.18] | 0.14 [0.12–0.19] | 0.15 [0.12–0.19] † | 0.16 [0.12–0.20] | 0.0092 |
| sdLDL‐C (mg/dL) | 28.0 [21.5–37.8] | 31.4 [22.8–45.1] | 27.7 [20.0–37.2] | 29.2 [21.8–42.4] | NS |
| sdLDL‐C/LDL‐C | 0.27 [0.22–0.36] | 0.28 [0.25–0.44] | 0.28 [0.22–0.36] | 0.29 [0.23–0.43] | NS |
| lbLDL‐C (mg/dL) | 71 (20) | 67 (23) | 70 (22) | 66 (22) | NS |
| TG (mg/dL) | 100 [71–145] | 114 [81–193] † | 110 [82–149] ¶ | 133 [97–196] † , § | <0.0001 |
| TRL‐C (mg/dL) | 22 [17–28] | 24 [19–29] † | 24 [18–30] ¶ | 30 [23–38] † , § | <0.0001 |
| ApoB (mg/dL) | 87 (17) | 93 (21) | 87 (20) | 92 (23) | 0.0306 |
| ApoCIII (mg/dL) | 10.0 [8.1–12.5] | 10.9 [9.7–13.8] † | 10.8 [8.6–13.5] † , ¶ | 13.2 [10.3–16.3] † , § | <0.0001 |
| ApoE (mg/dL) | 4.1 (1.2) | 4.7 (2.0) † , § | 4.1 (1.3) ‡ | 4.3 (1.4) | 0.0213 |
| Lipoprotein(a) (mg/dL) | 12.2 [5.9–22.7] | 8.8 [2.7–18.5] § , ¶ | 15.4 [7.3–30.6] † , ‡ | 18.1 [6.5–41.5] ‡ | 0.0006 |
Data are presented as number and percentage, mode and range, mean ± standard deviation or median with interquartile range.
Apo, apolipoprotein; BMI, body mass index; C, cholesterol; DBP, diastolic blood pressure; eGFR, estimated glomerular filtration rate; FPG, fasting plasma glucose; GLP‐1RA, glucagon‐like peptide 1 receptor agonists; HbA1c, glycated hemoglobin; HDL, high‐density lipoprotein cholesterol; lbLDL, large buoyant low‐density lipoprotein cholesterol; LDL, low‐density lipoprotein; NS, not significant; OADs, oral antidiabetes drugs; sdLDL, small dense low‐density lipoprotein; SBP, systolic blood pressure; TC, total cholesterol; TG, triglycerides; TRL, triglyceride‐rich lipoprotein; UACR, urinary albumin‐to‐creatinine ratio.
Significance between groups was evaluated by χ2‐test or anova and post‐hoc Tukey–Kramer's honestly significant difference test. For non‐normally distributed variables, logarithmic transformation was performed before anova and post‐hoc test.
P < 0.05 versus non‐diabetic kidney disease (DKD) group,
P < 0.05 versus proteinuria alone group,
P < 0.05 versus nonproteinuric DKD group,
P < 0.05 versus proteinuric DKD group by Tukey–Kramer's HSD test.
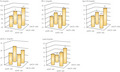
Figure 1 shows the TG, TRL‐C, ApoCIII, sdLDL‐C and Lp(a) values in the groups classified by CKD and proteinuria selected from the data in Table 3. TG, TRL‐C and ApoCIII levels were synergistically elevated by proteinuria and CKD. Lp(a) levels increased in CKD patients regardless of proteinuria, and sdLDL‐C levels tended to increase in proteinuric patients regardless of CKD.
Figure 1.

Plasma lipid levels in the groups classified by chronic kidney disease and proteinuria. Significances between groups were evaluated by Tukey–Kramer's honestly significant difference test. Proteinuria was defined as macroalbuminuria (urinary albumin‐to‐creatinine ratio [UACR] >300 mg/g), and chronic kidney disease was defined as reduced estimated glomerular filtration rate (eGFR; <60 mL/min/1.73 m2). Non‐diabetic kidney disease (DKD): UACR <300 mg/g and eGFR >60 mL/min/1.73 m2, proteinuria alone: UACR >300 mg/g and eGFR >60 mL/min/1.73 m2, non‐proteinuric DKD: UACR <300 mg/g and eGFR <60 mL/min/1.73 m2, proteinuric DKD: UACR >300 mg/g and eGFR <60 mL/min/1.73 m2. a P < 0.05 versus non‐DKD group, b P < 0.05 versus proteinuria alone group, c P < 0.05 versus non‐proteinuric DKD group and d P < 0.05 versus proteinuric DKD group. ApoCIII, apolipoprotein CIII; Lp(a), lipoprotein(a); sdLDL‐C, small dense low‐density lipoprotein cholesterol; TG, triglycerides; TRL‐C, triglyceride‐rich lipoprotein cholesterol.
As shown in Table 4, eGFR or log‐transformed UACR were positively correlated with age, body mass index, systolic blood pressure, glycated hemoglobin (HbA1c) and fasting plasma glucose (FPG), whereas they were negatively correlated with eGFR and serum albumin in univariate analysis. Log‐UACR correlated with log‐LDL‐TG, log‐LDL‐TG/LDL‐C, log‐sdLDL‐C/LDL‐C, log‐TG, log‐TRL‐C, ApoB, log‐apoCIII and ApoE, whereas is was negatively correlated with HDL‐C and lbLDL‐C. eGFR was positively correlated with HDL‐C, log‐sdLDL‐C, log‐TG, log‐TRL‐C and log‐LDL‐TG, where as it was negatively correlated with log‐ApoCIII and log‐Lp(a). Multivariate analysis showed that log‐UACR and eGFR were independently associated with HDL‐C, log‐TG, log‐TRL‐C and ApoCIII when age, body mass index and HbA1c were adjusted (model 1). LDL‐C, log‐LDL‐TG, log‐LDL‐TG/LDL‐C, log‐sdLDL‐C/ LDL‐C and lbLDL‐C were only associated with log‐UACR, whereas log‐Lp(a) was only associated with eGFR. In model 2, log‐UACR and eGFR were independently associated with lbLDL‐C, log‐TG, log‐TRL‐C, ApoB and log‐ApoCIII. Log‐LDL‐TG, log‐LDL‐TG/LDL‐C and log‐sdLDL‐C/LDL‐C were only associated with log‐UACR, whereas TC, nonHDL‐C and log‐Lp(a) were only associated with eGFR.
Table 4.
Relationship between estimated glomerular filtration rate or log transformed urinary albumin‐creatinine ratio and various parameters
| Univariate (crude) | log_UACR | eGFR | Multivariate (adjusted) | log_UACR | eGFR | ||||
|---|---|---|---|---|---|---|---|---|---|
| r | P | r | P | β | P | β | P | ||
| Age | 0.2400 | <0.0001 | −0.4677 | <0.0001 | Model 1 † | ||||
| BMI | 0.0647 | 0.0341 | 0.0872 | 0.0042 | TC | −0.0133 | NS | 0.0018 | NS |
| SBP | 0.2494 | <0.0001 | −0.0126 | NS | HDL−C | −0.0753 | 0.0171 | 0.0807 | 0.0051 |
| DBP | −0.0151 | NS | 0.1901 | <0.0001 | nonHDL−C | 0.0105 | NS | −0.0306 | NS |
| log‐UACR | – | – | −0.2578 | <0.0001 | LDL−C | −0.0661 | 0.0238 | 0.0199 | NS |
| eGFR | −0.2578 | <0.0001 | – | – | log_LDL−TG | 0.0802 | 0.0068 | −0.0273 | NS |
| Serum albumin | −0.1102 | 0.0003 | 0.1842 | <0.0001 | log_LDL−TG/LDL−C | 0.1285 | <0.0001 | −0.0504 | NS |
| HbA1c | 0.1039 | 0.0007 | 0.1019 | 0.0008 | log_sdLDL−C | 0.0531 | NS | 0.0222 | NS |
| FPG | 0.0766 | 0.0120 | 0.0375 | NS | log_sdLDL−C/LDL−C | 0.1171 | <0.0001 | 0.0031 | NS |
| log_C‐peptide | 0.1095 | 0.0003 | −0.1602 | <0.0001 | lbLDL−C | −0.1364 | <0.0001 | 0.0113 | NS |
| TC | −0.0073 | NS | 0.0146 | NS | log_TG | 0.1463 | <0.0001 | −0.1207 | <0.0001 |
| HDL‐C | −0.0815 | 0.0076 | 0.0653 | 0.0325 | log_TRL−C | 0.1563 | <0.0001 | −0.1230 | <0.0001 |
| nonHDL‐C | 0.0244 | NS | −0.0136 | NS | ApoB | 0.0471 | NS | −0.0306 | NS |
| LDL‐C | −0.0589 | NS | 0.0405 | NS | log_ApoCIII | 0.1732 | <0.0001 | −0.1825 | <0.0001 |
| log_LDL‐TG | 0.1011 | 0.0009 | −0.0027 | NS | ApoE | 0.1068 | 0.0003 | 0.0099 | NS |
| log_LDL‐TG/LDL‐C | 0.1449 | <0.0001 | −0.0451 | NS | log_Lipoprotein(a) | 0.0037 | NS | −0.0782 | 0.0039 |
| log_sdLDL‐C | 0.0460 | NS | 0.0693 | 0.0233 | Model 2 ‡ | ||||
| log_sdLDL‐C/LDL‐C | 0.1018 | 0.0008 | 0.0463 | NS | TC | 0.0319 | NS | −0.0744 | 0.0067 |
| lbLDL‐C | −0.1189 | <0.0001 | −0.0019 | NS | HDL−C | −0.0299 | NS | 0.0156 | NS |
| log_TG | 0.1570 | <0.0001 | −0.0850 | 0.0054 | nonHDL−C | 0.0383 | NS | −0.0819 | 0.0021 |
| log_TRL‐C | 0.1783 | <0.0001 | −0.1383 | <0.0001 | LDL−C | −0.0300 | NS | −0.0393 | NS |
| ApoB | 0.0647 | 0.0345 | −0.0084 | NS | log_LDL−TG | 0.0609 | 0.0350 | −0.0335 | NS |
| log_ApoCIII | 0.1830 | <0.0001 | −0.1488 | <0.0001 | log_LDL−TG/LDL−C | 0.0840 | 0.0045 | −0.0125 | NS |
| ApoE | 0.1379 | <0.0001 | 0.0098 | NS | log_sdLDL−C | 0.0571 | NS | 0.0121 | NS |
| log_Lipoprotein(a) | 0.0208 | NS | −0.1132 | 0.0002 | log_sdLDL−C/LDL−C | 0.0958 | 0.0017 | 0.0338 | NS |
| lbLDL−C | −0.0996 | 0.0011 | −0.0565 | 0.0404 | |||||
| log_TG | 0.1136 | 0.0004 | −0.0745 | 0.0094 | |||||
| log_TRL−C | 0.1343 | <0.0001 | −0.1179 | <0.0001 | |||||
| ApoB | 0.0712 | 0.0156 | −0.0676 | 0.0108 | |||||
| log_ApoCIII | 0.1632 | <0.0001 | −0.1697 | <0.0001 | |||||
| ApoE | 0.1054 | 0.0003 | −0.0120 | NS | |||||
| log_Lipoprotein(a) | 0.0115 | NS | −0.0682 | 0.0101 | |||||
The Pearson correlation analysis and multivariate linear regression was used to analyze the effects of log‐urinary albumin‐to‐creatinine ratio (UACR) or estimated glomerular filtration rate (eGFR) on other related factors. For non‐normally distributed variables, logarithmic transformation was carried out before analysis.
Apo, apolipoprotein; C, cholesterol; DBP, diastolic blood pressure; FPG, fasting plasma glucose; GLP‐1RA, glucagon‐like peptide 1 receptor agonists; HDL, high‐density lipoprotein cholesterol; lbLDL, large buoyant low‐density lipoprotein cholesterol; LDL, low‐density lipoprotein; NS, not significant; OADs, oral antidiabetes drugs; sdLDL, small dense low‐density lipoprotein; TC, total cholesterol; TG, triglycerides; TRL, triglyceride‐rich lipoprotein.
Model 1: adjusted for age, sex, body mass index (BMI) and glycated hemoglobin (HbA1c).
Model 2 added the following parameters to model 1: systolic blood pressure (SBP), fasting plasma glucose (FPG), type of diabetes, past history of coronary heart disease and cardiovascular disease, and use of lipid‐lowering drugs.
Table 5 shows the characteristics and laboratory measurements of 399 participants excluding users of lipid‐lowering drugs stratified by proteinuria and CKD. General characteristics resembled the entire participants. TC, LDL‐C, nonHDL‐C and HDL‐C levels were similar among the groups. LDL‐TG and sdLDL‐C were increased in the proteinuria alone group. TG, ApoCIII and ApoE were increased in the proteinuria alone group, and ApoCIII was increased in the proteinuric DKD group. Lp(a) was increased in the proteinuric DKD group.
Table 5.
Characteristics and laboratory measurements of subjects excluding users of lipid‐lowering drugs stratified by proteinuria and chronic kidney disease
| Total participants | Non‐proteinuria | Proteinuria | Non‐proteinuria | Proteinuria | P * | |
|---|---|---|---|---|---|---|
| Non‐CKD | Non‐CKD | CKD | CKD | |||
| Non‐DKD | Proteinuria alone | Non‐proteinuric DKD | Proteinuric DKD | |||
| n (male/female) | 399 (279/120) | 285 (192/93) | 16 (10/6) | 86 (68/18) | 12 (9/3) | |
| Male | 279 (69.9%) | 192 (67.4%) | 10 (62.5%) | 68 (79.1%) | 9 (75.0%) | NS |
| Age (years) | 67.5 (12.0) | 65.3 (12.5) | 69.7 (9.1) | 73.1 (8.5) † | 75.6 (10.6) † | <0.0001 |
| Coronary heart disease, n (%) | 15 (3.8%) | 4 (1.4%) | 1 (6.3%) | 7 (8.1%) | 3 (25.0%) | 0.0010 |
| Cerebrovascular disease, n (%) | 27 (6.8%) | 16 (5.6%) | 0 (0.0%) | 10 (11.6%) | 1 (8.3%) | NS |
| Type 1 diabetes, n (%) | 17 (4.3%) | 15 (5.3%) | 0 (0.0%) | 2 (2.3%) | 0 (0.0%) | NS |
| Insulin, n (%) | 92 (23.1%) | 63 (22.1%) | 2 (12.5%) | 22 (25.6%) | 5 (41.7%) | NS |
| No. OADs | 2 (0–5) | 2 (0–5) | 2 (0–3) | 2 (0–4) | 1 (0–4) | NS |
| BMI | 24.4 (4.1) | 24.3 (4.1) | 25.3 (2.9) | 24.6 (4.2) | 24.9 (4.2) | NS |
| SBP (mmHg) | 132 (14) | 131 (15) | 140 (19) | 130 (12) | 136 (11) | NS |
| DBP (mmHg) | 78 (12) | 79 (12) | 85 (17) § , ¶ | 75 (10) ‡ | 70 (12) † , ‡ | 0.0007 |
| UACR | 13.7 [6.2–49.7] | 10.8 [5.4–30.4] | 662.5 [440.1–851.2] † , § | 22.6 [9.6–60.5] † , ‡ , ¶ | 786.3 [359.6–2169.9] † , § | <0.0001 |
| eGFR | 72.9 (20.4) | 80.5 (16.7) | 83.8 (12.8) § , ¶ | 51.5 (6.7) † , ‡ , ¶ | 30.8 (13.1) † , ‡ , § | <0.0001 |
| Serum albumin (g/dL) | 4.3 (0.3) | 4.3 (0.3) | 4.2 (0.3) | 4.2 (0.3) † | 4.2 (0.3) | 0.0053 |
| HbA1c (%) | 7.3 (0.9) | 7.3 (0.9) | 8 (1.6) † , § | 7.3 (0.8) ‡ | 7.2 (0.7) | 0.0244 |
| FPG (mg/dL) | 149 (42) | 147 (41) | 180 (53) † , ¶ | 152 (43) | 137 (35) ‡ | 0.0154 |
| C‐peptide (ng/mL) | 1.1 [0.7–1.6] | 1.1 [0.7–1.5] | 1.8 [1.1–2.2] | 1.3 [0.9–2.0] † | 1.2 [1.0–2.4] | 0.0011 |
| TC (mg/dL) | 191 (30) | 190 (28) | 203 (33) | 190 (34) | 198 (31) | NS |
| HDL‐C (mg/dL) | 56 (16) | 57 (16) | 54 (15) | 55 (15) | 51 (10) | NS |
| nonHDL‐C (mg/dL) | 135 (28) | 133 (25) | 149 (34) | 135 (34) | 147 (29) | NS |
| LDL‐C (mg/dL) | 110 (25) | 109 (23) | 118 (25) | 110 (30) | 117 (28) | NS |
| LDL‐TG (mg/dL) | 14.8 [11.7–17.3] | 14.4 [11.4–16.6] | 16.9 [14.0–21.6] † | 15.6 [12.9–18.7] | 16.5 [11.6–20.2] | 0.0065 |
| LDL‐TG/LDL‐C | 0.13 [0.11–0.17] | 0.13 [0.11–0.17] | 0.15 [0.12–0.20] | 0.14 [0.11–0.17] | 0.14 [0.12–0.16] | NS |
| sdLDL‐C (mg/dL) | 28.7 [21.6–39.3] | 27.7 [21.3–38.6] | 38.9 [30.4–49.1] † , § | 28.8 [21.2–40.2] ‡ | 30.5 [24.6–39.7] | 0.0295 |
| sdLDL‐C/LDL‐C | 0.26 [0.21–0.34] | 0.25 [0.20–0.34] | 0.32 [0.26–0.46] | 0.26 [0.21–0.35] | 0.27 [0.21–0.30] | NS |
| lbLDL‐C (mg/dL) | 78 (22) | 78 (21) | 73 (27) | 78 (23) | 85 (23) | NS |
| TG (mg/dL) | 100 [67–141] | 92 [63–132] | 134 [114–249] † | 110 [77–149] | 125 [106–147] | 0.0009 |
| TRL‐C (mg/dL) | 23 [17–30] | 22 [17–29] | 27 [19–32] | 23 [18–31] | 33 [23–36] | 0.0132 |
| ApoB (mg/dL) | 90 (18) | 89 (17) | 100 (22) | 91 (21) | 100 (18) | 0.0175 |
| ApoCIII (mg/dL) | 10.0 [8.0–12.3] | 9.4 [7.8–11.8] | 11.4 [9.9–13.7] † | 10.8 [8.6–13.0] | 12.6 [10.7–14.5] † | 0.0004 |
| ApoE (mg/dL) | 4.2 (1.2) | 4.3 (1.2) | 5.0 (1.6)c | 4.0 (1.3) ‡ | 4.2 (1.0) | 0.0236 |
| Lipoprotein (a) (mg/dL) | 12.5 [6.1–20.5] | 11.6 [5.8–19.5] | 7.0 [2.8–17.5] ¶ | 14.2 [6.8–25.2] | 18.0 [9.8–40.2] ‡ | 0.0144 |
Data are presented as number and percentage, mode and range, mean ± standard deviation or median with interquartile range.
Apo, apolipoprotein; BMI, body mass index; C, cholesterol; DBP, diastolic blood pressure; eGFR, estimated glomerular filtration rate; FPG, fasting plasma glucose; GLP‐1RA, glucagon‐like peptide 1 receptor agonists; HbA1c, glycated hemoglobin; HDL, high‐density lipoprotein cholesterol; lbLDL, large buoyant low‐density lipoprotein cholesterol; LDL, low‐density lipoprotein; NS, not significant; OADs, oral antidiabetes drugs; sdLDL, small dense low‐density lipoprotein; SBP, systolic blood pressure; TC, total cholesterol; TG, triglycerides; TRL, triglyceride‐rich lipoprotein; UACR, urinary albumin‐to‐creatinine ratio.
Significance between groups was evaluated by chi‐square test or anova and post‐hoc Tukey‐Kramer's honestly significant difference test. For non‐normally distributed variables, logarithmic transformation was performed before anova and post‐hoc test.
P < 0.05 versus non‐diabetic kidney disease (DKD) group,
P < 0.05 versus proteinuria alone group,
P < 0.05 versus non proteinuric DKD group,
P < 0.05 versus proteinuric DKD group by Tukey‐Kramer's honestly significant difference test.
DISCUSSION
Several studies have shown that plasma dyslipidemia is exacerbated in diabetes patients when accompanied by DKD 9 , 18 , 27 . Sacks et al 27 found that DKD was associated with high levels of plasma TG and low levels of HDL‐C in patients with type 2 diabetes who had good control of LDL‐C in a global study including 13 countries. However, it remains unclear to what extent proteinuria or renal dysfunction is involved in DKD‐induced dyslipidemia. The concept of DKD includes typical diabetic nephropathy with proteinuria and atypical DKD in the absence of proteinuria 11 , 12 , 13 , 25 . Therefore, DKD is an excellent model for investigating the apparent effects of proteinuria and renal dysfunction on dyslipidemia. According to a recent definition of DKD, proteinuria includes microalbuminuria, UACR >30 mg/g Cr. 13 . Nevertheless, in the present study, the conventional definition of DKD was used, which is the presence of UACR >300 mg/g in the presence of low eGFR (<60 mL/min/1.73 m2) 12 . The reason was to clarify the distinct role of proteinuria isolated from renal dysfunction for dyslipidemia. Furthermore, no significant differences in plasma lipid levels were seen between participants with normoalbuminuria and microalbuminuria, suggesting that microalbuminuria has limited clinical importance for dyslipidemia.
It is well known that the large amounts of proteinuria/hypoalbuminemia typically seen in primary nephrotic syndrome causes severe hypercholesterolemia. However, the majority of current proteinuric participants remained in the normal range of serum albumin. This might explain why they did not have high LDL‐C levels. Unlike LDL‐C, our previous study found that sdLDL‐C, a potent atherosclerotic LDL subspecies, was significantly elevated in diabetes patients with proteinuria 18 . In the previously mentioned study, there was no significant increase in sdLDL‐C in the proteinuria group, but a subset of participants, excluding lipid‐lowering drug users, had significantly higher levels of sdLDL‐C. Statins and fibrates significantly reduce sdLDL‐C levels 28 . Therefore, non‐significant changes in sdLDL‐C in total proteinuric patients seem to be greatly affected by lipid‐lowering drugs. Previous studies showed that the preponderance of sdLDL particles and high levels of sdLDL‐C are absent in diabetes patients undergoing hemodialysis 29 . Indeed, in the present study, a positive relationship was observed between worsening renal function and sdLDL‐C levels. Ikewaki et al. 30 showed that LDL particle (ApoB) production, including sdLDL particles, was significantly reduced in hemodialysis patients. Collectively, sdLDL‐C levels can be upregulated by proteinuria but downregulated by renal dysfunction. Renal dysfunction might rectify the increase in sdLDL‐C due to proteinuria, and as a result, proteinuric DKD might not have high sdLDL‐C. The sdLDL‐C/LDL‐C ratio reversely reflects the average LDL particle size 31 , and this ratio was increased with UACR, but not with eGFR. LDL size can be regulated in the opposite direction by proteinuria and renal dysfunction, as well as sdLDL‐C levels.
Another new lipid risk factor, LDL‐TG, was not increased in DKD patients. TG‐rich LDL is catabolized by the action of hepatic TG lipase 32 , and hepatic TG lipase has been reported to decrease in patients with end‐stage renal disease 33 . Therefore, it is unexpected that renal dysfunction did not affect LDL‐TG or TG enrichment of LDL. In contrast, with the exception of lipid‐lowering drug users, the proteinuria without renal dysfunction group was found to have high LDL‐TG. Proteinuria is associated with an increase in angiopoietin‐like protein‐4 34 , which might suppress TG lipolysis of LDL particles. Further study is required to elucidate this possibility.
Hypertriglyceridemia and low HDL‐C are prominent dyslipidemias in diabetic patients, and accompanied DKD often exacerbates them 9 , 10 , 27 . ApoCIII is a key player in TRL metabolism by inhibiting the activity of lipoprotein lipase and the uptake of TRL particles into the liver, increasing the concentration of TRL and its remnants 35 . Previously, we showed that diabetes patients with proteinuria and those undergoing hemodialysis had high levels of ApoCIII 18 . Proteinuria and renal dysfunction independently and synergistically increased ApoCIII and TRL‐C levels. Recent clinical studies have shown that ApoCIII is causally associated with hypertriglyceridemia, and disruption of ApoCIII remarkably reduced plasma TG levels 36 . Ooi et al. 37 reported in a lipoprotein kinetics study that ApoCIII clearance from blood circulation was impaired in CKD patients, thereby increasing ApoCIII suppressed TRL removal. In a preclinical study, peroxisome proliferator‐activated receptor (PPAR)‐alpha in the liver was remarkably down‐regulated in CKD model mice 38 . Peroxisome proliferator‐activated receptor‐alpha is a master molecule for TG metabolism in the liver, and suppresses apoCIII production 39 . Therefore, suppression of peroxisome proliferator‐activated receptor‐alpha might be involved in the mechanisms of DKD‐induced dyslipidemia. Lp(a), a risk factor for atherothrombosis, increased with low eGFR and remarkably increased in patients with DKD. It has been reported that the clearance of Apo(a) is impaired in CKD, whereas nephrotic syndrome results in overproduction of Lp(a) 40 , 41 . The present proteinuric patients maintained normal levels of serum albumin, which might not promote production of LP(a).
There are several large‐scale clinical studies showing that proteinuria and renal dysfunction were independent risk factors for CV events, and these synergistically increased CV events and mortality 42 , 43 , 44 . Even baseline data from the present cohort study showed that the prevalence of ASCVD was increased in albuminuric stage or CKD grade, with the highest prevalence of ASCVD in proteinuric DKD. Therefore, a prospective study is required to determine if dyslipidemias of different DKD phenotypes are causally related to ASCVD events in our ViNA cohort studies.
The current research had limitations. First, the use of lipid‐lowering drugs had a significant impact on results and might underestimate the effects of kidney damage on plasma lipids. Second, the small number of proteinuric DKD patients and the exclusion of hemodialysis patients might weaken the assessment of statistical detectability between kidney damage and lipid parameters. Third, it is not possible to evaluate dyslipidemias as risk factors for ASCVD by a cross‐sectional study.
In conclusion, the present real‐world clinical study showed that both proteinuria and renal dysfunction were deeply involved in the diversity and severity of dyslipidemia. These dyslipidemias might explain a significant increase in the incidence of ASCVD in patients with proteinuric DKD.
DISCLOSURE
Tsutomu Hirano receives advisor fees from Denka Co, and lecture fees from Kowa Co. Noriyuki Satoh and Yasuki Ito are employees of Denka Co. The other authors declare no conflict of interest.
Ethical consideration: This study was approved by the Ethics Committee of Ebina General Hospital.
Informed consent: The study was detailed to all individuals who consented to participate, and a written informed consent form was obtained from all participants before the study.
Approval date of registry and the registration no. of the study/trial: Approval date: 11 September 2019, no 115, 2019.
Animal studies: N/A.
ACKNOWLEDGMENTS
We thank all the staff of the Clinical Laboratory Medicine Department of Ebina General Hospital for the sample analysis. This study was not supported by an industry.
J Diabetes Investig.2022; 13: 657–667
REFERENCES
- 1. Herzog CA, Asinger RW, Berger AK, et al. Cardiovascular disease in chronic kidney disease. A clinical update from Kidney Disease: Improving Global Outcomes (KDIGO). Kidney Int 2011; 80: 572–586. [DOI] [PubMed] [Google Scholar]
- 2. Keane WF, Tomassini JE, Neff DR. Lipid abnormalities in patients with chronic kidney disease: implications for the pathophysiology of atherosclerosis. J Atheroscler Thromb 2013; 20: 123–133. [DOI] [PubMed] [Google Scholar]
- 3. Shoji T, Abe T, Matsuo H, et al. Committee of renal and peripheral arteries, Japan Atherosclerosis Society: chronic kidney disease, dyslipidemia, and atherosclerosis. J Atheroscler Thromb 2012; 19: 299–315. [DOI] [PubMed] [Google Scholar]
- 4. Wanner C, Tonelli M. Kidney disease: improving global outcomes lipid guideline development work group members KDIGO clinical practice guideline for lipid management in CKD: summary of recommendation statements and clinical approach to the patient. Kidney Int 2014; 85: 1303–1309. [DOI] [PubMed] [Google Scholar]
- 5. Saland JM, Kupferman JC, Pierce CB, et al. Change in dyslipidemia with declining glomerular filtration rate and increasing proteinuria in children with CKD. J Am Soc Nephrol 2019; 14: 1711–1718. [DOI] [PMC free article] [PubMed] [Google Scholar]
- 6. Lamprea‐Montealegre JA, Staplin N, Herrington WG, et al. Apolipoprotein B, triglyceride‐rich lipoproteins, and risk of cardiovascular events in persons with CKD. Clin J Am Soc Nephrol 2020; 15: 47–60. [DOI] [PMC free article] [PubMed] [Google Scholar]
- 7. Baigent C, Landray MJ, Reith C, et al. The effects of lowering LDL cholesterol with simvastatin plus ezetimibe in patients with chronic kidney disease (Study of Heart and Renal Protection): a randomized placebo‐controlled trial. Lancet 2011; 377: 2181–2192. [DOI] [PMC free article] [PubMed] [Google Scholar]
- 8. Barkoudah E, Skali H, Uno H, et al. Mortality rates in trials of subjects with type 2 diabetes. J Am Heart Assoc 2012; 1: 8–15. [DOI] [PMC free article] [PubMed] [Google Scholar]
- 9. Shoji T, Emoto M, Kawagishi T, et al. Atherogenic lipoprotein changes in diabetic nephropathy. Atherosclerosis 2001; 156: 425–433. [DOI] [PubMed] [Google Scholar]
- 10. Hirano T. Pathophysiology of diabetic dyslipidemia. J Atheroscler Thromb 2018; 25: 771–782. [DOI] [PMC free article] [PubMed] [Google Scholar]
- 11. MacIsaac RJ, Tsalamandris C, Panagiotopoulos S, et al. Nonalbuminuric renal insufficiency in type 2 diabetes. Diabetes Care 2004; 27: 195–200. [DOI] [PubMed] [Google Scholar]
- 12. National Kidney Foundation . KDOQI clinical practice guidelines and clinical practice recommendations or diabetes and chronic kidney disease. Am J Kidney Dis 2007; 49: S12–S154. [DOI] [PubMed] [Google Scholar]
- 13. Tuttle KR, Bakris GL, Bilous RW, et al. Diabetic kidney disease: a report from an ADA consensus conference. Diabetes Care 2014; 37: 2864–2883. [DOI] [PMC free article] [PubMed] [Google Scholar]
- 14. Berneis KK, Krauss RM. Metabolic origins and clinical significance of LDL heterogeneity. J Lipid Res 2002; 43: 1363–1379. [DOI] [PubMed] [Google Scholar]
- 15. Ito Y, Fujimura M, Ohta M, et al. Development of a homogeneous assay for measurement of small dense LDL cholesterol. Clin Chem 2011; 57: 57–65. [DOI] [PubMed] [Google Scholar]
- 16. Hoogeveen RC, Gaubatz JW, Sun W, et al. Small dense low‐density lipoprotein‐cholesterol concentrations predict risk for coronary heart disease: the Atherosclerosis Risk In Communities (ARIC) study. Arterioscler Thromb Vasc Biol 2014; 34: 1069–1077. [DOI] [PMC free article] [PubMed] [Google Scholar]
- 17. Higashioka M, Sakata S, Honda T, et al. Small dense low‐density lipoprotein cholesterol and the risk of coronary heart disease in a Japanese community. J Atheroscler Thromb 2020; 27: 669–682. [DOI] [PMC free article] [PubMed] [Google Scholar]
- 18. Hirano T, Sakaue T, Misaki A, et al. Very low‐density lipoprotein‐apoprotein CI is increased in diabetic nephropathy: comparison with apoprotein CIII. Kidney Int 2003; 63: 2171–2177. [DOI] [PubMed] [Google Scholar]
- 19. Ito Y, Ohta M, Ikezaki H, et al. Development and population results of a fully automated homogeneous assay for LDL triglyceride. JALM 2018; 2: 746–756. [DOI] [PubMed] [Google Scholar]
- 20. Saeed A, Feofanova EV, Yu B, et al. Remnant‐like particle cholesterol, low‐density lipoprotein triglycerides, and incident cardiovascular disease. J Am Coll Cardiol 2018; 72: 156–169. [DOI] [PMC free article] [PubMed] [Google Scholar]
- 21. März W, Scharnagl H, Winkler K, et al. Low‐density lipoprotein triglycerides associated with low‐grade systemic inflammation, adhesion molecules, and angiographic coronary artery disease: the Ludwigshafen Risk and Cardiovascular Health study. Circulation 2004; 110: 3068–3074. [DOI] [PubMed] [Google Scholar]
- 22. Ding XH, Ye P, Wang XN, et al. The predictive value of baseline LDL‐TG level on major adverse cardiovascular events in a followed up cohort population. Eur Rev Med Pharmacol Sci 2017; 21: 1060–1064. [PubMed] [Google Scholar]
- 23. Hirano T, Kodera R, Hirashima T, et al. Metabolic Properties of Lowdensity Lipoprotein (LDL) Triglycerides in Patients with Type 2 Diabetes, Comparison with Small Dense LDL‐Cholesterol. J Atheroscler Thromb 2021. doi: 10.5551/jat.62789. Online ahead of print. J Atheroscler Thromb. 2021. PMID: 33952832 [DOI] [PMC free article] [PubMed] [Google Scholar]
- 24. Levey AS, Stevens LA, Schmid CH, et al. CKD‐EPI (Chronic Kidney Disease Epidemiology Collaboration) a new equation to estimate glomerular filtration rate. Ann Intern Med 2009; 150: 604–612. [DOI] [PMC free article] [PubMed] [Google Scholar]
- 25. Standards of medical care in diabetes 2021. Diabetes Care 2021; 44: 2021S151‐S167. [DOI] [PubMed] [Google Scholar]
- 26. Varbo A, Benn M, Tybjærg‐Hansen A, et al. Remnant cholesterol as a causal risk factor for ischemic heart disease. J Am Coll Cardiol 2013; 61: 427–436. [DOI] [PubMed] [Google Scholar]
- 27. Sacks FM, Hermans MP, Fioretto P, et al. Association between plasma triglycerides and high‐density lipoprotein cholesterol and microvascular kidney disease and retinopathy in type 2 diabetes mellitus: a global case‐control study in 13 countries. Circulation 2014; 129: 999–1008. [DOI] [PubMed] [Google Scholar]
- 28. Tokuno A, Hirano T, Hayashi T, et al. The effects of statin and fibrate on lowering small dense LDL‐ cholesterol in hyperlipidemic patients with type 2 diabetes. J Atheroscler Thromb 2007; 14: 128–132. [DOI] [PubMed] [Google Scholar]
- 29. Hirano T. Abnormal lipoprotein metabolism in diabetic nephropathy. Clin Exp Nephrol 2014; 18: 206–209. [DOI] [PubMed] [Google Scholar]
- 30. Ikewaki K, Schaefer JR, Frischmann ME, et al. Delayed in vivo catabolism of intermediate‐density lipoprotein and low‐density lipoprotein in hemodialysis patients as potential cause of premature atherosclerosis. Arterioscler Thromb Vasc Biol 2005; 25: 2615–2622. [DOI] [PubMed] [Google Scholar]
- 31. Nishikura T, Koba S, Yokota Y, et al. Elevated small dense low‐density lipoprotein cholesterol as a predictor for future cardiovascular events in patients with stable coronary artery disease. J Atheroscler Thromb 2014; 21: 755–767. [DOI] [PubMed] [Google Scholar]
- 32. Miller M. Low‐density lipoprotein triglycerides: widening the atherogenic landscape in CVD risk assessment. J Am Coll Cardiol 2018; 72: 170–172. [DOI] [PubMed] [Google Scholar]
- 33. Oi K, Hirano T, Sakai S, et al. Role of hepatic lipase in intermediate‐density lipoprotein and small, dense low‐density lipoprotein formation in hemodialysis patients. Kidney Int 1999; 71: S227–228. [DOI] [PubMed] [Google Scholar]
- 34. Vaziri ND, Moradi H. Dual role of circulating angiopoietin‐like 4 (ANGPTL4) in promoting hypertriglyceridemia and lowering proteinuria in nephrotic syndrome. Am J Kidney Dis 2014; 64: 495–498. [DOI] [PubMed] [Google Scholar]
- 35. Ginsberg HN, Brown WV. Apolipoprotein CIII: 42 years old and even more interesting. Arterioscler Thromb Vasc Biol 2011; 31: 471–473. [DOI] [PubMed] [Google Scholar]
- 36. Gaudet D, Alexander VJ, Baker BF, et al. Antisense inhibition of apolipoprotein C‐III in patients with hypertriglyceridemia. N Engl J Med 2015; 373: 438–447. [DOI] [PubMed] [Google Scholar]
- 37. Ooi EMM, Chan DT, Watts GF, et al. Plasma apolipoproteinC‐III metabolism in patients with chronic kidney disease. J Lipid Res 2011; 52: 794–800. [DOI] [PMC free article] [PubMed] [Google Scholar]
- 38. Mori Y, Hirano T, Nagashima M, et al. Decreased peroxisome proliferator‐activated receptor alpha gene expression is associated with dyslipidemia in a rat model of chronic renal failure. Metabolism 2007; 56: 1714–1718. [DOI] [PubMed] [Google Scholar]
- 39. Fruchart JC, Duriez P, Staels B. Peroxisome proliferator‐activated receptor‐alpha activators regulate genes governing lipoprotein metabolism, vascular inflammation and atherosclerosis. Curr Opin Lipidol 1999; 10: 245–257. [DOI] [PubMed] [Google Scholar]
- 40. Ikewaki K. In vivo kinetic studies to further understand pathogenesis of abnormal lipoprotein metabolism in chronic kidney disease. Clin Exp Nephrol 2014; 18: 261–264. [DOI] [PubMed] [Google Scholar]
- 41. Doucet C, Mooser V, Gonbert S, et al. Lipoprotein(a) in the nephrotic syndrome: molecular analysis of lipoprotein(a) and apolipoprotein(a) fragments in plasma and urine. J Am Soc Nephrol 2000; 11: 507–513. [DOI] [PubMed] [Google Scholar]
- 42. Astor BC, Hallan SI, Miller ER, et al. Glomerular filtration rate, albuminuria, and risk of cardiovascular and all‐cause mortality in the US population. Am J Epidemiol 2008; 167: 1226–1234. [DOI] [PubMed] [Google Scholar]
- 43. Matsushita K, van der Velde M, Astor BC, et al. Association of estimated glomerular filtration rate and albuminuria with all‐cause and cardiovascular mortality in general population cohorts: a collaborative meta‐analysis. Chronic kidney disease prognosis consortium. Lancet 2010; 375: 2073–2081. [DOI] [PMC free article] [PubMed] [Google Scholar]
- 44. Ninomiya T, Perkovic V, de Galan BE, et al. Albuminuria and kidney function independently predict cardiovascular and renal outcomes in diabetes. J Am Soc Nephrol 2009; 20: 1813–1821. [DOI] [PMC free article] [PubMed] [Google Scholar]