Abstract
Background
For a number of reasons, the cause-of-death statistics of the city of Hamburg are one of the most valid sources of data for the study of secular trends in cancer mortality in Germany. In this article, cancer mortality in Hamburg over the period 1872–2019 is presented.
Methods
The sex-specific, raw, age-standardized (according to the world standard population), and age-specific cancer mortality rates for Hamburg, the German Empire, and the Federal Republic of Germany were determined from a variety of sources. The percentage of persons aged 60 and above in Hamburg was determined for the periods 1895–1950 and 1956–2019.
Results
Raw cancer mortality rates rose in Hamburg from 1872 onward. After standardization for age, cancer mortality rates were nearly constant from 1905 to 1951. In contrast, age-standardized cancer mortality in Germany overall rose over the years 1905–1934, reaching the same level as Hamburg only in 1933. From 1951 onward, cancer mortality rose among men in Hamburg, reaching a maximum of 205 per 100 000 in 1967 and thereafter continually decreasing, down to a value of 120 per 100 000 in 2019. In women, cancer mortality was nearly constant from 1905 to 1958 and then fell continually until 2019 (85 per 100 000). The percentage of persons aged 60 or above was only 6% in 1895, 17% in 1950, and 23% in 2019.
Conclusion
The high validity of cause-of-death statistics in Hamburg enabled an estimation of secular trends in cancer mortality. A steady decline in cancer mortality in all age groups and in both sexes was found in Hamburg, beginning in approximately 1990 at the latest.
Historical evaluation of cancer mortality in Germany is impossible without reference to data from death certificates. In the German Empire, and subsequently in Germany, legislation regarding mandatory post mortem examinations was a matter for individual states. The legal obligation to examine the body of a deceased person was introduced successively in various regions as follows: Baden 1807, Hamburg 1812, Berlin 1824, Hesse 1829, Württemberg 1833, Lübeck 1834, Bavaria 1839, and Saxony 1850. In Prussia the regulations were not standardized until the 1930s. In the German Empire it was the responsibility of local administrations to decide on the introduction of post-mortem examinations, whether by a physician or another official (1, 2).
A regulated system for the recording of mortality statistics was set up by the Imperial Health Agency in 1892 (3), although the regulations regarding post mortem examinations were not yet consistent at that time (1). The “Medical Statistical Communications of the Imperial Health Agency” (“Medizinalstatistischen Mittheilungen aus dem Kaiserlichen Gesundheitsamte”) presented regular summaries of deaths from neoplasms with no classification by age or sex. In the period 1892–1904 all neoplasms (benign and malignant) were assigned to one single category, but from 1905 onwards the division into “cancer” and “other neoplasms” was introduced, the latter comprised predominantly of sarcomas and gliomas (3, 4). From 1932 onward, with the German Empire’s adoption of the International List of Causes of Death, these two categories were statistically subsumed into one group (5).
The deficiencies in the registration of cancer deaths in the German Empire resulted from various factors. In some regions, e.g., in rural Prussia, cancer as a cause of death was not recorded at all (6– 8); in other places post-mortem examinations were conducted exclusively by lay persons; in yet other areas (in Prussia, for example) the bodies of only some of the deceased were examined by a physician (9, 10). The quality of the cause of death data, in terms of the proportion of cases where the cause was unknown or inadequately documented (e.g., ascribed to senility) was much lower in the countryside than in large towns (11). Deaths were registered not where the deceased person lived, but where the death occurred (11). Quality suffered during World War I (11). It is not surprising, therefore, that the rising mortality in the German Empire in the early 20th century occasioned a debate on whether this increase represented genuine growth in the sense of a higher risk of cancer or was due to improvements in diagnosis, better statistical classification of the cause of death, or failure to take account of the increasing age of the population when compiling the data (7, 8, 10, 12, 13).
The cause of death statistics of the city of Hamburg (14) have a number of distinguishing features:
Up to 1933, Hamburg (where the practice was introduced in 1812) was one of only a small number of regions with mandatory post mortem examination by a physician of the bodies of all deceased persons (1).
Furthermore, cities like Hamburg were known for their high densities of physicians and hospitals and their high autopsy rates (15).
In contrast to other regions (3, 4, 10, 13, 16), persons who died in Hamburg but were not registered residents of the city were not included in the Hamburg cause of death statistics.
From an early date, the cancer mortality statistics were published not only as absolute case numbers, but also as mortality rates stratified by calendar year, age, and sex.
The Hamburg cause of death records thus anticipated the regulations introduced with the foundation of the Federal Republic of Germany (FRG) in 1949.
The changing age structure of the population means that the sex-specific cancer mortality over an extended amount of time cannot be investigated without knowledge of age- and sex-specific annual death rates. I found that for Hamburg, these data were available for the period 1872 to 2019. The aim of this study was to present the crude, age-specific, and age-standardized cancer mortality rates of the population of Hamburg—to the extent available or calculable—and thus to contribute to the apparently unresolved debate on the increase in cancer deaths recorded in the German Empire during the early part of the 20th century.
Material and methods
Data extraction
For the period 1872–1979, the available published data (rate or number of deaths and population size) for Hamburg, the German Empire, or the FRG were entered manually into a database (13, 14, 17– 22). For the period 1980–2019, the age-standardized cancer mortality rates from the Federal Health Monitoring Information System (www.gbe-bund.de) were integrated digitally into the database on 22 April 2021. Details of the calendar periods, age groups, sex groups, and type of rates published (crude or age-standardized) can be found in the eTable. The aging of the population since the late years of the 19th century was described in 1957 by Schwanke, who traced the development in the proportion of the population of Hamburg aged ≥ 60 years or over (14). I calculated the proportion of persons aged 60 and above in Hamburg for the modern era up to 2019.
eTable. Sources of cancer mortality data for Hamburg, the German Empire, and Germany.
| Population | Period | Age (years) | Sex | Cancer deaths | Population size | Rate | Access (reference) |
| Hamburg | 1872–1898 | Entire range | M, F, total | − | − | Crude rates | (17), data extracted from table |
| 1905–1951*1 | 0–29, 30–59, 60–69, ≥ 70 years | M, F, total | − | − | Age-specific rates | (14), data extracted from table | |
| 1871–1951 | Entire range | Total | − | − | Crude rates | (14), data extracted from table | |
| 1895–1950 | − | − | − | Proportion ≥ 60 years | Proportions per year | (14), data extracted from illustration | |
| 1956–1979 | 0–4, 5–9, …, 75–79, ≥ 80 (up to 1966), ≥ 85 (from 1967) | M, F | +*2 | + | − | (18– 21), data extracted from table | |
| 1980–2019 | 0–4, 5–9, …, 80–84, ≥ 85 | M, F | +*2 | + | − | www.gbe-bund.de; accessed: 22.4.2021 | |
| German Empire | 1905–1934 | 0–, 1–4, 5–14, 15–19, 30–44, 45–59, 60–69, ≥ 70 | M, F | − | − | Age-specific rates | (13), data extracted from table |
| Federal Rep. of Germany | 1952–1990 | Entire range | M, F | − | − | Age-specific rates (world standard) | (22), data extracted from table |
| Germany, total | 1991–2019 | Entire range | M, F | − | − | Age-specific rates (world standard) | www.gbe-bund.de; accessed: 22.4.2021 |
*1 Periods/years: 1905–1906, 1910–1911, 1919–1920, 1924–1926, 1933, 1939, 1946, 1950, and 1951;
*2 In addition to the total cancer deaths, data on the cancer types most commonly leading to death were extracted. M, Male; F, female
From 1904 to 1931, causes of death were categorized according to the “Abbreviated Cause of Death List” (“Kürzer gefaßtes Todesursachenverzeichnis”) (8); from 1932 to 1940, according to the International List of Causes of Death. Thereafter, successive revisions of the International Classification of Diseases were used: ICD-5 from 1941 to 1951, ICD-6 from 1952 to 1957, ICD-7 from 1958 to 1967, ICD-8 from 1968 to 1979, ICD-9 from 1979 to 1997, and ICD-10 from 1998 to 2019. All rates were calculated as cancer deaths per 100 000 person-years, age-standardized to the world standard population (23).
Results
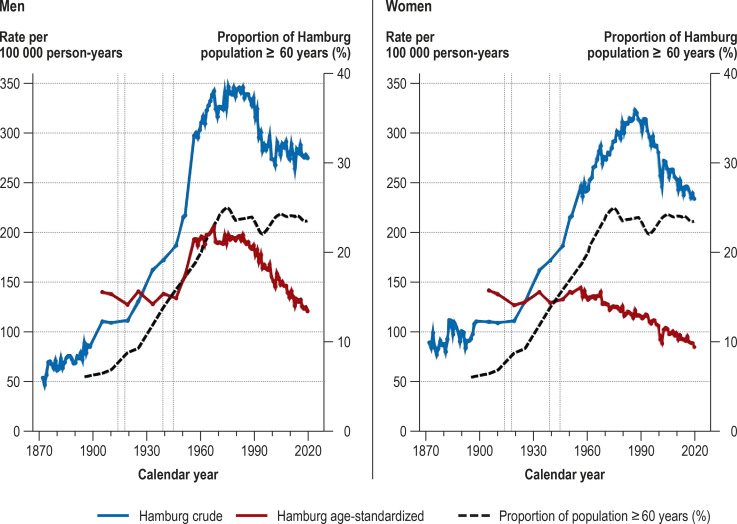
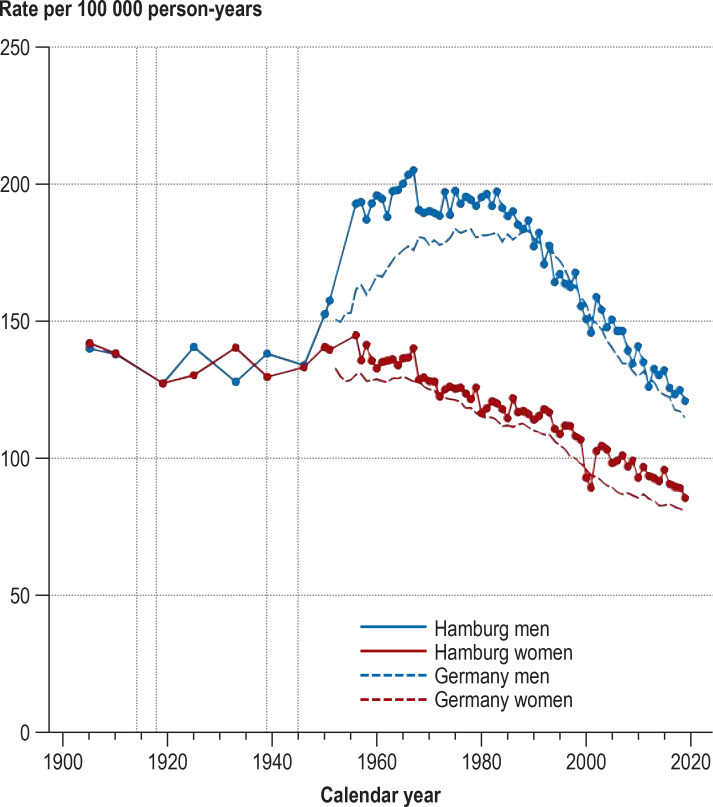
Between 1871 and 2019 the population of Hamburg increased by a factor of 7.7, from 239 107 to 1 847 253. The crude cancer mortality rates rose steadily from 1872 onward, peaking in men in 1975 (347/100 000) and in women in 1986 (323/100 000). Thereafter the rates in both sexes fell markedly, reaching 275 and 234 per 100 000, respectively, in 2019. The increases can be explained largely by the changing age structure of the population. While in 1895 the proportion of the population of Hamburg aged ≥ 60 years was 6%, it had reached 25% by 1974 and varied between 22% and 24% in the years thereafter. The age-standardized cancer mortality rates showed distinctly different trends in men and women. From 1905 to 1951, the rates were almost constant for both sexes. In men, the rates rose to a peak of 205 per 100 000 in 1967 and then fell steadily to 120 per 100 000 in 2019. In women, the rates stayed practically constant from 1905 to 1958 (average 137/100 000) and then fell continuously until 2019 (85/100 000).
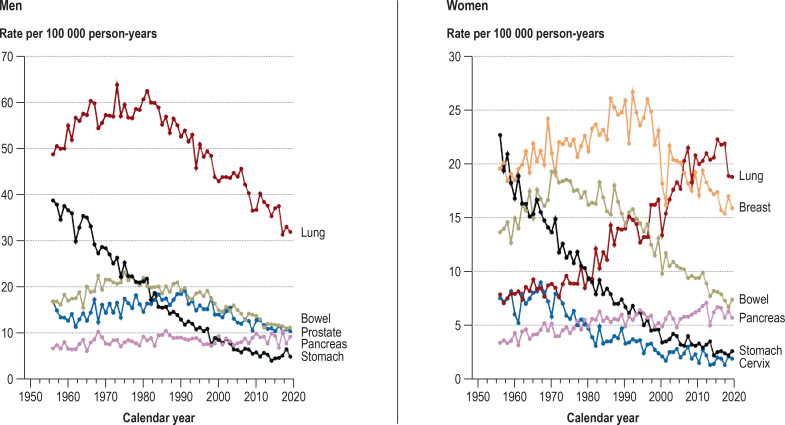
A striking feature is the relatively rapid 25% increase in age-standardized cancer mortality rate (from 157 to 196/100 000) in men between 1951 and 1960, a period in which the rate in women fell slightly (from 139 to 132/100 000). In particular, the age-standardized cancer mortality rate in men increased from 157 to 193 per 100 000 (+ 23%) between 1951 (the last year surveyed by Schwanke [14]) and 1956 (the first year of the Hamburg Cancer Documentation project [18]), while the rate in women rose only slightly (from 139 to 145/100 000, + 4%) (figure 1). The cancer-specific age-standardized mortality rates of the cancers most commonly leading to death for the period 1956–2019 show that the pronounced increase in age-standardized overall cancer mortality in men during the 1950s and 1960s can be attributed particularly to the rising numbers of deaths from lung cancer. This increase was too high to be offset by the distinct decrease in age-standardized stomach cancer mortality during the same period (efigure 1).
Figure 1.
Crude (1872–2019) and age-standardized cancer mortality rates (1905–2019) of the population of Hamburg and the proportion of the population ≥ 60 years
Vertical dotted lines: world wars
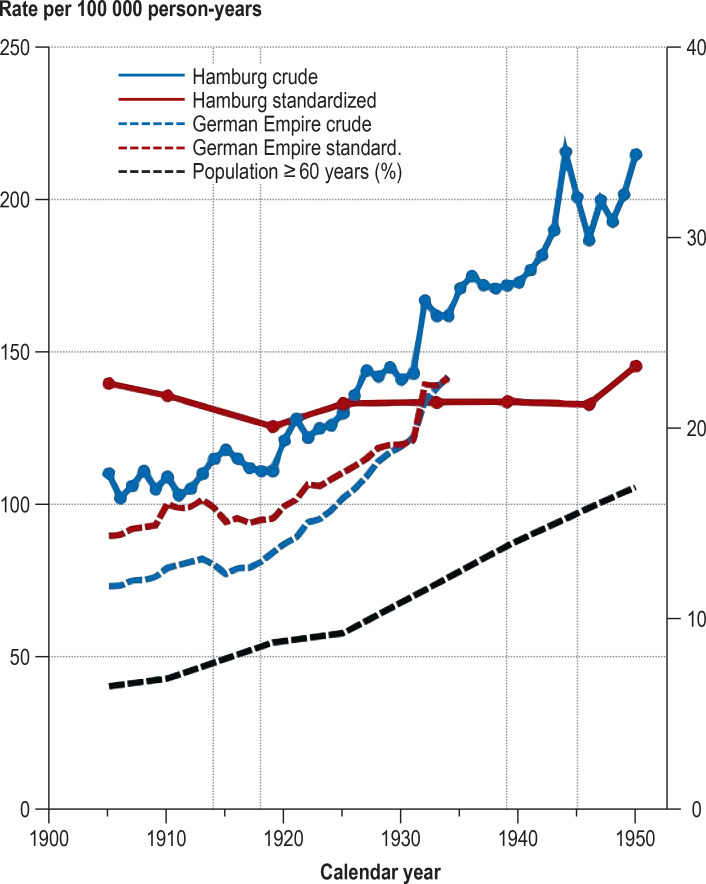
Figure 3.
Crude and age-standardized cancer mortality rates (men and women together) in Hamburg (1905–1950) and in the German Empire (1905–1934), together with the proportion of the population of Hamburg ≥ 60 years (right y-axis)
Vertical dotted lines: world wars
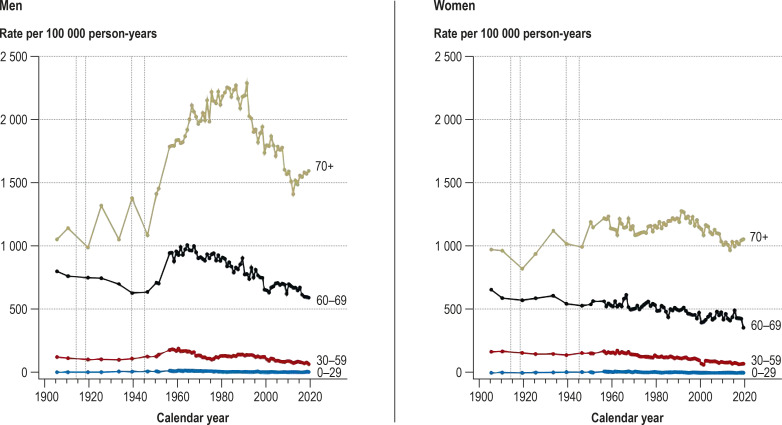
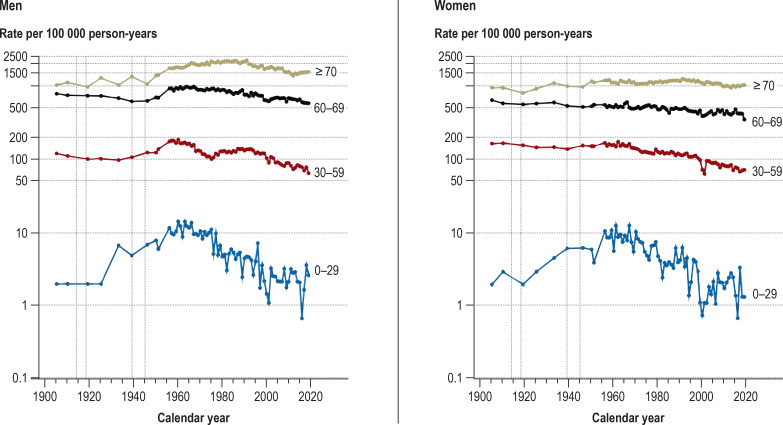
The age-specific mortality rates in Hamburg changed little up to 1951. Thereafter, particularly in the period 1951–1960, there was a distinct increase in age-specific cancer mortality rates in men (0–29 years: + 40%, 30–59: + 35%, 60–69: + 32%, ≥ 70: + 26%); in women, there was an increase in the 0–29 years age group (+ 43%), but in the other age groups the rates hardly changed. From around 1990 onwards, cancer mortality rates decreased continuously in all age groups of both sexes. Between 1951 (the last year surveyed by Schwanke [14]) and 1956 (the first year of the Hamburg Cancer Documentation project [18]), men in the age groups 30–59, 60–69, and ≥ 70 years showed relative and absolute increases in rate of 26% (+ 37/100 000), 34% (+ 241/100 000), and 23% (+ 332/100 000), respectively (Figure 2, eFigure 2).
Figure 2.
Age-specific cancer mortality rates in the population of Hamburg, 1905–2019
Vertical dotted lines: world wars
eFigure 2.
Age-specific cancer mortality rates in the population of Hamburg, 1905–2019 (logarithmic y-axis scaling)
Vertical dotted lines: world wars
Figure 3 helps to explain how there came to be a debate on whether the apparent increase in cancer risk in the first half of the 20th century was genuine. The crude cancer mortality rate in Hamburg rose from 72 per 100 000 in 1872 to 217 per 100 000 in 1951. This increase was accompanied, however, by a pronounced change in the age structure of the Hamburg population, with the proportion of ≥ 60-year-olds rising from 6% in 1895 to 17% in 1950. After correction for this change by age standardization, the rates remained practically constant from 1905 to 1951. In the German Empire, on the other hand, gradual refinement of official cause of death statistics and steady improvement—also in rural areas—in hospital provision and numbers of physicians led to higher crude and age-standardized cancer mortality rates over the period 1905–1934. Only around 1933 did the age-standardized cancer mortality rates of the German Empire come to match the age-standardized cancer mortality rates in Hamburg (figure 3).
From 1952 to 2019, the temporal trends in age-standardized cancer mortality rates in Hamburg were closely comparable with the FRG and later with reunified Germany as a whole. However, the rapid increase in cancer mortality among men in the years 1952–1960 occurred earlier in Hamburg than in the FRG. Right up to the last year of this study, 2019, age-standardized cancer mortality was slightly higher in Hamburg than in Germany as a whole for both men and women (efigure 3).
Discussion
I have traced the trends in cancer mortality in Hamburg over a period of 148 years for which good records are available. A large proportion of the increase in crude cancer mortality from 1872 to 1951 can be attributed to the aging of the Hamburg population. After age standardization of the cancer mortality for the period 1905–2019, cancer mortality was almost constant up to the end of World War II. Only after the war, in the 1950s, was there a marked increase in the age-standardized cancer mortality rate for men; in women, on the other hand, the rate decreased continuously right up to 2019. The distinct increase in rates among men was found in all age groups and began earlier in Hamburg than in Germany as a whole. From around 1990, at the latest, all age groups of both sexes showed a continuous decline in cancer mortality rates.
It can be assumed that the autopsy rates in Hamburg in the first half of the 20th century were high, as they were in other European cities (e.g., Basel, 37–45%; [24]). In 1956 the rate in Hamburg was 39% (25). The autopsy rates in Hamburg remained relatively constant up to around 1990 and then declined sharply (26). The rate of autopsies therefore provides no explanation for the rapid postwar increase in cancer mortality in men. The answer is supplied by analysis of the mortality trends for the most commonly occurring cancers: the pronounced increase in overall cancer mortality is attributable particularly to the marked rise in lung cancer deaths. The decline in deaths from stomach cancer over the same period did not offset the impact of rising lung cancer mortality on overall cancer mortality in men. The findings for the FRG as a whole are very similar (22, 27).
In 1950 Freudenberg described the debate about the cancer risk in the 1930s as “a matter of fashion.” Not until just after the war, in the years 1946–1948, was this debate pushed into the background by the more momentous mortality from tuberculosis (5). A central point of discussion in the first half of the 20th century was whether or not there had been a genuine increase in cancer risk. I have attempted to answer this question with the aid of the best available cause of death statistics in Germany. The legal obligation for post-mortem examination of the bodies of all deceased persons by a physician was introduced in Hamburg long before many other regions. Moreover, the records did not include those persons who died in Hamburg but were not registered as residents. Compared with rural regions, cities like Hamburg had a far higher density of physicians and hospitals. Altogether, these factors led to much better data quality of cause of death statistics than in rural regions or other cities.
From 1905 to 1932 cancer mortality in the German Empire was much lower than in Hamburg, only reaching the same level as Hamburg in 1933. A number of publications have laid out the reasons why the quality of cause of death statistics was higher in cities (11, 13, 16, 28– 31). In his 1931 textbook, Prinzing concluded that “the question of the increase in cancer…can be regarded as answered” (29). He also wrote “The situation is best in Hamburg” (29). Variously empirically verifiable factors have been cited to explain the urban–rural difference, which resolved only gradually with advances in healthcare in the German Empire: both cause of death documentation and medical care (diagnosis, hospital admissions, rate of post-mortem examinations by physicians, autopsies) were considerably better in cities (3, 11, 16). The number of physicians per 10 000 inhabitants of the German Empire increased from 3.2 in 1876 to 7.0 in 1939, and the numbers of officially planned hospital beds and of hospital admissions per 10 000 inhabitants of the German Empire went up, respectively, from 25 and 108 in 1877 to 87 and 830 in 1939 (32).
Alongside the limited quality of country-level cause of death statistics in Germany, another factor playing a part in the debate as to whether or not the increase in cancer risk was genuine was the limited use of age standardization of mortality data to adjust for the changing age structure of the population. Age standardization had been known since 1844, and as early as 1915 Hoffmann described the failure to apply age standardization as an “unpardonable statistical error” (34). However, only after World War II was age standardization consistently employed throughout Germany. My retrospective age standardization of the cancer mortality rates in Hamburg from 1905 to 1951 shows that the age-standardized cancer mortality remained practically constant right to the end of that period, despite considerable increases in cancer deaths and crude cancer mortality rates owing to the changing age structure of the population. My age standardization of cancer mortality also showed near-constant mortality rates for both sexes between 1925 and 1948 in Berlin (5) and between 1910 and 1925 in Cologne (16) (data not shown). The observed rise in the absolute number of deaths from cancer may have given physicians the impression of an increased cancer risk in the population.
Although, at 148 years, this time series analysis of cancer mortality in a German region is the longest ever presented, some limitation of the data must be noted: Over the course of time, the classification of cancers has changed repeatedly (35) and the density of both physicians and hospitals has increased considerably (32), as has the availability of diagnostic tools for the detection of cancers. Moreover, the diagnostic quality of the detection of cancers has improved. Due to the low numbers of physicians during the world wars, the quality of cause of death statistics for those periods was limited (6, 11). I was only able to investigate overall cancer mortality and the numbers of deaths from frequently fatal forms of cancer over the period concerned. I was unable to investigate trends in the mortality rates for specific cancers in Hamburg for the years before 1956, because the corresponding data were not available.
eFigure 1.
Age-standardized cancer mortality rates for the frequently fatal forms of cancer in Hamburg, 1956–2019
“Lung” includes trachea, bronchi, and lungs; ”bowel” includes colon, rectum, and (from 1980) anus.
eFigure 3.
Age-standardized cancer mortality rates in Hamburg and in Deutschland, 1952–2019 (1952–1990 for the Federal Republic of Germany, from 1991 for the whole of Germany (combined territories of previously existing Federal Republic of Germany and German Democratic Republic)
Vertical dotted lines: world wars
Acknowledgments
Translated from the original German by David Roseveare
Acknowledgments
I thank Hamburg Cancer Registry for giving me access to historical reports. I am also grateful to the former director of Hamburg Cancer Registry, Dr. Stefan Hentschel, for his valuable comments on an early version of the manuscript and to Banu Demirci, Essen and Heike Engler, Bochum for their support in the quality-assured transfer of tabulated data from printed documents to a database.
Footnotes
Conflict of interest statement The author declares that no conflict of interest exists.
References
- 1.Wenzel K. Die Leichenschau. Reichsgesundheitsblatt. 1933;8:66–73. [Google Scholar]
- 2.Stürzbecher M. Ueber die Entwicklung der Leichenschau in Berlin. Beitr Gerichtl Med. 1970;27:256–262. [PubMed] [Google Scholar]
- 3.Prinzing F. Der Krebs in Württemberg und sein Auftreten in krebsarmen und krebsreichen Oberämtern. Z Krebsforsch. 1914;14:413–490. [Google Scholar]
- 4.Freudenberg K. Die Höhe der Krebssterblichkeit. Z Krebsforsch. 1932;35:178–268. [Google Scholar]
- 5.Freudenberg K. Kritische Betrachtung der Krebsstatistik. Berliner Med Z. 1950;1:420–423. [Google Scholar]
- 6.Preussisches Statistisches Landesamt. Verlag des Preussischen Statistischen Landesamts. Berlin: 1929. Medizinalstatistische Nachrichten. [Google Scholar]
- 7.Wolff G. Zur Standardisierung der Sterblichkeitsmessung nach dem Kriege. Arch Soz Hyg. 1928;3:343–352. [Google Scholar]
- 8.Vaternahm T. Klinische Todesursache und Sektionsbefund. Arch Soz Hyg. 1929;5:33–36. [Google Scholar]
- 9.Behla R. Der Krebs in Preußen während der Kriegsjahre 1914 und 1915. Z Krebsforsch. 1920;17:492–522. [Google Scholar]
- 10.Willcox WF. On the alleged increase of cancer. J Cancer Res. 1917;2:267–365. [Google Scholar]
- 11.Hallermann W. Die Krebssterblichkeit in Deutschland unter Berücksichtigung des Altersaufbaus der Bevölkerung. Z Krebsforsch. 1933;38:75–93. [Google Scholar]
- 12.King G, Newsholme A. Proc Royal Soc. Vol. 54. London: 1894. On the alleged increase of cancer; pp. 209–242. [Google Scholar]
- 13.Stupening W. Über die Häufigkeit der Krebserkrankung Erste vollständige Krebsstatistik des Deutschen Reiches in den letzten 30 Jahren. Z Krebsforsch. 1937;46:175–210. [Google Scholar]
- 14.Schwanke W. 80 Jahre Krebsstatistik in Hamburg. Hamburger Aerztebl. 1957;11:46–51. [Google Scholar]
- 15.Rahts K. Ergebnisse der Todesursachenstatistik. Medizinalstatistische Mitteilungen aus dem Kaiserlichen Gesundheitsamt. 1900;7:83–126. [Google Scholar]
- 16.Meerbeck F. Über die Krebssterblichkeit in Köln von 1910-1927. Z Krebsforsch. 1930;30:513–545. [Google Scholar]
- 17.Reiche F. Zur Verbreitung des Carcinoms. MMW Fortschr Med. 1900;39:1337–1339. [Google Scholar]
- 18.Statistisches Landesamt Hamburg. Heft 105. Hamburg: 1973. Hamburger Krebsdokumentation 1956 bis 1971. [Google Scholar]
- 19.Statistisches Landesamt Hamburg. Heft 116. Hamburg: 1976. Hamburger Krebsdokumentation 1972 bis 1974. [Google Scholar]
- 20.Statistisches Landesamt Hamburg. Heft 126. Hamburg: 1980. Hamburger Krebsdokumentation 1975 bis 1977. [Google Scholar]
- 21.Statistisches Landesamt Hamburg. Heft 126. Hamburg: 1983. Hamburger Krebsdokumentation 1978 und 1979. [Google Scholar]
- 22.Becker N, Wahrendorf J. Springer-Verlag. Berlin: 1998. Krebsatlas der Bundesrepublik Deutschland 1981-1990. [Google Scholar]
- 23.Doll R, Cook P. Summarizing indices for comparison of cancer incidence data. Int J Cancer. 1967;2:269–279. doi: 10.1002/ijc.2910020310. [DOI] [PubMed] [Google Scholar]
- 24.Roesle E. Die Abnahme der Krebssterblichkeit im mittleren Alter. Z f Schulgesundheitspflege soz. Hygiene. 1931;19 5:08–16. [Google Scholar]
- 25.Bauer KH. Springer-Verlag. 2. Berlin: 1963. Das Krebsproblem Einführung in die allgemeine Geschwulstlehre für Studierende, Ärzte und Naturwissenschaftler. [Google Scholar]
- 26.Sperhake J, Püschel K. [The autopsy law of Hamburg from february 9, 2000–changing autopsy rates in departments of pathology in Hamburg] Pathologe. 2003;24:204–206. doi: 10.1007/s00292-003-0616-y. [DOI] [PubMed] [Google Scholar]
- 27.Becker N, Altenburg HP, Stegmaier C, et al. Report on trends of incidence (1970-2002) of and mortality (1952-2002) from cancer in Germany. J Cancer Res Clin Oncol. 2007;133:23–35. doi: 10.1007/s00432-006-0142-4. [DOI] [PubMed] [Google Scholar]
- 28.Bludau A, Gajewski W. Der Krebstod in Preußen in den Jahren 1923-1927. Z Preuß Statist Landesamt. 1930;69:285–289. [Google Scholar]
- 29.Prinzing F. Handbuch der medizinischen Statistik. Jena: Gustav von Fischer Verlag. 1931:524–und 432. [Google Scholar]
- 30.Vaternahm T. Zur Frage der Krebssterblichkeit Ein Versuch zur Analysierung der Angaben der Todesursachenstatistik. Arch Soz Hyg Demograph. 1931;21:21–25. [Google Scholar]
- 31.Böhmert W. Was kann die Statistik zur Aufhellung des Krebsproblems tun? Review Int Stat Inst. 1938;5:335–346. [Google Scholar]
- 32.Statistisches Bundesamt. W. Kohlhammer Verlag. Stuttgart: 1972. Bevölkerung und Wirtschaft 1872-1972. [Google Scholar]
- 33.Neison FGP. On a method recently proposed for conducting inquiries into the comparative sanatory condition of various districts, with illustrations, derived from numerous places in Great Britain at the period of the last census. J R Stat Soc. 1844;7:40–68. [Google Scholar]
- 34.Hoffmann FL. The mortality from cancer throughout the world. Newark: Prudential Press. 1915 [Google Scholar]
- 35.Prinzing F. Die deutschen und die internationalen Todesursachenverzeichnisse. Dtsch Stat Zentralblatt. 1921;3/4:35–42. [Google Scholar]


