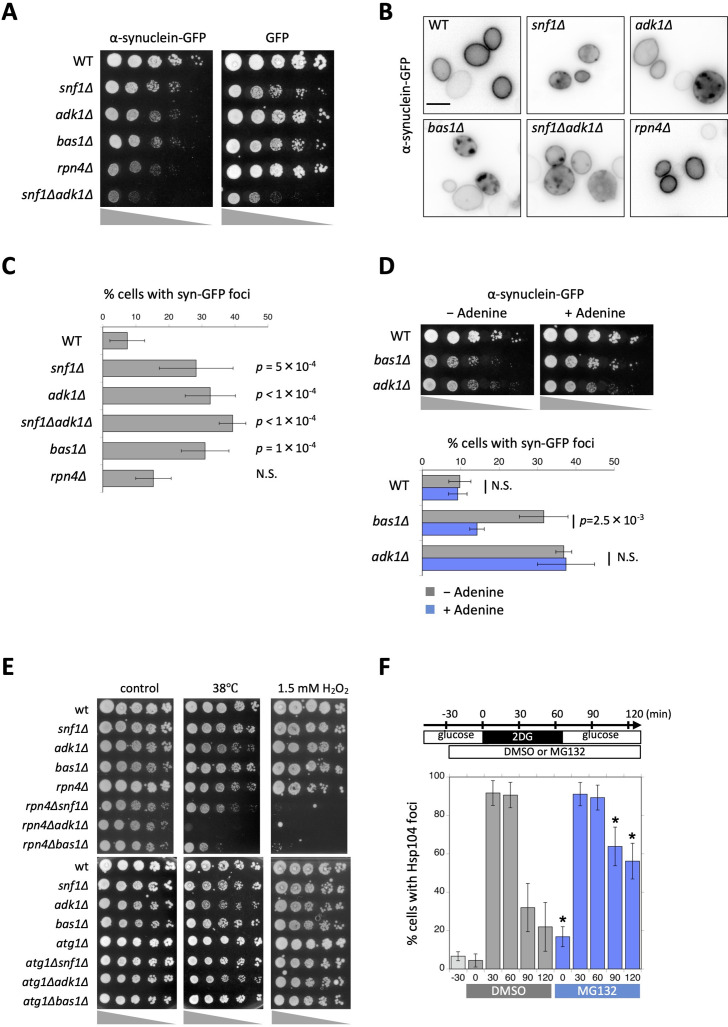
Figure 5. Aggregation and cytotoxicity of α-synuclein depend on adenosine triphosphate (ATP) homeostasis.
(A) Each strain of the indicated genotype was transformed with an expression vector carrying α-synuclein-GFP or GFP, serially diluted (fivefold), spotted on SC + 2% galactose plates, and then grown at 30°C for 3 days. (B) The localization of α-synuclein-GFP in ATP mutants. Cells were grown on galactose plates at 30°C for more than 42 hr and then imaged. Representative images of α-synuclein-GFP (inverted grayscale) are shown. (C) Quantification of the data shown in (B). Cells were classified and scored for the localization pattern of α-synuclein-GFP. The percentage of cells showing α-synuclein-GFP foci are plotted. Data are the mean ± 1SD (error bars) from three to six independent observations. N = 33–380 cells were scored in each measurement. p values versus WT are shown (Dunnett’s multiple comparison). N.S., no significance (p value >0.05). (D) (Top) Each strain of the indicated genotype was transformed with an expression vector carrying α-synuclein-GFP and grown on galactose plates containing 0 mM (−Adenine) or 0.3 mM (+Adenine) adenine at 30°C for 3 days. (Bottom) Cells were grown on galactose plates in the absence or presence of adenine at 30°C for 41–45 hr and then imaged. The percentage of cells showing α-synuclein-GFP foci was plotted. Data are the mean ± 1SD (error bars) from five independent transformants. N = 53–258 cells were scored in each measurement. Statistical significance was tested using the unpaired two-tailed Welch’s t-test. p values versus ‘−Adenine’ are shown. (E) Each strain of the indicated genotype was serially diluted (fivefold), spotted on SC + 2% glucose medium, and grown under the indicated stress conditions. (F) Cells of the drug-sensitive strain Y13206 were grown to the log phase at 37°C in medium containing 2% glucose and supplemented with 0.1% dimethylsulfoxide (DMSO) or 0.1% DMSO plus 42 µM MG132 at t = −30 min. At t = 0 min, these cells were washed and released in medium containing 20 mM 2-deoxyglucose (2DG) ± MG132, and cells were then washed and released again in medium containing 2% glucose ± MG132. Cells were imaged at the indicated time points and scored for the number of Hsp104-GFP foci. Data are the mean ± 1SD (error bars). Asterisks indicate a significant difference from DMSO (p < 0.02) (N = 3).


