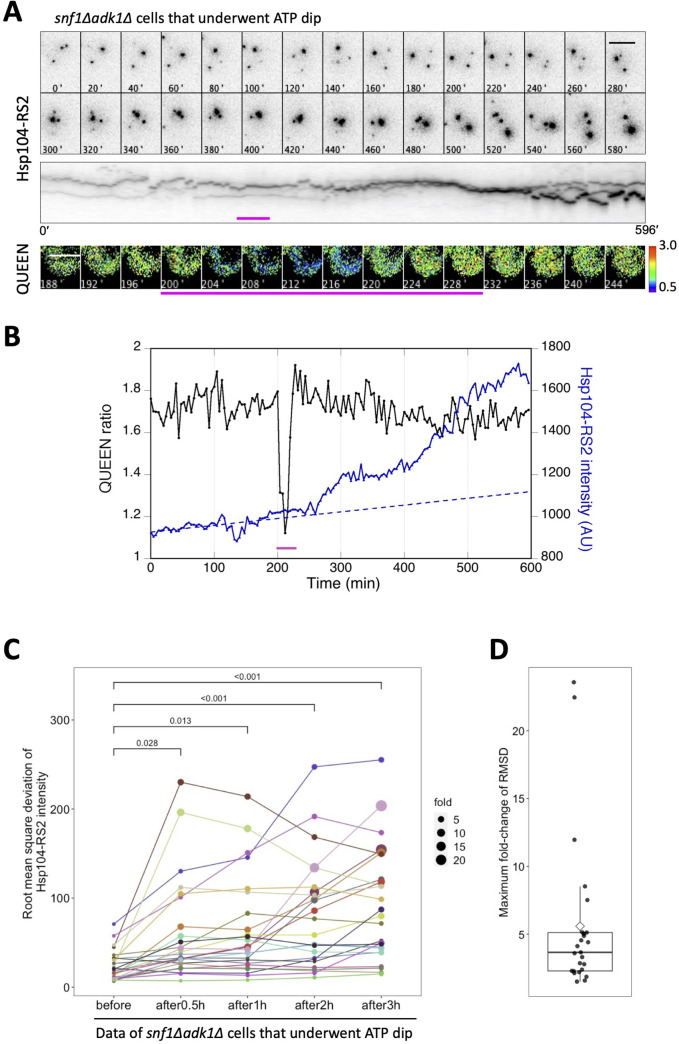
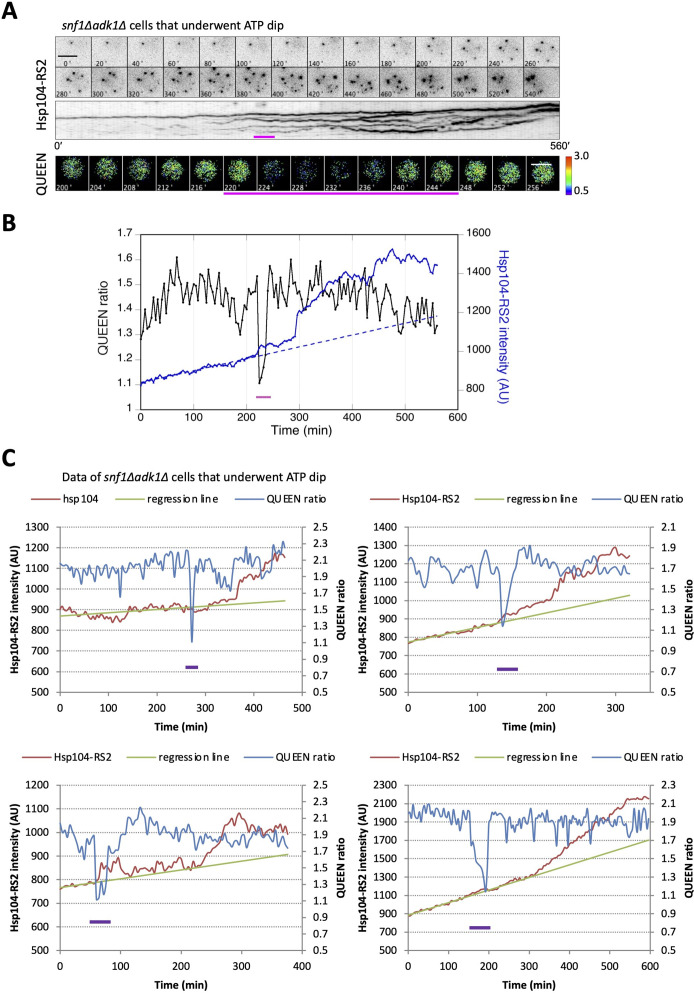
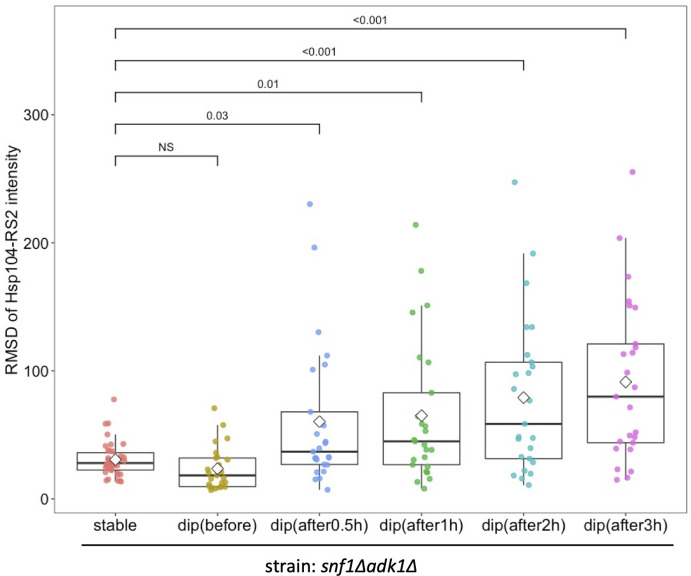
Figure 7. The transient decrease in adenosine triphosphate (ATP) levels is closely associated with the increased accumulation of protein aggregates in snf1∆ adk1∆ cells.
(A) Time-lapse imaging of QUEEN and Hsp104-RS2 in an snf1∆ adk1∆ cell that underwent a single ATP dip. (Top) Images of the Hsp104-RS2 signal (inverted grayscale) in the cell at the indicated time points are shown. (Middle) Kymograph of the images shown in the top panel. (Bottom) QUEEN ratio images of the cell during the ATP dip. (B) The mean QUEEN ratio and the mean fluorescence intensities of Hsp104-RS2 inside the cell were plotted over time. The dotted line indicates the best linear regression of Hsp104-RS2 intensities before the onset of the ATP dip (t = 200 min). Magenta bars indicate the duration of the ATP dip. Scale bar = 5 µm. (C) The root mean square deviation (RMSD) of the mean Hsp104-RS2 intensity of snf1∆ adk1∆ cells that underwent the ATP dip (N = 25 cells, pooled from four independent experiments) were plotted before and after the ATP dip. The RMSD was calculated from deviations from the linear regression before the ATP dip (see Materials and methods for more details). The size of a data point indicates the value normalized to its initial value. The significance of differences was tested using Dunnett’s multiple comparison test and indicated by p values. (D) Maximum fold changes in RMSD within 3 hr of the ATP dip were box plotted. The mean (a diamond) and median (the median line in the box) were 5.6 and 3.7, respectively.


