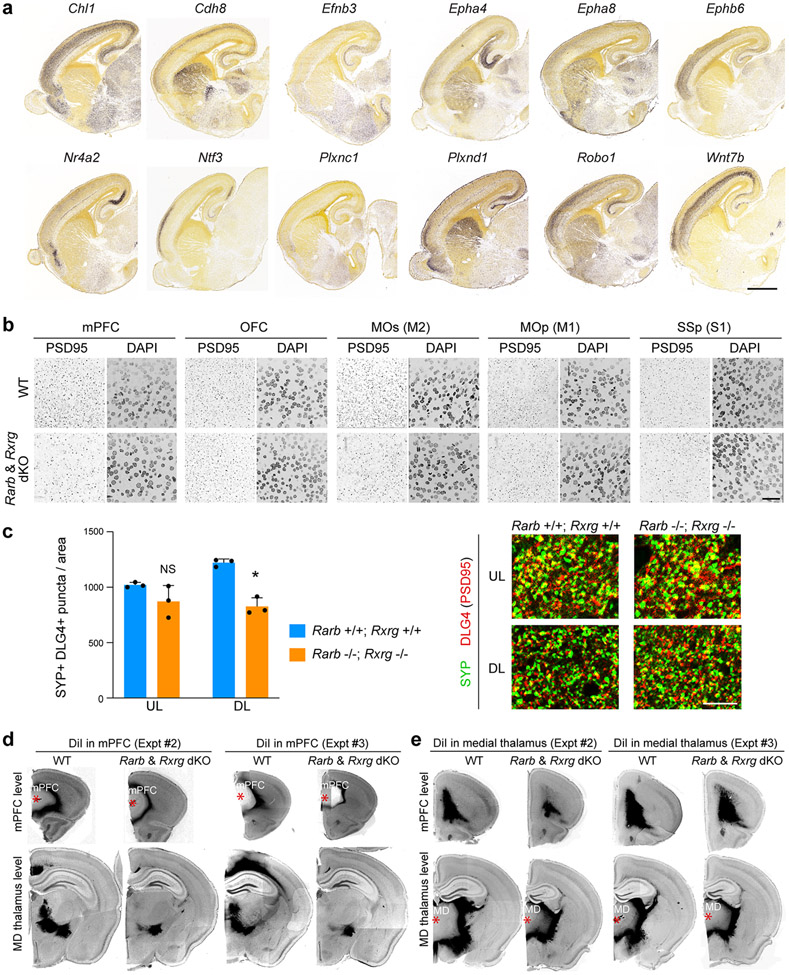
Extended Data Fig. 13 ∣. Altered synaptic density and axonal projections in Rxrg and Rarb dKO mice.
a, Example of downregulated genes between PD 0 Rarb+/+; Rxrg+/+ (WT) and Rarb−/−; Rxrg−/− (dKO) that displayed an anterior to posterior gradient in PCD 18 mouse embryo (images are from the Allen Developing Mouse Brain Atlas; developingmouse.brain-map.org/ 58). Scale bar: 1 mm. b, Immunostaining for PSD95/DLG4 in the cortical subregions (mPFC, MOs, OFC, MOp, and SSp) of WT and dKO brain at PD 0. Each region as shown in Fig. 2c. Scale bar: 25 μm. N = 3 per genotype. c, Quantification and representative images of co-localized synaptophysin (SYP) and PSD95 puncta in PD 0 WT and dKO mPFC. Two-tailed Student’s t-test; *P = 0.01; N = 3 per genotype; Errors bars: S.E.M.; Scale bar: 10 μm. d, e, DiI placement in mPFC (c) and medial thalamus (d) with tracing data in WT and dKO brain at P21. Additional two replicates of experiment shown in Fig. 4d,e are shown. Asterisks: DiI crystal placement. Scale bar: 1 mm.

