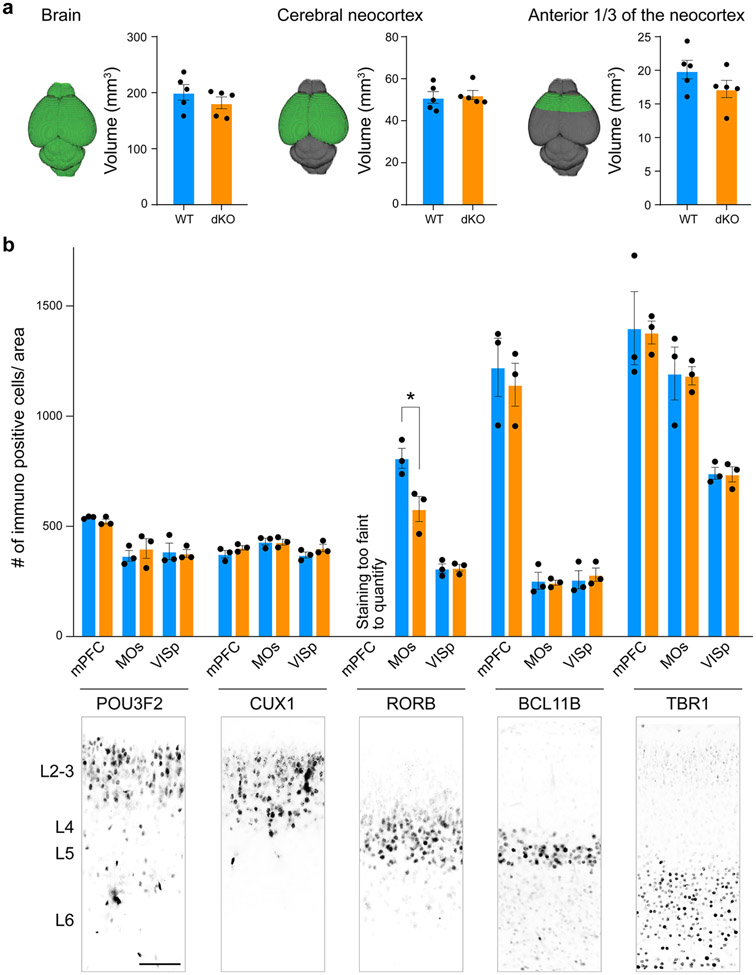
Extended Data Fig. 17 ∣. Analysis of neocortical layers and tissue volume in Rarb and Rxrg dKO mice.
a, Representative images and quantification of total volume of the brain (left), cerebral neocortex (middle), anterior one-third of the neocortex (right) of wildtype (WT) littermates and Rarb;Rxrg dKO at PD 5. Two-tailed unpaired t-test for total volume of the brain and anterior one-third of the neocortex. Two-tailed Mann-Whitney test for volume of cerebral neocortex. P = 0.3, 0.1, 0.6. N = 5. Errors bars: S.E.M. b, Number of immune-positive cells expressing cortical layer markers POU3F2/BRN2, CUX1, RORB, BCL11B/CTIP2, TBR1 in wildtype and dKO mouse mPFC, MOs, and primary visual cortex (VISp) at PD 5 (N = 3). (Unpaired t-test: WT vs. dKO *P = 0.03; Errors bars: S.E.M.). RORB expression in mouse PFC was too faint to quantify. Below each graph is a representative image of each marker. Scale bar: 200 μm

