

Abstract
Arylamine N-acetyltransferase 1 (NAT1) is frequently upregulated in breast cancer. Previous studies showed that inhibition or depletion of NAT1 in breast cancer cells diminishes anchorage-independent growth in culture, suggesting that NAT1 contributes to breast cancer growth and metastasis. To further investigate the contribution of NAT1 to growth and cell invasive/migratory behavior, we subjected parental and NAT1 knockout (KO) breast cancer cell lines (MDA-MB-231, MCF-7 and ZR-75-1) to multiple assays. The rate of cell growth in suspension was not consistently decreased in NAT1 KO cells across the cell lines tested. Similarly, cell migration and invasion assays failed to produce reproducible differences between the parental and NAT1 KO cells. To overcome the limitations of in vitro assays, we tested parental and NAT1 KO cells in vivo in a xenograft model by injecting cells into the flank of immunocompromised mice. NAT1 KO MDA-MB-231 cells produced primary tumors smaller than those formed by parental cells, which was contributed by an increased rate of apoptosis in KO cells. The frequency of lung metastasis, however, was not altered in NAT1 KO cells. When the primary tumors of the parental and NAT1 KO cells were allowed to grow to a pre-determined size or delivered directly via tail vein, the number and size of metastatic foci in the lung did not differ between the parental and NAT1 KO cells. In conclusion, NAT1 contributes to primary and secondary tumor growth in vivo in MDA-MB-231 breast cancer cells but does not appear to affect its metastatic potential.
Keywords: arylamine N-acetyltransferase 1, NAT1, breast cancer, xenograft, tumor, metastasis, cell migration
Graphical Abstract

Introduction
Breast cancer is the most common cancer in women worldwide, and the second most common cancer overall. It is a leading cause of cancer death in less developed countries, and the second leading cause of cancer death in American women, exceeded only by lung cancer (www.breastcancer.org). Breast cancer is a heterogeneous disease and personalized medicine is the hope for the improvement of the clinical outcome1.
Human arylamine N-acetyltransferase 1 (NAT1) has traditionally been known as an enzyme that metabolizes a variety of xenobiotics and carcinogens by transferring an acetyl group from acetyl-CoA to the primary amine of these drugs and carcinogens2,3. NAT1 can also hydrolyze acetyl-CoA to CoA in the presence of folate4–6 and regulate acetyl CoA levels within the cell7. NAT1 is often upregulated in breast cancer, and its expression has been shown to be associated with estrogen receptor expression in breast cancer8–10. Along with ESR1 (estrogen receptor 1), NAT1 expression is increased in primary breast tumors compared with normal breast tissues, and its expression is higher in ER+ compared with that in ER− primary breast tumors9.
In recent years, we and other have investigated the role of NAT1 in breast cancer using different in vitro model systems. Small molecule inhibitors, gene-specific siRNAs/shRNAs, and CRISPR/Cas9 knockout approaches have been used to inhibit or deplete NAT1 in both breast cancer and other cancer cell types7,11–14. One of the most reproducible findings from these studies is that inhibition or depletion of NAT1 result in a significant decrease in both anchorage-independent cell growth in breast cancer cell lines7,11,12. This indicates that NAT1 positively contributes to the growth and survival of breast cancer cells and may be essential for the cells to maintain resistance to anoikis, thereby promoting metastasis. Tiang and colleagues have published several reports that inhibition or depletion of NAT1 in cancer cells also results in changes in cell morphology and invasive and metastatic characteristics15. For instance, the authors reported that shRNA-mediated knockdown of NAT1 results in decreases in amount and size of filopodia and cell invasive characteristics in breast cancer cell lines. Moreover, when injected via tail vein of immune-compromised mice, NAT1-depleted cells formed a reduced number of colonies in the lung although no histological assessment was performed15. These previous reports suggest that NAT1 contributes to cell migration, invasion and metastasis of breast cancer cells. However, our initial in vitro experiments designed to measure changes in metastatic characteristics of NAT1 KO breast cancer cells failed to produce consistent results, which prompted us to investigate the role of NAT1 in cell migration and metastasis further.
In the present study, we studied the contribution of NAT1 to anchorage-independent growth, cell migration and metastasis using NAT1 KO breast cancer cell lines, including MDA-MB-231, MCF-7, and ZR-75-1. First, we tested the ability of parental vs. NAT1 KO breast cancer cell to grow in suspension using hanging-drop and poly-HEMA assays. In addition, we measured and compared the cell migratory behaviors in vitro between parental and NAT1 KO cells, using multiple approaches. Finally, to overcome the limitations of in vitro assays of cell growth and migration, we used immuno-compromised mice to perform xenograft assays by engrafting parental and NAT1 KO breast cancer cells via multiple methods of cell engraftment. The in vivo tumor growth and metastatic capacity were then compared between parental and NAT1 KO breast cancer cells.
Materials and Methods
NAT1 knockout (KO) breast cancer cell lines
NAT1 KO cell lines in MDA-MB-231, MCF-7, and ZR-75-1 breast cancer cell lines have been generated using CRISPR/Cas9 technology. Except for ZR-75-1, two different guide RNAs were used to generate two separate NAT1 KO cell lines (KO2 and KO5) for each parental cell line. Generation and characterization of NAT1 KO cell lines have been described elsewhere in detail7,16.
Growth of cells on poly-HEMA
The culture plates were coated with polyhydroxyethylmethacrylate (poly-HEMA) to prevent cell attachment. A total 1.3 g of poly-HEMA (Sigma-Aldrich) was dissolved in 33 mL of 99% ethanol, and the solution was mixed overnight at 37°C. Fifty microliters poly-HEMA stock solution was added to 96-well plates in the tissue culture hood, and plates and dishes were swirled using a plate rotator for 10 minutes. Plates were left to dry overnight and then washed with PBS immediately before use. Two-thousand cells per well were plated in 96-well plates coated with poly-HEMA and allowed to grow for up to 96 h before determining relative cell growth using alamarBlue. The cell growth of NAT1 KO cell lines were expressed relative to parental cell line.
Hanging-drop assay
Cell were trypsinized and resuspended in complete media. Cells were counted and concentration adjusted to a cell concentration underside lid 0.5 × 10⁶ cells/ml. Ten microliters of the above solution were pipetted on the underside of lid of a 10 cm plate with 5 ml of sterile 1X PBS in the bottom on the 10-cm culture dish. The lid was quickly inverted and put on the bottom 10 cm plate counterpart. Number of live cells was counted every 24 h for 96 h using trypan blue and a hemocytometer.
Cell invasion assay
The transwell assay was used to assess relative invasive ability of MDA-MB-231 cell lines. The permeable transwell inserts were coated with or without 100 μl of 0.5 mg/ml Matrigel (Life Technologies), and the Matrigel was allowed to solidify for 2 h at 37°C. Upper chambers of the transwells were seeded with either 25,000 or 50,000 cells in 100 μl of media containing no FBS. The bottom chamber of the transwells contained 600 μl of complete media containing 10% FBS. Cells were incubated at 37°C with 5% CO2 and allowed to migrate or invade across Matrigel to the bottom chamber for 24 h. After incubation, cells on the topside of the transwell membrane were removed with a sterile cotton swab. Cells that migrated across the membrane were counted utilizing crystal violet staining. Four separate determinations were performed in duplicate (N=4).
Spheroid formation and migration
Ten thousand MDA-MB-231 parental, NAT1 KO2 and KO5 cells were plated in Corning 96-well spheroid microplates that have ultra-low attachment to allow cells to form spheroids. Twenty-four hours after plating, cell media containing 6 μg/ml of collagen was added to each well to help formation of spheroid. Spheroids were grown for 4 days. After 4 days, spheroids were transferred in cell culture media (50 μl) to 6-well plates coated with Matrigel (500 μg/ml) (Corning) and allowed to attach for 2 h before taking initial pictures for spheroid size. After spheroid attachment normal cell culture media was added to the plates containing spheroid and migration out of the spheroid was measured at 24 and 48 h after plating. Initial spheroid area was measured by taking the area of the spheroid after plating. Spheroid migration area was quantitated by taking total spheroid area including new migration area minus the original spheroid area.
Live cell imaging
MDA-MB-231 parental and NAT1 KO cells were plated at a relatively low cell density on standard 6-well cell culture plates and allowed to attach for 24 h. Cells were imaged every 15 min for 24 h. The resulting images were analyzed using Keyence BZ-X800 software (Keyence) to measure total distance traveled (μm) and displacement (μm) for single cells.
Xenograft model for tumor growth and metastasis: initial study
NRGS (NOD/RAG1/2−/−IL2Rγ −/−TG [CMV-IL3, CSF2, KITLG]1Eav/J, stock no: 024099) mice producing 24 ng/ml of human IL-3, GM-CSF, and SCF were obtained from Jackson Laboratory and bred and maintained under standard conditions in the University of Louisville Rodent Research Facility on a 12-hour light/12-hour dark cycle with food and water provided ad libitum. Animal procedures were approved by the Institutional Animal Care and Use Committee. Approximately 6-month-old female mice were injected in the right flank by subcutaneous injection of 1 × 10⁶ cells in 100 μl, and the xenograft was allowed to grow for 36 days for MDA-MB-231 cell lines, and 122 days for MCF-7 and ZR-75-1 cell lines and form a primary tumor. Animals were euthanized by CO2 asphyxiation followed by cervical dislocation. The primary tumor was removed, weighed and frozen at −80°C. The whole lung, brain and a liver section were removed, fixed in neutral buffered formalin for 48 h before storing in 70% ethanol. Tissues were processed and embedded in paraffin. Five-micron sections of each tissue were processed and stained by H&E staining to look for metastasis at a secondary site. The number of separate metastases and percentage of lung consumed by metastasis was carried out by scanning and scoring the H&E-stained sections using Keyence BZ-X800 software (Keyence).
Xenograft model of tumor metastasis (flank, mammary fat-pad and tail-vein injections) of MDA-MB-231 parental and NAT1 KO cell lines
For the second set of xenograft model experiments, MDA-MB-231 cells were subcutaneously injected (1 × 10⁶ cells in 100 μl) into the right flank and allowed to grow until the primary tumor had a size of approximately 1 cm3 (5 female mice per cell line). For the mammary fat-pad xenograft experiment, 50,000 cells in 50 μl was subcutaneously injected under the right and left posterior nipples with 5 animals per cell line. Primary mammary fat-pad tumors were allowed to grow until they reached a combined size of approximately 0.75 cm3. For the tail-vein experiment, 1 × 10⁵ cells in 100 μl were injected into the tail vein of each mouse and allowed to seed and form tumors in the distant tissues for 20 days. The tail-vein xenograft model investigates metastasis by injecting the cancer cells directly into the blood stream without a need for a primary tumor formation to achieve metastasis. Thus, the tail vein study directly assessed metastasis without any intermediate steps. Once the animal’s tumor had reached the preselected tumor size criteria the animal was euthanized, and the primary tumor was removed. Primary tumors were weighed and flash frozen and stored at −80°C. The whole lung, brain, kidney, and a liver section were removed, fixed and embedded in paraffin. Tissue sections were cut and processed for staining by H&E to assess metastasis.
Western blot analysis
Protein isolation, quantification, and Western blot analysis were performed on flank tumors from the first xenograft study (shown in Fig. 5A). Tumors were homogenized in Cell Extraction Buffer (Thermo Fisher), protein concentration determined using BCA assay. Forty μg of protein was used for western blots using Bolt Bis-Tris gels (Life Technologies) and transferred to PVDF membranes, blocked with 5% non-fat milk in 1X TBST and then blotted for proteins using 1:5,000 dilutions for primary antibodies. Antibodies against cyclin D1 (Cat. No. 2978), Cyclin B1 (4138), PCNA (13110), cleaved caspase 3 (9664) and GAPDH (5174) were purchased from Cell Signaling, and Ki67 (ab16667), BCL-B (BCL2L10; ab45412) from Abcam. For secondary antibodies (Cell Signaling), 1:40,000 dilution was used. Proteins of interest were detected by using a chemiluminescence substrate.
Figure 5. Effect of NAT1 deletion on primary tumor growth and metastasis in a xenograft model.

Parental or NAT1 KO MDA-MB-231, MCF-7, and ZR-75-1 cells were injected in the right flank of NRGS mice and allowed to grow for 36 days for MDA-MB-231 cell lines, and 122 days for ZR-75-1 cell lines. The primary tumors were resected from the mice and weighed. A, photographs showing individual tumors found in mice injected with parental or NAT1 KO MDA-MB-231 or ZR-75-1 cell lines. B, the weight of primary tumor. One mouse injected with parental ZR-75-1 cells died before the end of the study. The lungs of the host mice injected with MDA-MB-231 cells were analyzed histologically (panels C and D). C, Representative micrographs showing H&E staining of the lung. Numerous foci of metastatic cells shown as darker patches were observed (arrows). D, the total number of metastatic foci (METs) in the lung (left panel). The percentage of the lung area occupied by METs (middle panel). The size/area of individual METs (right panel). Each data point represents an individual mouse and graphs illustrate mean ± SEM (n=4–5). *, p<0.05; **, p<0.01; ***, p<0.001. P, parental; KO2, NAT1 KO cell line #2. KO5, NAT1 KO cell line #5.
Statistical analyses
For MDA-MB-231 and MCF-7 cell lines, differences between the parental and NAT1 KO cell lines were analyzed for significance by ANOVA followed by Dunnett post hoc test which tests differences in the KO2 or KO5 NAT1 KO relative to the parental cell line. For ZR-75-1 cells, differences between the parental and NAT1 KO cell lines were analyzed for significance by Student’s t-test. All statistical analyses were performed using GraphPad Prism v6.0c (GraphPad Software). All results are expressed as the mean ± the standard error of the mean (SEM). Values of p<0.05 were considered statistically significant.
Results
Anchorage-independent growth
We and others have previously shown that inhibition or depletion of NAT1 in breast cancer cells significantly reduces their ability to grow in soft agar7,11–13, suggesting that NAT1 contributes to the anchorage-independent growth of the cells which normally reflects their metastatic potential17. We sought to confirm this finding further using additional assays designed to test the ability of the parental and NAT1 KO breast cancer cells to grow in suspension. We previously generated and characterized NAT1 KO cells in MDA-MB-231, MCF-7, and ZR-75-1 breast cancer cell lines7. The parental and NAT1 KO cells were cultured either in a hanging-drop or on poly-HEMA-coated surfaces to subject them to anchorage-independent growth conditions. For MCF-7 and ZR-75-1 cell lines, there was no a significant difference in cell growth in hanging drops between the parental and NAT1 KO cell lines (Fig. 1B and C), but for MDA-MB-231 cells, there were significant differences (i.e., decreased cell numbers in NAT1 KO cells) between the parental and NAT1 KO cell lines at 24 and 96 h, but not at 48 or 72 h (Fig. 1A). We did not observe a significant difference in growth on poly-HEMA between the parental and NAT1 KO cell lines for either MDA-MB-231 and MCF-7 cell lines at any of the time points (Fig. 1D and E). However, we observed a modest, yet significant reduction in growth on poly-HEMA with ZR-75-1 NAT1 KO cells only at 48 and 72 h, compared to the parental cells (Fig. 1F). Despite of the statistically significant differences in anchorage-independent growth with selective cell lines and at some of the time points, both assays did not demonstrate a robust and consistent decline in the ability of the NAT1 KO cells to grow in suspension.
Figure 1. Effect of NAT1 deletion on anchorage-independent growth of breast cancer cells.

Parental and NAT1 KO MDA-MB-231, MCF-7, and ZR-75-1 breast cancer cells were grown in suspension using two methods. A-C, Cell growth in a hanging-drop. Five-thousand parental or NAT1 KO MDA-MB-231, MCF-7, or ZR-75 cells were cultured while being suspended from the cover of a culture dish, and the number of live cells was counted every 24 h for 96 h using hemocytometer. D-F, Relative cell growth on a non-adherent, poly-HEMA-coated surface. Two-thousand cells were plated on poly-HEMA-coated surface and allowed to grow for up to 96 h before determining relative cell growth (compared to each respective parental cell line) using alamarBlue. Three individual replicates were conducted (n=3) for all experiments, and the graphs represent the mean ± SEM. *, significantly lower (p<0.05) values in NAT1 KO cells; **, p<0.01; ***, p<0.001. P, parental; KO2, NAT1 KO cell line #2. KO5, NAT1 KO cell line #5.
Cell morphology and actin cytoskeleton
Previously, Tiang and colleagues knocked down NAT1 using shRNA in the triple-negative breast cancer cell lines, MDA-MB-231, MDA-MB-436, and BT-549, and observed changes in cell morphology15. Notably, the number and size of the filopodia protrusions were reduced in cells expressing NAT1 shRNA15. To confirm this finding, we performed phalloidin staining of F-actin on parental and NAT1 KO MDA-MB-231, MCF7, and ZR-75-1 breast cancer cells and performed qualitative assessments of cell morphology In parental cell lines, membrane protrusions resembling lamellipodia and filopodia were readily observed (Fig. 2; arrows). In contrast, NAT1 KO cells exhibited relatively rounded morphology due to lack of cell protrusions. In addition, NAT1 KO cells showed diffused and reduced F-actin staining (Fig. 2). These findings are largely consistent with observations made by Tiang and colleagues15, and indicate that cytoskeleton organization is altered in the absence of NAT1 and that NAT1 KO cells may exhibit altered cell migratory behavior as a result.
Figure 2. Effect of NAT1 deletion on cell morphology and actin cytoskeleton organization in breast cancer cells.

Parental and NAT1 KO MDA-MB-231, MCF-7, and ZR-75-1 breast cancer cells were stained with AlexaFluor 568-conjugated phalloidin for F-actin (red) and counterstained with DAPI for nuclei (blue in Overlay). The cells were plated on chamber slides and allowed to attach for 48 h before staining for F-actin. Loss of NAT1 alters cell morphology and actin cytoskeleton reorganization in MDA-MB-231, MCF-7 and ZR-75-1 breast cancer cells. Parental cells exhibit prominent lamellipodia-like or filopodia-like cellular protrusions (arrows) which are largely missing in NAT1 KO cells. Representative images are shown here. P, parental; KO2, NAT1 KO cell line #2. KO5, NAT1 KO cell line #5. Scale bar represents 10 μM.
Cell invasion assay
The ability of cancer cells to invade across the extracellular matrix is one of the key events for metastasis to occur18. To evaluate the invasive characteristics of the parental vs. NAT1 KO MDA-MB-231 cells, we performed a transwell/Boyden chamber assay and measured the ability of the cells to migrate across a porous membrane and through Matrigel (which resembles the complex extracellular matrix) (Fig. 3A). The relative invasiveness was calculated by dividing the number of cells that invaded through the Matrigel by the number of cells that migrated through no Matrigel and expressed as a percentage. The relative invasion ability did not differ significantly between parental and NAT1 KO (both KO2 and KO5) MDA-MB-231 cells (Fig. 3B).
Figure 3. Effect of NAT1 deletion on cell invasion and migration characteristics in MDA-MB-231 breast cancer cells.

A and B, Cell invasion assay. The parental and NAT1 KO MDA-MB-231 breast cancer cells were plated on Transwell® membranes covered with (0.5 mg/ml) or without (0.0 mg/ml) Matrigel, and cells migrated to the bottom side was quantified A, Representative photomicrographs taken of Transwell® membranes showing the cells that were able to reach the bottom side of the membrane either with or without Matrigel (panel A). Relative invasion ability for parental and NAT1 KO MDA-MB-231 cell lines (panel B). ‘Relative invasion ability’ was calculated by dividing the number cells that invaded through Matrigel (0.5 mg/ml with 50,000 cells) by the number of cells that migrated through no Matrigel (0.0 mg/ml with 25,000 cells) and expressed as a percentage. The bar graphs show the mean ± SEM (n=4). C-F, Spheroid formation and cell migration in MDA-MB-231 breast cancer cells. The parental or NAT1 KO MDA-MB-231 cells (KO2 and KO5) were plated on a low-adherent culture plate to allow cells to form spheroids. After 4 days of culture, the spheroids were transferred to plates coated with Matrigel and allowed to attach before taking the initial size (i.e., area in arbitrary units) of the spheroids (0 h; panel D). The cell migration out from the spheroid was measured at 24 and 48 h after plating (panels E and F). The area which newly migrated cells occupied (i.e., “Spheroid Migration Area”) was calculated by subtracting the total area at each time point (at 24 or 48 h) by the original area of the same spheroid (at 0 h) and was used as an index of cell migration. Representative micrographs of spheroids at indicated time points are shown in panel C. The graphs show the mean ± SEM. P, parental; KO2, NAT1 KO cell line #2. KO5, NAT1 KO cell line #5.
Spheroid formation and migration
Spheroids are thought to better recapitulate the in vivo situation of tumors than cell monolayers, as they are composed of proliferating, non-proliferating, well-oxygenated, hypoxic and necrotic cells19. In this experiment, parental and NAT1 KO MDA-MB-231 cells were allowed grow and form spheroids on a non-adherent surface for 4 days, after which they were transferred to a culture dish coated with Matrigel. We then measured the initial size/area of each spheroid and monitored the migration of the cells out of the spheroid by calculating the area newly covered by the migrating cells at 24 and 48 h (Fig. 3C). The initial size of the spheroids formed by the cells was not significantly different between the parental and NAT1 KO cells (Fig. 3D), which suggested that the parental and NAT1 KO cells have a similar growth rate under the condition. Moreover, the area occupied by newly migrated cells (out of the spheroids) was not significantly different between the parental and NAT1 KO cells at 24 or 48 h (Fig. 3E and F), suggesting that cell migration out of the spheroid is not compromised in NAT1 KO MDA-MB-231 cells.
Live cell imaging of cell motility
To monitor migratory behaviors of individual, isolated cells, parental and NAT1 KO MDA-MB-231 cells were plated at a relatively low density and monitored by live-cell imaging for 24 h. The resulting images were then analyzed to measure the total distance traveled by individual cells and displacement from the point of their origin. ‘Displacement’ is a vector quantity that refers to object’s overall change in position and differs from ‘distance’. In the context of our experiment, it indicates how far the cell is from its initial position. Compared to the parental cells, NAT1 KO cells showed a modest decrease in total distance traveled in 24 h, with the difference reaching the statistical significance (p<0.05) only between the parental and KO2 cells (Fig. 4A). Both NAT1 KO cell lines (i.e., KO2 and KO5) exhibited a significantly (p<0.01) lower displacement (Fig. 4B), which suggests that NAT1 KO cells are less likely to migrate out of their local environment. This was in contrast with the results from the aforementioned cell invasion and spheroid migration experiments.
Figure 4. Effect of NAT1 deletion on individual cell motility in MDA-MB-231 breast cancer cells.
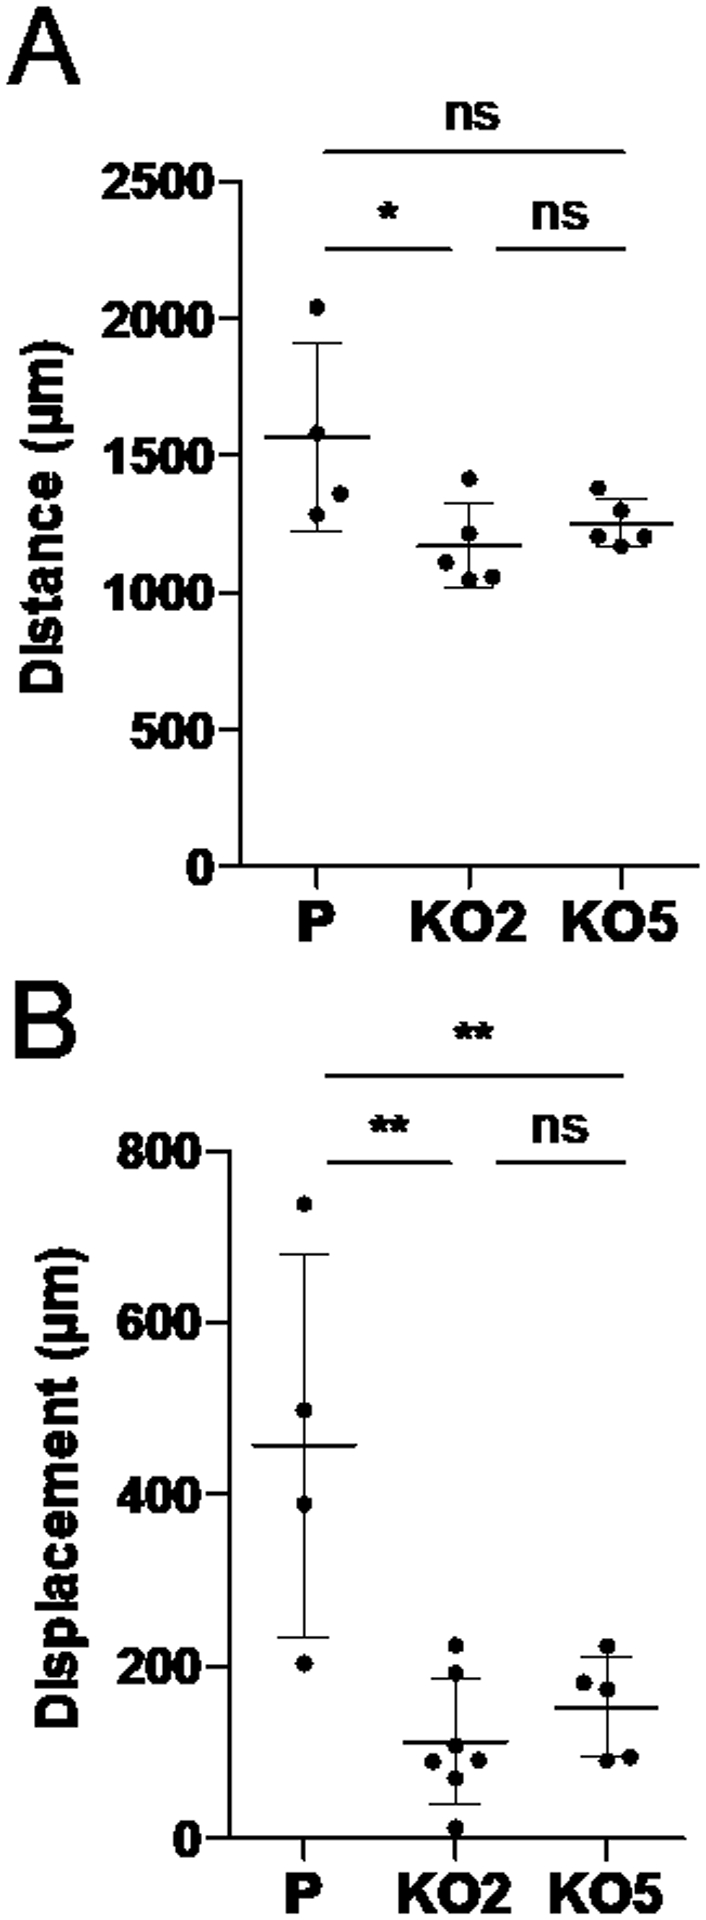
Live-cell imaging of the parental and NAT1 KO MDA-MB-231 cells. The parental and NAT1 KO (KO2 and KO5) cells were plated on standard culture plates and allowed to attach for 24 h. The cells were continuously monitored every 15 min for 24 h to track movement of individual cells in the field. Based on the images acquired, the total distance traveled (in μm) and displacement (in μm) were measured for individual cells. The graphs represent the mean ± SEM (n=4–7 per group). *, p<0.05; **, p<0.01. P, parental; KO2, NAT1 KO cell line #2. KO5, NAT1 KO cell line #5.
Xenograft model for in vivo tumor growth and metastasis
Since the in vitro assays of anchorage-independent growth and cell migration/invasion resulted in findings either inconsistent with each other or contradictory to those from previous reports7,11–13,15, we decided to perform xenograft assays to test the ability of parental vs. NAT1 KO cells to grow and metastasize in a physiologically relevant environment. Immunocompromised NRGS mice were subcutaneously injected in the right flank with the parental or NAT1 KO cells and allowed to grow for 36 days for MDA-MB-231 cell lines, and 122 days for MCF-7 and ZR-75-1 cell lines. All animals injected with MDA-MB-231 in the right flank were euthanized at the same time once tumor size for any animal reached the maximum size allowed by IACUC. For MDA-MB-231 cells, both NAT1 KO cell lines formed tumors visibly smaller than those by the parental cells (Fig. 5A). Accordingly, the average weight of the primary tumors formed by NAT1 KO cells (both KO2 and KO5) was significantly lower than that by the parental cells (Fig. 5B). Mice injected with parental or NAT1 KO ZR-75-1 cells formed flank tumors that did not differ significantly in size or weight (p=0.2199) (Fig. 5A and B). Histological assessment of the lung, brain, and liver revealed no metastasis in animals engrafted ZR-75-1 cells. MCF-7 cell lines failed to form primary tumors even after 122 days, presumably due to the lack of estradiol supplementation20. Although metastasis was not detected in liver or brain at gross histological level, lung tissue sections from animals engrafted with MDA-MB-231 cell lines revealed robust metastasis. Representative images of lung metastasis are shown in Figure 5C. The percentage of the area containing metastatic foci (METs) and the size of individual METs in the lung were significantly lower with NAT1 KO cells compared to the parental cells (Fig. 5D, middle and right panels). However, the total number of METs in the lung were not significantly different between the parental and NAT1 KO MDA-MB-231 cell lines (Fig. 5D, left panel). These observations suggested that, although the ability for the primary and secondary tumors to grow in vivo is compromised in NAT1 KO MDA-MB-231 cells, their ability to metastasize to the lung per se is not reduced.
In vivo tumor growth and metastasis following additional modes of engraftment
Since metastasis can be influenced by the size of the primary tumor, additional experiments were conducted to further compare the metastatic ability of the parental and NAT1 KO MDA-MB-231 cell lines. We employed three different methods of engraftment to establish the xenografts. The first protocol involved injection of cancer cells into the flank and allowing the primary tumor to grow to a pre-determined size (tumor volume of approximately 1 cm3) prior to euthanasia. For the second protocol, the cells were injected into the mammary fat pads and allowed to grow to a pre-determined size (combined tumor volume of approximately 0.75 cm3). The purpose of the first two methods was to assess and compare the extent of lung metastasis of each cell line independent of its primary tumor size. The primary tumors established in the flank were allowed to grow for 21 to 48 days to reach a mass of approximately of 1 cm3. The NAT1 KO cells showed a slower growth rate (as previously shown in Fig. 5), and as a result, the number of days taken to reach the tumor size of approximately 1 cm3 was significantly higher (p=0.0051) following injection of NAT1 KO cells (both KO2 and KO5) compared to the parental cells (Fig. 6A). As intended, the weight of the primary tumors formed by the parental and NAT1 KO cells did not differ significantly (p>0.05) at the time of euthanasia (Fig. 6D). Similarly, following the engraftment in mammary fat pads, the number of days taken to reach a combined tumor size of 0.75 cm3 were also significantly higher (p=0.0028) with NAT1 KO cells (both KO2 and KO5) compared to the parental cells (Fig. 6B), which reflected the reduced growth rate of NAT1 KO cells. As expected, the weight of the primary tumors formed in the mammary fat pads by the parental and NAT1 KO cells did not differ significantly (p>0.05) at the time of euthanasia (Fig. 6E). Metastasis to the lung was assessed histologically in each animal. Interestingly, when primary tumors were allowed to grow to a similar size, there was no consistently significant difference between the parental and NAT1 KO cell lines (KO2 and KO5) in the number of METs, percent of area containing METs, or size of individual METs in both models (i.e., flank and fat pad injections) (Fig. 6J–R).
Figure 6. Formation of xenograft by parental vs. NAT1 KO MDA-MB-231 cells following different engraftment protocols.

NRGs mice were injected into the flank (panels A, D, and G) or the fat pads (panels B, E, and H) or via the tail vein (panels C, F, and I) with parental or NAT1 KO (KO2 and KO5) MDA-MB-231 breast cancer cells. Following flank and fat-pad injections, the primary tumors were allowed to grow to a pre-determined size prior to euthanasia. The mice which received tail-vein injections were euthanized after 20 days. A and B, the number of days taken to reach a pre-determined size (approximately 1 cm3 for flank injections and 0.75 cm3 for fat-pad injections). D and E, the weight of primary tumors at the time of euthanasia. G-I, the weight of lungs at the time of euthanasia. NAT1 KO cells had a slower growth rate in vivo, and as a result, it took more days to reach the pre-determined size, compared to the parental cells (panels A and B). At the time of euthanasia, the average weight of the primary tumors (panels D and E) or the lungs (panels G-I) did not differ significantly between the groups. Each data point represents an individual mouse and graphs illustrate mean ± SEM (n=5). Panels J-R, MDA-MB-231 parental and NAT1 KO cell lines were subcutaneous injected into the right flank and allowed to grow until the primary tumor had a size of about 1 cm3 (panels J, M and P). For the mammary fat-pad xenografts, the cells were injected subcutaneously under the right and left posterior nipples, and the primary tumors were allowed to grow until they reached approximate combined size of 0.75 cm3 (panels H, K, and N). For tail-vein injections animals were euthanized after 20 days (panels L, O, and R). Number of METs per lung (panels J-L), percent of the lung area containing METs (panels M-O), size of individual METs (panels P-R) in mice engrafted with the parental and NAT1 KO with MDA-MB-231 cells. Each data point represents an individual mouse and graphs illustrate mean ± SEM (n=5). *, significantly lower in mouse injected with NAT1 KO cells (p<0.05); **, p<0.01. P, parental; KO2, NAT1 KO cell line #2. KO5, NAT1 KO cell line #5.
The third protocol involved tail-vein injection of MDA-MB-231 cell lines. The tail-vein injection model was used to investigate the metastatic potential of the cells independent of the primary tumor formation by allowing the cancer cells to survive in the circulation and directly seed onto distant organs. All mice were euthanized, and their lungs were extracted after 20 days of injection. There was not a significant difference (p<0.05) in total lung weight between any of the cell lines (Fig. 6I). Histological examination revealed that, in all cases, lung metastasis occurred. The number of METs found in the lung was not, however, different between any of the cell lines (Fig. 6L). With respect to the area of the lung covered by METs and average size of individual METs, they were significantly higher with one of the NAT1 KO cell lines (i.e., KO5), compared to the parental cells (Fig. 6O and R). However, such increase was not reproduced with NAT1 KO2 cells (Fig. 6O and R).
Cell proliferation and death (apoptosis) in primary tumors
In order to better understand the mechanism by which NAT1 KO tumors have reduced growth, we analyzed the primary tumors from parental or NAT1 KO MDA-MB-231 cells for markers of cell proliferation (cyclin D1, cyclin B1, Ki67, and PCNA) and apoptosis (cleaved caspase 3 and BCL-B). Although the protein level of PCNA was consistently reduced in both NAT1 KO (i.e., KO2 and KO5) tumors, levels of other markers of cell proliferation such as cyclin D1, cyclin B1, and Ki67 were not significantly or consistently different between parental and NAT1 KO tumors (Fig. 7), suggesting that the rate of cell proliferation is not significantly diminished in NAT1 KO tumors. In contrast, there was pronounced differences in apoptotic markers we measured. The level of cleaved caspase 3, which represents a late apoptotic marker21, was elevated in NAT1 KO tumors, while an anti-apoptotic protein, BCL-B22, was reduced in NAT1 KO tumors, compared to the parental tumors (Fig. 7). These results suggest that, in the absence of NAT1, MDA-MB-231 cells exhibit a higher rate of cell death (apoptosis) in vivo.
Figure 7. Levels of cell proliferation and apoptosis markers in primary tumors of parental vs. NAT1 KO MDA-MB-231 cells.

The primary tumors formed by parental and NAT1 KO cells (n=5 for each group) were analyzed by Western blot for indicated markers. GAPDH served as a loading/internal control.
Discussion
Recent studies have shown that NAT1 is frequently upregulated in breast cancer and suggested that it plays a positive role in breast cancer growth and development7–9,11–13,15,16. These reports showed that NAT1 not only contributes to the growth but also migration and metastasis of breast cancer cells. Studies by Tiang and colleagues explored the role of NAT1 in the growth and invasiveness of breast cancer cells both in vitro and in vivo11,12,15. The authors reported that inhibition or knockdown of NAT1 often result in morphological changes characterized by less and smaller filopodia, and this was accompanied by a reduction in the migratory and invasive characteristics in breast cancer cell lines, including MDA-MB-23115. These findings suggested that the mechanism by which NAT1 knockdown inhibits invasion and metastasis in breast cancer cells may involve modulation of cytoskeleton and formation of filopodia15. Furthermore, when MDA-MB-231 cells expressing NAT1 shRNA were injected into the lateral tail vein of BALB/c nu/nu nude mice, they formed a significantly smaller number of metastatic colonies formed on the lungs (macro-metastases), compared to the control cells15. However, no histological assessments were performed in the study. The potential role of NAT1 in growth and metastasis of breast cancer was also apparent according to our previous reports. In our study, the deletion of NAT1 (i.e., NAT1 KO) in three different breast cancer cell lines (MDA-MB-231, MCF-7, and ZR-75-1) all resulted in a marked reduction in their ability to grow in soft agar7. Similarly, Malagobadan and colleagues found that microRNA-6744–5p is downregulated in an anoikis-resistant line of MCF-7 cells and demonstrated that it promotes anoikis and in vivo tumor metastasis in breast cancer cell lines, including MDA-MB-23123. The authors reported that microRNA-6744–5p directly targets NAT1, which implied that high NAT1 level correlates with increased metastatic potential of breast cancer cells.
However, our preliminary studies that were designed to investigate the role of NAT1 in breast cancer metastasis failed to produce results consistent with the previous findings outlined above. This led us to employ multiple approach in characterizing the contribution of NAT1 to metastasis, using NAT1 KO cell lines we previously generated7. First of all, deletion of NAT1 did not significantly affect the ability of the cells to grow in suspension (see Fig. 1), suggesting that NAT1 is not essential for their ability to resist anoikis. Secondly, three different approaches of measuring cell migration/invasion failed to produce consistent results (see Figs. 3–4). The ability of the cells to migrate through extracellular matrix or migrate out of spheroids was not significantly altered in NAT1 KO cells (see Fig. 3). Although live-cell imaging indicated that the NAT1 KO MDA-MB-231 cells are less likely to migrate out of their local environments (see Fig. 4B), the total distance traveled was not significantly altered in both of the NAT1 KO cell lines (see Fig. 4A). Taken together, these findings contrasted to those of the aforementioned previous reports and are not supportive of a role for NAT1 in breast cancer metastasis. Other groups have reported results regarding the role of NAT1 in breast cancer migration/invasion. A recent report by Li and colleagues showed that that deletion of NAT1 in MDA-MB-231 cells up-regulated matrix metalloproteinase (MMP) expression, in particular MMP9. Although the role of MMPs in cancer metastasis appears complex24, increased MMP expression is generally thought to be associated with the invasive nature of many cancers25. Thus, the increased MMP9 expression in NAT1 KO cells is not in agreement with the preceding reports of a decrease in invasion following NAT1 deletion or inhibition. Moreover, in a follow-up study, the authors reported that deletion of NAT1 in MDA-MB-231, HT-29 and HeLa cells did not affect cell migration and rather increased adherence to collagen in all three cell-lines26.
With MDA-MB-231 cells which showed robust cell growth in vivo, metastasis to the lung was readily observed in all animals. The metastatic focus formed by NAT1 KO cells were significantly smaller compared to the parental cells, and as a result, the area of the lung occupied by metastatic cells was also significantly less (see Fig. 5C and D). The number of metastatic foci present in the lung was, however, not significantly different between parental and NAT1 KO cells (see Fig. 5D, right panel), suggesting that the frequency of cell metastasis, and thus the ability of the cells to metastasize, was not significantly diminished in NAT1 KO cells. The second set of xenograft experiments we conducted supported this notion. When the primary tumors were grown to a pre-determined size either in the flank or in the mammary fat pads, the difference in the metastatic cells found in the lung between parental and KO cells was no longer present (see Fig. 6). Moreover, tail-vein injection of the cells was performed to circumvent the issue of the difference in cell engraftment and primary tumor growth. The result suggested that one of the NAT1 KO cell lines, KO5, more readily metastasize to the lung. However, such was not observed with KO2 cells, and KO5 cells did not induce a greater number of metastatic foci (see Fig. 6). Taken together, our findings suggest that NAT1 contributes to growth of both primary and secondary tumors by MDA-MB-231 yet does not contribute significantly to lung metastasis. The latter is also consistent with the results of our in vitro studies that failed to show significant and reproducible differences in anchorage-independent growth and cell migration between parental and NAT1 KO cells (see Figs. 1 and 3).
Analysis of cell proliferation and apoptosis in primary tumors formed by parental and NAT1 KO MDA-MB-231 cells suggest that the rate of cell proliferation in vivo is not significantly altered in NAT1 KO cells, compared to the parental cell counterpart (see Fig. 7). In contrast, the higher levels of cleaved caspase 3 in NAT1 KO tumors indicated that NAT1 KO cells in vivo exhibit a higher rate of cell death (apoptosis). This was also supported by the lower levels of an anti-apoptotic protein, BCL-B, in NAT1 KO tumors. Hence, it appears that the reduced primary growth observed in NAT1 KO cells is, at least in part, contributed by an increased rate of cell death. Although the mechanism by which NAT1 deficiency leads to increased cell death in breast cancer cells is currently unclear, it is possible that the mitochondrial dysfunction previously described in NAT1 KO cells might have contributed to this (see below for more discussions). In addition, our recent reports on metabolomics and transcriptomics analysis of parental vs. NAT1 KO MDA-MB-231 cells provides other possible mechanisms27,28. Differential levels of metabolites in NAT1 KO MDA-MB-231 cells suggested that deletion of NAT1 leads to defects in de novo pyrimidine biosynthetic pathway as well as in β-oxidation pathway for fatty acid metabolism27. Specifically, both NAT1 KO cell lines showed a significant and concomitant decreases in the level of intermediates involved in the pyrimidine biosynthetic pathway, including N-carbamoylaspartate, orotate, UTP, and CDP. Pyrimidine nucleotides play a critical role in cellular metabolism and proliferation, as well as DNA repair29–32. It is plausible that the defect in the de novo pyrimidine biosynthesis pathway may not only hinder the cell growth but also deter DNA repair in NAT1 KO MDA-MB-231 cells, thus contributing to increased cell death.
Previously studies suggested that NAT1 KO MDA-MB-231 breast cancer cells exhibit mitochondrial dysfunction16,33, and this may be responsible for the decrease in tumor growth in vivo. Wang and colleagues compared the mitochondrial respiration between the parental and NAT1 KO MDA-MB-231 and HT-29 cells. NAT1 deletion in these cells lines resulted in a decrease oxidative phosphorylation with a significant loss in respiratory reserve capacity33. The authors also showed that the decrement in mitochondrial function in NAT1 KO cells was due to a decrease in pyruvate dehydrogenase activity33. In line with this finding, our previous metabolomics study on parental vs. NAT1 KO MDA-MB-231 cells showed that the levels of the intermediates in mitochondrial β-oxidation of fatty acids were altered in NAT1 KO cells16, which may reflect mitochondrial dysfunction in the KO cells. Furthermore, polymorphisms in NAT2 (an isozyme of NAT1) gene have been implicated in differential mitochondrial structure and function and development of insulin resistance34,35. However, it is currently unclear how NAT1 may play a role in mitochondrial biogenesis and/or function and if mitochondrial dysfunction represents the primary defect responsible for the growth retardation observed in NAT1 KO MDA-MB-231 cells in the current study.
Recent studies support the notion that NAT1 contributes to metastasis of (luminal) breast cancer to the bone. Savci-Heijink et al. analyzed gene signatures associated with the bone metastasis of breast cancer and found that NAT1 is one of three genes whose increased expression levels were highly correlated to epithelial-to-mesenchymal transition (EMT)-activated breast tumor36. In a subsequent paper, the authors reported that immunostaining for NAT1 and expression of EMT signature genes are highly correlated in breast cancer37, suggesting that increased NAT1 expression may contribute to the EMT of breast cancers and subsequently to their metastatic potential. In support of this notion, a recent study by Zhao and colleagues reported that NAT1 is frequently upregulated in luminal breast cancer and that high NAT1 expression is negatively correlated with the bone metastasis-free survival in patients with luminal breast cancer38. The authors showed that NAT1 knockdown via shRNA in MCF-7 and T47D breast cancer cell lines result in a reduction in cell migration and colony formation in vitro. The in vivo experiment demonstrated that NAT1 promotes bone metastasis of luminal breast cancer cells, which could be reversed by NAT1 inhibitor treatment. In contrast, the findings from the present study indicate that NAT1 does not play a significant role in lung metastasis of a triple-negative breast cancer cell line, MDA-MB-231. It is possible that NAT1 may play a role specifically in bone metastasis of luminal breast cancer. The study by Zhao and colleagues showed that the conditioned media from NAT1-overexpressing cell line promoted osteoclast differentiation of bone marrow mononuclear cells and suggested that bone destruction by osteoclasts helps the breast cancer cells establish a metastatic niche in the bone38. This was attributed to activation of NF-κB and subsequent secretion of IL1β. Interestingly, addition of IL1β was sufficient enough to restore the cell migration and colony formation, as well as the ability to promote osteoclast differentiation of bone marrow-derived cells by NAT1 knockdown cells38. These results provided strong evidence that NAT1 contributes to the bone metastasis of luminal breast cancer. In the present study, we did not examine bone metastasis of MDA-MB-231 cells (triple-negative). Although the rate of lung metastasis in patients with triple-negative breast cancer is as high as 40%, bone metastasis is less common, found only in 10% of the patients39. Of note, the rate of bone metastasis in triple-negative breast cancer is much lower than that in non-triple-negative breast cancer patients (i.e., ~40%)39. For this reason, the present study mainly focused on the lung metastasis. The only luminal breast cancer cell line we tested, MCF-7, failed to form primary tumors, and thus we were unable to assess the contribution of NAT1 to bone metastasis in the present study.
In conclusion, our study shows that genetic deletion of NAT1 in MDA-MB-231 breast cancer cells result in a significant reduction in primary and secondary tumor growth in a xenograft model with no significant effects on their metastatic capacity. Additional studies are needed to understand the mechanism of the growth promoting effects of NAT1 on breast cancer.
Funding:
This research was funded by National Institutes of Health grant numbers R25-CA134283, P30-ES030283 and F31-DK126400.
Abbreviations:
- NAT1
arylamine N-acetyltransferase 1
- KO
knockout
- poly-HEMA
polyhydroxyethylmethacrylate
- SEM
standard error of the mean
- P
parental
- KO2
NAT1 knockout cell line #2
- KO5
NAT1 knockout cell line #5
Footnotes
Conflict of Interest
The authors declare no conflict of interest.
Data Availability Statement
The data presented in this study are available on request from the corresponding author.
References
- 1.Huang S, Murphy L, Xu W. Genes and functions from breast cancer signatures. BMC Cancer. 2018;18(1):473. doi: 10.1186/s12885-018-4388-4 [DOI] [PMC free article] [PubMed] [Google Scholar]
- 2.Hein DW. Molecular genetics and function of NAT1 and NAT2: role in aromatic amine metabolism and carcinogenesis. Mutat Res. 2002;506–507: 65–77. doi: 10.1016/s0027-5107(02)00153-7 [DOI] [PubMed] [Google Scholar]
- 3.Hein DW, Doll MA, Fretland AJ, et al. Molecular genetics and epidemiology of the NAT1 and NAT2 acetylation polymorphisms. Cancer Epidemiol Biomarkers Prev. 2000;9(1):29–42. [PubMed] [Google Scholar]
- 4.Stepp MW, Doll MA, Samuelson DJ, Sanders MAG, States JC, Hein DW. Congenic rats with higher arylamine N-acetyltransferase 2 activity exhibit greater carcinogen-induced mammary tumor susceptibility independent of carcinogen metabolism. BMC Cancer. 2017;17(1):233. doi: 10.1186/s12885-017-3221-9 [DOI] [PMC free article] [PubMed] [Google Scholar]
- 5.Laurieri N, Kawamura A, Westwood IM, et al. Differences between murine arylamine N-acetyltransferase type 1 and human arylamine N-acetyltransferase type 2 defined by substrate specificity and inhibitor binding. BMC Pharmacol Toxicol. 2014;15:68. doi: 10.1186/2050-6511-15-68 [DOI] [PMC free article] [PubMed] [Google Scholar]
- 6.Stepp MW, Mamaliga G, Doll MA, States JC, Hein DW. Folate-Dependent Hydrolysis of Acetyl-Coenzyme A by Recombinant Human and Rodent Arylamine N-Acetyltransferases. Biochem Biophys Rep. 2015;3:45–50. doi: 10.1016/j.bbrep.2015.07.011 [DOI] [PMC free article] [PubMed] [Google Scholar]
- 7.Stepp MW, Salazar-González RA, Hong KU, Doll MA, Hein DW. N-Acetyltransferase 1 Knockout Elevates Acetyl Coenzyme A Levels and Reduces Anchorage-Independent Growth in Human Breast Cancer Cell Lines. J Oncol. 2019;2019:3860426. doi: 10.1155/2019/3860426 [DOI] [PMC free article] [PubMed] [Google Scholar]
- 8.Zhang X, Carlisle SM, Doll MA, et al. High N-Acetyltransferase 1 Expression Is Associated with Estrogen Receptor Expression in Breast Tumors, but Is not Under Direct Regulation by Estradiol, 5α-androstane-3β,17β-Diol, or Dihydrotestosterone in Breast Cancer Cells. J Pharmacol Exp Ther. 2018;365(1):84–93. doi: 10.1124/jpet.117.247031 [DOI] [PMC free article] [PubMed] [Google Scholar]
- 9.Carlisle SM, Hein DW. Retrospective analysis of estrogen receptor 1 and N-acetyltransferase gene expression in normal breast tissue, primary breast tumors, and established breast cancer cell lines. Int J Oncol. 2018;53(2):694–702. doi: 10.3892/ijo.2018.4436 [DOI] [PMC free article] [PubMed] [Google Scholar]
- 10.Minchin RF, Butcher NJ. Trimodal distribution of arylamine N-acetyltransferase 1 mRNA in breast cancer tumors: association with overall survival and drug resistance. BMC Genomics. 2018;19(1):513. doi: 10.1186/s12864-018-4894-4 [DOI] [PMC free article] [PubMed] [Google Scholar]
- 11.Tiang JM, Butcher NJ, Minchin RF. Small molecule inhibition of arylamine N-acetyltransferase Type I inhibits proliferation and invasiveness of MDA-MB-231 breast cancer cells. Biochem Biophys Res Commun. 2010;393(1):95–100. doi: 10.1016/j.bbrc.2010.01.087 [DOI] [PubMed] [Google Scholar]
- 12.Tiang JM, Butcher NJ, Cullinane C, Humbert PO, Minchin RF. RNAi-mediated knock-down of arylamine N-acetyltransferase-1 expression induces E-cadherin up-regulation and cell-cell contact growth inhibition. PLoS ONE. 2011;6(2):e17031. doi: 10.1371/journal.pone.0017031 [DOI] [PMC free article] [PubMed] [Google Scholar]
- 13.Stepp MW, Doll MA, Carlisle SM, States JC, Hein DW. Genetic and small molecule inhibition of arylamine N-acetyltransferase 1 reduces anchorage-independent growth in human breast cancer cell line MDA-MB-231. Mol Carcinog. 2018;57(4):549–558. doi: 10.1002/mc.22779 [DOI] [PMC free article] [PubMed] [Google Scholar]
- 14.Leggett CS, Doll MA, Salazar-González RA, Habil MR, Trent JO, Hein DW. Identification and characterization of potent, selective, and efficacious inhibitors of human arylamine N-acetyltransferase 1. Arch Toxicol. Published online November 16, 2021. 2022;96(2):511–524. doi: 10.1007/s00204-021-03194-x [DOI] [PMC free article] [PubMed] [Google Scholar]
- 15.Tiang JM, Butcher NJ, Minchin RF. Effects of human arylamine N-acetyltransferase I knockdown in triple-negative breast cancer cell lines. Cancer Med. 2015;4(4):565–574. doi: 10.1002/cam4.415 [DOI] [PMC free article] [PubMed] [Google Scholar]
- 16.Carlisle SM, Trainor PJ, Doll MA, Stepp MW, Klinge CM, Hein DW. Knockout of human arylamine N-acetyltransferase 1 (NAT1) in MDA-MB-231 breast cancer cells leads to increased reserve capacity, maximum mitochondrial capacity, and glycolytic reserve capacity. Mol Carcinog. 2018;57(11):1458–1466. doi: 10.1002/mc.22869 [DOI] [PMC free article] [PubMed] [Google Scholar]
- 17.Freedman VH, Shin SI. Cellular tumorigenicity in nude mice: correlation with cell growth in semi-solid medium. Cell. 1974;3(4):355–359. doi: 10.1016/0092-8674(74)90050-6 [DOI] [PubMed] [Google Scholar]
- 18.Iwatsuki M, Mimori K, Yokobori T, et al. Epithelial-mesenchymal transition in cancer development and its clinical significance. Cancer Sci. 2010;101(2):293–299. doi: 10.1111/j.1349-7006.2009.01419.x [DOI] [PMC free article] [PubMed] [Google Scholar]
- 19.Weiswald LB, Bellet D, Dangles-Marie V. Spherical Cancer Models in Tumor Biology. Neoplasia. 2015;17(1):1–15. doi: 10.1016/j.neo.2014.12.004 [DOI] [PMC free article] [PubMed] [Google Scholar]
- 20.Dall G, Vieusseux J, Unsworth A, Anderson R, Britt K. Low Dose, Low Cost Estradiol Pellets Can Support MCF-7 Tumour Growth in Nude Mice without Bladder Symptoms. J Cancer. 2015;6(12):1331–1336. doi: 10.7150/jca.10890 [DOI] [PMC free article] [PubMed] [Google Scholar]
- 21.Matsuura K, Canfield K, Feng W, Kurokawa M. Metabolic Regulation of Apoptosis in Cancer. Int Rev Cell Mol Biol. 2016;327:43–87. doi: 10.1016/bs.ircmb.2016.06.006 [DOI] [PMC free article] [PubMed] [Google Scholar]
- 22.Ke N, Godzik A, Reed JC. Bcl-B, a Novel Bcl-2 Family Member That Differentially Binds and Regulates Bax and Bak *. Journal of Biological Chemistry. 2001;276(16):12481–12484. doi: 10.1074/jbc.C000871200 [DOI] [PubMed] [Google Scholar]
- 23.Malagobadan S, Ho CS, Nagoor NH. MicroRNA-6744–5p promotes anoikis in breast cancer and directly targets NAT1 enzyme. Cancer Biol Med. 2020;17(1):101–111. doi: 10.20892/j.issn.2095-3941.2019.0010 [DOI] [PMC free article] [PubMed] [Google Scholar]
- 24.Chambers AF, Matrisian LM. Changing views of the role of matrix metalloproteinases in metastasis. J Natl Cancer Inst. 1997;89(17):1260–1270. doi: 10.1093/jnci/89.17.1260 [DOI] [PubMed] [Google Scholar]
- 25.Deryugina EI, Quigley JP. Matrix metalloproteinases and tumor metastasis. Cancer Metastasis Rev. 2006;25(1):9–34. doi: 10.1007/s10555-006-7886-9 [DOI] [PubMed] [Google Scholar]
- 26.Li P, Butcher NJ, Minchin RF. Effect arylamine N-acetyltransferase 1 on morphology, adhesion, migration, and invasion of MDA-MB-231 cells: role of matrix metalloproteinases and integrin αV. Cell Adh Migr. 2020;14(1):1–11. doi: 10.1080/19336918.2019.1710015 [DOI] [PMC free article] [PubMed] [Google Scholar]
- 27.Carlisle SM, Trainor PJ, Hong KU, Doll MA, Hein DW. CRISPR/Cas9 knockout of human arylamine N-acetyltransferase 1 in MDA-MB-231 breast cancer cells suggests a role in cellular metabolism. Sci Rep. 2020;10(1):9804. doi: 10.1038/s41598-020-66863-4 [DOI] [PMC free article] [PubMed] [Google Scholar]
- 28.Carlisle SM, Trainor PJ, Doll MA, Hein DW. Human Arylamine N-Acetyltransferase 1 (NAT1) Knockout in MDA-MB-231 Breast Cancer Cell Lines Lead to Transcription of NAT2. Front Pharmacol. 2021;12:803254. doi: 10.3389/fphar.2021.803254 [DOI] [PMC free article] [PubMed] [Google Scholar]
- 29.Brown KK, Spinelli JB, Asara J, Toker A. Adaptive Reprogramming of De Novo Pyrimidine Synthesis is a Metabolic Vulnerability in Triple-Negative Breast Cancer. Cancer Discov. 2017;7(4):391–399. doi: 10.1158/2159-8290.CD-16-0611 [DOI] [PMC free article] [PubMed] [Google Scholar]
- 30.Traut TW. Physiological concentrations of purines and pyrimidines. Mol Cell Biochem. 1994;140(1):1–22. doi: 10.1007/BF00928361 [DOI] [PubMed] [Google Scholar]
- 31.Weber G Ordered biochemical program of gene expression in cancer cells. Biochemistry (Mosc). 2001;66(10):1164–1173. doi: 10.1023/a:1012493232344 [DOI] [PubMed] [Google Scholar]
- 32.Lafita-Navarro MC, Venkateswaran N, Kilgore JA, et al. Inhibition of the de novo pyrimidine biosynthesis pathway limits ribosomal RNA transcription causing nucleolar stress in glioblastoma cells. PLoS Genet. 2020;16(11):e1009117. doi: 10.1371/journal.pgen.1009117 [DOI] [PMC free article] [PubMed] [Google Scholar]
- 33.Wang L, Minchin RF, Essebier PJ, Butcher NJ. Loss of human arylamine N-acetyltransferase I regulates mitochondrial function by inhibition of the pyruvate dehydrogenase complex. Int J Biochem Cell Biol. 2019;110:84–90. doi: 10.1016/j.biocel.2019.03.002 [DOI] [PubMed] [Google Scholar]
- 34.Knowles JW, Xie W, Zhang Z, et al. Identification and validation of N-acetyltransferase 2 as an insulin sensitivity gene. J Clin Invest. 2015;125(4):1739–1751. doi: 10.1172/JCI74692 [DOI] [PMC free article] [PubMed] [Google Scholar]
- 35.Chennamsetty I, Coronado M, Contrepois K, et al. Nat1 Deficiency Is Associated with Mitochondrial Dysfunction and Exercise Intolerance in Mice. Cell Rep. 2016;17(2):527–540. doi: 10.1016/j.celrep.2016.09.005 [DOI] [PMC free article] [PubMed] [Google Scholar]
- 36.Savci-Heijink CD, Halfwerk H, Koster J, van de Vijver MJ. A novel gene expression signature for bone metastasis in breast carcinomas. Breast Cancer Res Treat. 2016;156(2):249–259. doi: 10.1007/s10549-016-3741-z [DOI] [PMC free article] [PubMed] [Google Scholar]
- 37.Savci-Heijink CD, Halfwerk H, Hooijer GKJ, et al. Epithelial-to-mesenchymal transition status of primary breast carcinomas and its correlation with metastatic behavior. Breast Cancer Res Treat. 2019;174(3):649–659. doi: 10.1007/s10549-018-05089-5 [DOI] [PMC free article] [PubMed] [Google Scholar]
- 38.Zhao C, Cai X, Wang Y, et al. NAT1 promotes osteolytic metastasis in luminal breast cancer by regulating the bone metastatic niche via NF-κB/IL-1B signaling pathway. Am J Cancer Res. 2020;10(8):2464–2479. [PMC free article] [PubMed] [Google Scholar]
- 39.Foulkes WD, Smith IE, Reis-Filho JS. Triple-negative breast cancer. N Engl J Med. 2010;363(20):1938–1948. doi: 10.1056/NEJMra1001389 [DOI] [PubMed] [Google Scholar]
Associated Data
This section collects any data citations, data availability statements, or supplementary materials included in this article.
Data Availability Statement
The data presented in this study are available on request from the corresponding author.