



Abstract
In this article, a new approach for human serum albumin selective fluorophore design has been reported. The fluorophore reported here comprises a substituted phenol donor and a cationic benzo[e]indolium acceptor connected with a π bond. Originally, the cationic fluorophore did not bind with human serum albumin. Upon deprotonation of the phenolic-OH by a water molecule the cationic form was transformed into an active zwitterionic form. Spectroscopic studies and theoretical calculations revealed that the new active form remained in a zwitterionic state in neutral aqueous solution, and it formed a strong supramolecular complex with human serum albumin. The spontaneous complexation resulted multi-fold increase of fluorescence intensity which increased linearly with the concentrations of the protein, thus giving an analytical tool to monitor human serum albumin in aqueous samples. We believe, this simple strategy applied on appropriate fluorogenic scaffolds would prove useful to develop new and improved turn-on fluorescent probes for pH regulated biological applications.
Keywords: Donor-acceptor fluorophore, Intramolecular charge transfer, Turn-on fluorescence, Human Serum Albumin
Graphical Abstract

Introduction
Quantitative determination of human serum albumin (HSA) is of significant importance for early diagnosis of renal damage and cardiovascular diseases [1]. In the past three decades, several analytical techniques such as capillary electrophoresis, affinity chromatography, immunoassays, spectrophotometry, fluorimetry, etc, have been developed [2,3]. Some of these techniques are routinely used in research laboratories. However, only dye binding assays and select few immunological methods have been adopted in the clinical laboratories for serum albumin determination in body fluids. The widespread applications of all the reported tools are limited due to technique specific strengths and weakness, such as poor selectivity and sensitivity in spectroscopic (UV-vis) detection methods, high cost and extensive sample preparation in immunoassays as well as in liquid chromatography–tandem mass spectrometric analysis, incomplete separation and low sensitivity of UV-based detection method in electrophoresis, nonspecific binding and Donnan effect in ultracentrifugation technique, etc [2]. Therefore, improvements can be made on all the existing methods, and this is an active area of research.
Recently, fluorescence based methods have attracted renewed attentions of chemists and biologists, partly due to major progress in the optical science technologies in excitation and detection domains. Low cost instruments with high sensitivity, rapid response time, and high-throughput capacity are now easily accessible. However, a critical barrier to general applications of fluorescence based techniques is availability of suitable fluorescent probes. Some key factors that must be considered while developing an external fluorescent probe are: (a) access to a highly absorbent, water-soluble, and photo-stable fluorophore, (b) well-resolved absorption and emission spectra of the fluorophore, preferably with large Stokes shift, (c) long wavelength absorption/emission for interference free optical signal, (e) specific binding of the fluorophore with the target biomolecule, (f) linear relationship between optical output and the amount of biomolecule, and (g) optimal performance of the fluorophore in physiological pH. Use of external fluorescent probes in fundamental research and applied sciences is well documented, and fluorogenic scaffolds such as cyanine, rhodamine, BODIPY, squaric acid, etc, are routinely utilized to develop new or improved fluorescent probes for chemical and biochemical assays [4-6].
To develop fluorescent-based assays for sensitive and selective detection of HSA in the long wavelength absorption/emission widow, donor-acceptor fluorophores are ideal choice. Typically, a turn-on fluorescence is achieved by restricting twisted intramolecular charge transfer (TICT) of the probe within the nonpolar site of HSA [2,5,7]. To date, dimethylamino or diethylamino and similar groups of cyclic nature have been used as strong donors. Polar electron deficient or cationic group(s) have been used strong acceptors. In our work, we have, however, adopted a different approach. We have used a substituted phenol and a cationic benzo[e]indolium acceptor to construct a donor-acceptor fluorophore. Based on our previous research findings, we have selected fluorine and methoxy substituents at the ortho positions of the phenolic -OH group to lower its pKa to acidic pH range and to maintain the absorption/emission window in the longer wavelength regions [8] A protonation-deprotonation equilibrium of the ionizable −OH group was established by simple adding and mixing, which rendered a turn-on fluorescent probe capable of selectively detect HSA in near neutral pH solutions [8]. The protonated short-wavelength absorbing/emitting form of the fluorophore was HSA insensitive, which only became an active fluorochrome after removal of the acidic proton by a water molecule. A distinctive change in the polarity and charge transfer property induced by the strong phenoxide donor made the latter a suitable probe for sensitive and selective determination of HSA in aqueous samples.
Herein, we have reported one water-soluble donor-acceptor fluorophore (1) for selective and quantitative determination of HSA in aqueous samples. A strong acceptor, 3-ethyl-1,1,2-trimethyl-1H-benzo[e]indol-3-ium iodide, was conjugated with a substituted phenol by an alkenyl bond to obtain an ionic push-π-pull fluorophore. In low pH solutions, the cationic fluorophore exhibited broad fluorescence spanning from blue to red region of the spectrum [9,10]. However, in neutral water the phenolic-OH (pKa = 5.5) was deprotonated due to strong negative inductive/mesomeric effects of the substituted groups in the phenol moiety. This acid-base reaction generated a zwitterionic fluorochrome (2) with sharp absorption and emission in the red region of the spectrum. Similar to the parent fluorophore, the newly generated fluorophore was weakly fluorescent in water, probably due to hydrogen bond formation and high dielectric nature of the microenvironment. The parent cationic fluorophore did not form any complex with HSA as evidenced by the UV-vis and fluorimetric studies. However, the new zwitterionic fluorochrome formed strong supramolecular complex with HSA, which resulted 95 nM limit of detection (LOD) in simulated urine solution. A linear relationship between the fluorescence intensity and the concentration of HSA was observed up to one equivalent of HSA. From the linear relationship, amount of HSA was determined in simulated urine samples with high percent recovery values. By employing steady-state fluorescence, theoretical calculations, site-specific binding displacement assays, and molecular docking the underlying mechanism of the turn-on fluorescence was realized, and it was attributed to the strong binding of the active fluorophore in the non-polar site (site IB) of HSA. High sensitivity and selectivity of the active fluorophore toward HSA suggest that 1 can be used as a probe for selective detection and quantification of HSA in aqueous samples.
Results and discussion
As a part of our continuous research effort in developing donor-acceptor dyes for identification and determination of chemical and biological analytes in samples, we have recently developed few phenol and substituted phenol based fluorophores for selective detection of albumin in samples [8,11,12]. We are specifically interested in exploring phenol and its derivatives as donor moieties for donor-acceptor fluorophores as acid-base equilibrium (both ground and excited state) can be utilized to tune the optoelectronic properties of the fluorophores. The conversion of phenol to a phenolate generates a strong donor center, which would be able to efficiently quench the fluorescence of an ICT state. Therefore, a turn-on type fluorescent probe can be easily obtained for aqueous samples. Moreover, color and pKa tuning can be achieved by carefully incorporating substituents in the conjugation chain.
Fluorophore 1 was synthesized in two steps starting from commercially available reagents (scheme 1). In the first step, cationic 3-ethyl-1,1,2-trimethyl-1H-benzo[e]indol-3-ium iodide was synthesized via an SN2 reaction. Knoevenagel condensation between 3-ethyl-1,1,2-trimethyl-1H-benzo[e]indol-3-ium iodide and 3-fluoro-4-hydroxy-5-methoxybenzaldehyde in presence of catalytic amount of ammonium acetate resulted 1 as a solid crystalline compound [8]. Experimental details of synthesis, purification, and characterization (FTIR, 1H, 13C, 19F, and mass spectrometry) are provided in the electronic supplementary information (ESI) section (figure S1-S3). The selectivity to all E isomer was confirmed from the coupling constant of vinylic hydrogens (J = 16 Hz) in the 1H spectrum.
Scheme 1.
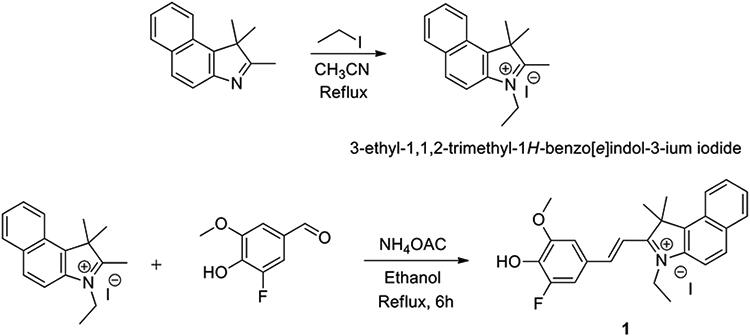
The synthetic route for the synthesis of compound 1.
Next, we examined the solvatochromic property of 1 in eleven aprotic and protic solvents (figure 1 and figure S4). In the absorption spectra bathochromic shift (~110 nm) of the λmax, abs was observed as the polarity of the solvents increased. In toluene, λmax, abs appeared at 480 nm, whereas in ethanol it appeared at 590 nm (table 1). This change of solvent polarity also lead to visible color change—ranged from yellow in less polar toluene and ethyl acetate to blue-purple in more polar and alcohol solvents (figure 1c).
Figure 1.

(a) Absorption spectra of 1 (10 μM) in different solvents. (b) Fluorescence spectra of 1 (10 μM) in different solvents. (c) Photograph of solutions of 1 in nonpolar and polar solvents.
Table 1.
Solvent dependent absorption and fluorescence parameters of 1.
| Solvent | λmax (Abs, nm) | Molar extinction coefficient (ε) (Lmol−1cm−1) |
λmax (FL, nm) | Stokes shift, (νA- νF, cm−1) |
Quantum yield (Φ) |
|---|---|---|---|---|---|
| Toluene | 480 | 12,090 | 562 | 3039.7 | — |
| Ethyl acetate | 560 | 33,130 | 612 | 1517.3 | 0.009 |
| Acetone | 570 | 40,860 | 604 | 987.6 | 0.017 |
| DCM | 582 | 38,570 | 611 | 815.5 | 0.050 |
| Acetonitrile | 580 | 49,870 | 611 | 874.8 | 0.022 |
| DMSO | 588 | 49,050 | 612 | 666.9 | 0.132 |
| Methanol | 585 | 55,210 | 615 | 833.9 | 0.005 |
| Ethanol | 590 | 61,300 | 620 | 820.1 | 0.040 |
| 1-Propanol | 480 | 12,810 | 615 | 689.0 | 0.015 |
| 2-Propanol | 587 | 34,520 | 615 | 775.6 | 0.011 |
| Water (pH 4.0) | 450 | 13,340 | 552 | 4106.3 | — |
| Water (pH 6.0) | 560 | 17,790 | 605 | 1328.2 | 0.015 |
| Water (pH 7.4) | 560 | 33,500 | 605 | 1328.2 | 0.012 |
| Water (pH 7.4):Glycerol (1:9) | 570 | — | 615 | 1283.7 | 0.149 |
Three additional observations were made in the visible spectra of 1 in different solvents. (1) The λmax, abs was more red shifted in DCM (ET30 = 40.7 kcal/mol) than in acetone (ET30 = 42.7 kcal/mol) and acetonitrile (ET30 = 45.6 kcal/mol). It is most likely due to halogen-sensitive solvatochromic properties of aromatic donor-acceptor compounds. (2) In isomeric alcohols such as 1- and 2-propanol, 1 appeared as blue-purple and yellow-orange, respectively (figure S4). Qualitatively the color in 2-propanol was comparable to that of in acetone. From the visible spectra it seems that the long wavelength absorption is contributing to the deep purple color of 1 in 1-propanol. (3) In all the polar solvents a higher energy shoulder band was visible, which also bathochromically shifted (~20 nm) as the polarity of the solvents increased.
We assign the λmax, abs bands to the intramolecular charge transfer. This is based on our experimental observations, theoretical calculations, and careful comparison of the properties of 1 with similar merocyanine fluorophores reported in the literature [13,14]. The high molar extinction coefficient values (×104 Lmol−1cm−1) and intense visible color in polar solvents indicate mixing of donor and acceptor orbitals in an extended electronic framework.
Figure 2a shows the plot of λmax, abs vs ET(30) of various solvents studied in this work. Clearly an inflection point appears between the aprotic and protic solvents, indicating different roles of hydrogen bond donating solvents to the electronic absorption than the dipolarity of the solvents [15]. A moderate linear correlation (r2 = 0.7965) was observed in polar aprotic solvents. An upward slope of absorption maxima in these solvents suggests positive solvatochromism. In all the alcohol solvents studied no significant change in absorption maxima was noticed. However, in water a significant increase in absorption energy was recorded, indicating more stabilization of the ground state than the excited state (νmax, abs/cm−1 in water ~22222 cm−1 vs ~17000 cm−1 in alcohols) [13]. We attribute this high energy absorption to the hydrogen bond interactions in water. Several potential hydrogen bond forming donor and acceptor groups (−OH, −OCH3, and N+) are present in 1, and both donor and acceptor orbitals could form hydrogen bonds with water, leading to a larger energy gap between the ground and excited state [15].
Figure 2.

(a) Plot of λmax, abs versus solvent polarity (using Reichardt’s ET(30) scale). (b) Plot of λmax, FL versus solvent polarity (using Reichardt’s ET(30) scale).
The fluorescence spectra of 1 were broad and featureless, a characteristic of charge transfer compounds. A shoulder band was observed at ~ 670 nm in all the polar solvents. In excitation spectra, resemblance of the band shape with absorption suggests that only one fluorescent species is present in the solution (figure S5). As expected the fluorescence of 1 was marginal in the polar solvents (figure S6 and table 1). However, quantum yield was slightly higher in polar aprotic solvents such as DCM, ACN, and DMSO than in polar protic solvents methanol, ethanol, 1-propanol, and −2-propanol, indicating deactivation of the excited states to a greater extent in the hydrogen bonding solvents. In general, no systematic change in λmax, FL was observed as the polarity of the solvents varied. As shown in figure 2b, λmax, FL remains almost constant when plotted against the ET(30) parameters of the solvents.
From the absorption and fluorescence characteristics in different solvents it is evident that the ground state of 1 is affected more by the dielectric parameter of the solvents than the excited state. Moreover, no systematic change in Stokes shift was observed as the polarizability (Δf) of the solvents increased. This indicates that specific solute-solvent interaction is playing an important role in the optical outcome of 1. Interestingly, λmax, FL of 1 in water was also largely blue shifted when compared with other protic solvents such as ethanol and methanol (νmax, FL/cm−1 in water ~18100 cm−1 vs ~16100 cm−1 in alcohols). Among all the solvents studied, the largest Stokes shift (4106 cm−1) was observed in water, further implying that a large degree of solute-solvent polarization is taking place upon photoexcitation [15].
Compound 1 comprises a methoxy and fluoro substituted phenol moiety connected with a benzo[e]indolium group through an alkenyl conjugation. As depicted in figure 3a, 1 predominately exits in phenolic form (λmax, abs = 450 nm) in acidic solutions. As the pH of the solution is increased 1 gets deprotonated and a new peak arises at longer wavelength (λmax, abs = 560 nm), with concomitant decrease of the shorter wavelength peak. The peak at 450 nm completely vanishes near neutral pH, forming a phenolate conjugate base. A clear isobestic point at 483 nm was observed, suggesting presence of only the acid (−OH) and its conjugated base (−0−) in equilibrium. From the plot of absorbance versus solution pH, pKa was calculated and it was found to be 5.50. This matches quite well with the pKa value (pKa = 5.55) obtained by applying modified Henderson-Hasselbalch equation reported by Dargo et. al.[16].
Figure 3.

(a) UV-vis absorption spectra of 1 in solutions of different pH values; green circle indicates the isobestic point. (b) Steady state fluorescence of 1 in solutions of different pH values.
Figure 3b exhibits steady state fluorescence spectra of 1 in acidic and basic solutions. When 1 was excited at 400 nm in highly acidic solutions (pH 4.0 and lower), a broad band ranging from ~500 nm to ~700 nm was observed (figure 3b and figure 4). Deconvolution (χ2 = 0.28; Adj. R2 = 0.997) of the band reveals that it consists two peaks — at ~552 nm and ~ 605 nm. On the other hand, excitation at 560 nm in higher pH solutions (pH 6 – 11) resulted a relatively narrow band centered at ~605 nm. A shoulder peak at ~670 nm was observed in all the spectra, irrespective of the pH values. We assign the higher energy emission (~555 nm) and the lower energy emission (~605 nm) to the phenol and phenolate form of 1, respectively.
Figure 4.

(a) Fluorescence spectra of 1 in acidic solutions. (b) Deconvolution of fluorescence spectrum of 1 in pH 4.0 solution. Black line: experimental spectrum; Red line: fitted spectrum; Green lines: fluorescence identified at three different wavelengths.
The broad fluorescence band in acidic solutions can be assigned to a mixture of two fluorescence spectra, originating from phenol and phenolate form of 1 [17,18]. We postulate an excited state proton transfer[18,19]. Appearance of phenolate emission even when no ground state phenolate is present supports this phenomenon. Deconvolution of emission band in pH 2.0 solution resulted an emission at ~602 nm, indicating competing excited state proton transfer phenomenon from 1 to the surrounding proton acceptors (figure S7a). Excitation spectra recorded in low pH solutions also shed some light onto this phenomenon. As expected, at pH 6.0 the maximum appeared at ~560 nm, and in pH 2.0 and 4.0 samples, the broad maximum (~465 nm) resembled to the absorption spectra recorded in identical pH values (figure S7b).
The concomitant observation of absorption and emission spectra of 1 and its conjugate base allowed us to determine the excited state acid dissociation constant (pKa*). The pKa* of 1 was estimated from the Förster equation pKa* = pKa + 0.002142 (~νD — ~νDH); ~νD is 0.5(~νabsmax - ~νemmax) of the deprotonated form at 0,0 transition and ~νDH is 0.5(~νabsmax - ~νemmax) of the protonated from at 0,0 transition, and it was found to be 2.4. Therefore, based on the steady state fluorescence and absorption studies and the pKa* value estimated from the thermodynamic Förster cycle, we conclude that 1 becomes stronger acid in the excited state [20].
To explore the relationship between optical properties and the contributing molecular orbitals, we next calculated the molecular orbitals for both phenol (1, a monocation) and phenolate (2, a zwitterion) forms by employing DFT theory with B3LYP functionals and Dunning’s correlation consistent basis sets at the double zeta level augmented with diffuse functions aug-cc-pVDZ (Figure 5). For the cationic 1, an in vacuo optimization was performed. As shown in figure 5a, the electron densities of the HOMO levels were distributed along the entire molecule, including in the naphthalene moiety, whereas the LUMO levels were mainly distributed at the nitrogen center and at the connecting –C=C- moiety of the benzo[e]indolium. Our TD-DFT calculation predicted the molecular orbitals that contributed to the several low-lying excited states (Figure S8). Higher transition oscillator strength and good spatial HOMO-LUMO overlap suggest an allowed S0 → S1 transition. Upon increasing polarity of solvents the bathochromic shift of λmax in both absorption and fluorescence spectra suggests that the electronic transition involved π → π* orbitals. Upon photoexcitation the redistribution of electron charge density between HOMO and LUMO most likely results an ICT state and the observed solvatochromicity. Moreover, the calculated excitation energies for all three transitions (λ = 520.83 nm, CI = 0.66387, f = 0.4577; λ = 445.57 nm, CI = 0.63494, f = 0.3490; λ = 409.34 nm, CI = 0.68586, f = 0.2435) correlated well with the experimental results (λmax = 560 nm, 535 nm, 385 nm) in low dielectric ethyl acetate solvent.
Figure 5.

(a) Calculated frontier orbitals for 1 in vacuo. (b) Acid-base equilibrium between 1 and 2. (c) Calculated frontier orbitals for 2 in implicit water. (d) Electrostatic potential map of 1 and 2 as generated from DFT calculations.
Positive solvatochromism is associated with an excited state of higher polarity than the ground state [21]. In other words, the dipole moment of a positive solvatochromic compound in the excited state is expected to be higher than the ground state. Our quantum chemical calculations at DFT and TD-DFT level of theory predicted the ground state (μGS) and excited state (μES) dipole moment as 2.3 and 12.8 D (Δμ = 10.5 D), respectively. This Δμ is an estimate in the gas phase, but, it agrees well with the experimental value (Δμexpt = 6.69 D). Therefore, based on the spectroscopic and theoretical studies, 1 can be considered as a positive solvatochromic fluorophore.
In neutral water 1 becomes deprotonated and remains predominately in the zwitterionic form (figure 5b). This extreme acid-base equilibrium is achieved because of the inductive/mesomeric effects of the ortho substituents on the phenyl ring, as well as electron pulling by the benzo[e]indolium group at the para position (figure 5e). Deprotonation generates phenolate (Ph—O(−)), which is a better electron donor group than Ph—OH (figure 5e). This phenomenon is evident in the shift of absorption maximum from 450 nm (Ph—OH) to 560 nm (Ph—O(−)) (figure 3a). Interestingly, the absorption energy (17857.14 cm−1) of the new phenolate fluorochrome (2) matches with the absorption energy of 1 in low dielectric solvent ethyl acetate, and it is higher than the values observed in all other polar solvents investigated in this study (table 1). This indicates that similar to the classic Brooker’s merocyanine dye the zwitterionic form (2) is predominant in water and the ground state is highly stabilized by polar protic water molecules, leading to a higher energy absorption [22-24].
Unlike 1, the HOMO of zwitterion 2 is more oriented toward the phenolate donor and the LUMO is distributed at the nitrogen center and in the adjacent ─C=C- bonds (figure 5c). The TD-DFT calculation indicates that the S0 → S1 transition with high configuration interaction value as the dominant orbital transition (figure S8). Moreover, a good spatial overlap between HOMO-LUMO orbitals can be postulated from qualitative inspection of the wave functions as well as from the high molar extinction coefficient of absorption in water (ε = 33,500 M−1cm−1). Upon photoexcitation, redistribution of the electron density between the HOMO and LUMO orbitals most likely corresponds to a π → π* transition of ICT feature. Excited state calculation reproduced this latter phenomenon quite well. The lowest energy excitation (λ = 561.31 nm, f = 1.6965, CI = 0.70236) correlated well with the experimental absorption (λmax, abs = 560 nm). Two other excitations were obtained from the calculation — at 398 nm (f = 0.001, CI = 0.52299) and 385 nm (f = 0.09, CI = 0.52099). Based on the oscillator strength for the former (f = 0.001), it is expected to be very weak absorption. The transition corresponding to 385 nm resembled to the weak experimental absorption at ~370 nm (experimental Aabs, 370 nm/Aabs, 560 nm =0.04).
Literature on phenolate betaine dyes is rich [13,14,22-25]. Since the first report of Brooker’s merocyanine dye (a stilbazolium dye), numerous other betaine dyes have been reported in the literature. The observed solvatochromic reversal behavior of the parent merocyanine dye has been a subject of longstanding debate. Nonetheless, a large number of experimental and theoretical studies suggest that the parent molecule remains as a hybrid of zwitterionic (benzenoid) and neutral (quinonoid) canonical forms, and the weights of these resonance forms can vary depending on the polarity of the solvent [23,25]. Moreover, some recent hybrid QM/MM and DFT based studies have shown that the zwitterionic form predominately exists in water whereas the quinonoid form is favored in nonpolar solvents such as chloroform. A bathochromic shift in the absorption spectra originates from light absorption by the predominant neutral quinonoid form in nonpolar solvents.
The maximum absorption of the zwitterion (2) bathochromically shifted as the polarity of the solvents decreased. Addition of 20% of acetone in 10μM solution of 1 in phosphate buffer (pH 7.4) resulted 17 nm red shift (Figure S9). Similar results were obtained with 20% DMSO. In MeOH, a 10 nm shift was recorded. A significant change in the shape of the λmax, abs was also noticed; with addition of less polar solvents the peak became narrow and more intense. As zwitterion 2 is predominately generated in phosphate buffer, the bathochromic shift upon addition of low dielectric solvents could suggest a more weight toward the quinonoid form in low dielectric environment [21,22].
Charge density of both 1 and 2 was calculated using Gaussian software package at the theoretical level of B3LYP and Dunning’s correlation consistent basis sets. As can be seen in figure 5d, the blue color and the red color represent electron deficient and electron rich region, respectively. In 1, the deepest blue color represents electron deficient central region where the positively charged nitrogen is present. In 2, the phenolate oxygen and the phenyl ring are of deepest red/yellow color, representing an electron rich aromatic ring. The blue color is not apparent on the nitrogen atom in 2. This is expected as electron deficient nitrogen center can participate in π-conjugation with the phenolate ring.
Fluorophore 1 was soluble in physiological buffer (pH 7.4) and stable under room light. Quantum yield of both 1 and 2 were low in water (Q.Y. ≈0.01) (table 1). However, a fifteen fold increase in quantum yield was recorded in 9:1 (glycerol: phosphate buffer; ηglycerol = 950 cP at 25 °C) mixture (figure S10a). Moreover, the absorption maximum shifted bathochromically (~22 nm bathochromic shift) in the same solvent mixture, and it resembled to the absorption spectra in alcoholic solvents (figure S10b). This change in spectral shape and position can be attributed to the lower dielectric environment in glycerol and an environment induced conformational change, typically observed in donor-acceptor fluorophores.
Spectroscopic properties of 1 and its conjugate base (2) are quite different, which primarily depend on dielectric environment and the specific solute-solvent interactions. These findings prompted us to further investigate protein sensing property of 1 (and 2) in aqueous samples. Both absorption and fluorescence studies showed that 2 binds with HSA in physiological pH. Preliminary evidence for binding was obtained from absorption spectra. Gradual addition of HSA with a fixed amount of 2 showed change in shape and λmax of the absorption spectra. As shown in figure 6, addition of up to 1.5 equivalents of HSA resulted ~10 nm bathochromic shift with concomitant broadening of the band (FWHM changes from 90 nm to 96 nm with 1.5 equivalents of HSA). No clear isobestic point was observed in the titration experiment.
Figure 6.

Plot of absorption of 2 (5 μM) in the presence of HSA in pH 7.4 buffer solution. (b) Denaturation of 2@HSA complex in the presence of guanidine hydrochloride in pH 7.4 buffer solution.
Next, we examined denaturation of 2@HSA complex with ionic solute guanidine hydrochloride (GnHCl). GnHCl is commonly used to determine specific denaturation pattern of HSA in water. In our study, first sign of denaturation was observed with as low as 0.5 M GnHCl. Around 30% decrease in optical density was observed with 1.5 M GnHCl. A further increase of concentration to 3.0 M resulted reappearance of an absorption spectrum which was identical to that of 2 in physiological buffer, indicating presence of predominately free 2 in the solution. Moreover, an overall blue shift was observed. Thus, the combined complexation and denaturation studies suggest that 2 forms a supramolecular complex with HSA in aqueous solution.
Fluorochrome 2 is weakly emissive in water (Q.Y. ≈0.01). However, with addition of HSA fluorescence quickly switched on, and the fluorescence intensity increased upon incremental addition of HSA in phosphate buffer solution (pH 7.4). As shown in figure 7, the fluorescence of 2 bathochromically and hyperchromically shifted with increasing amount of HSA. No excitation wavelength dependent red-edge effect was observed at room temperature, indicating absence of any binding site heterogeneity surrounding the fluorophore [26]. A linear correlation was established between the fluorescence intensity and the concentration of HSA. Up to one equivalent of added HSA, a good correlation (r2 >0.99) was observed. However, beyond this titration point gradual deviation from linearity was noticed. Two independent studies in simulated urine solution also illustrated this phenomenon; correlation coefficient dropped below 0.99 after one equivalent of added HSA. From the linear relationship between fluorescence intensity and the concentration of HSA binding affinity (Ka) was calculated, and it was estimated to be 2.30 × 10⁵ M−1 (ΔG = −7.36 kcal/mol) (Figure 7).
Figure 7.

(a) Fluorescence spectra of 2 (5 μM) upon addition of increasing concentration of HSA (0.033 μg/L to 1 mg/L) in physiological buffer (pH 7.4). (b) Determination of binding affinity from Benesi-Hildebrand equation.
Human serum albumin is a globular protein composed of 585 amino acids. It exists in monomeric form in physiological pH [27]. Due to formation of predominant helical structures (67%) with many turns and extended loops, it can bind a range of exogenous and endogenous compounds such as hormones, fatty acids, as well as drug molecules such as aspirin, warfarin, propofol, etc [27,28]. Based on experimental and computational studies, two major binding sites have been identified in HSA—site I (Sudlow I) and site II (Sudlow II). Site I is located in subdomain IIA and is known to accommodate primarily hydrophobic molecules such as phenylbutazone, indomethacin and warfarin among others. Binding of ligands in site II (located in subdomain IIIA) could be guided by a combination of hydrophobic and polar interactions. Ibuprofen, flufenamic acid, diazepam, thyroxine, octanoate, etc are known to bind in site II [27].
To identify the binding site for 2 in HSA, three ligand displacement assays were carried out with 1:1 (2: HSA) complex in phosphate buffer. As shown in figure 8a, both phenylbutazone (Sudlow I site binder; Ka = 7 × 10⁵ M−1) and ibuprofen (Sudlow II site binder; Ka = 2.7 × 10⁶ M−1) did not reduce the fluorescence intensity of 2@HSA complex, indicating that 2 does not bind in either site I or II. Given the dipolar nature and size of 2 (~15 Å length and ~6 Å width; volume 373.5 Å3), it is unlikely that 2 would spontaneously bind in the inner hydrophobic cavities of HSA. Site II is a hydrophobic cleft, ~ 16 Å deep and ~8 Å wide; site I is topologically similar to site II, and it comprises a pre-formed hydrophobic cavity[29].
Figure 8.

(a) The change in fluorescence intensity of 2@HSA (1:1) upon addition of phenylbutazone, ibuprofen, and salicylic acid. (b) Docking conformation of 2@HSA complex of the highest binding affinity. Hydrophobic interactions are shown as dotted grey lines and the cation-π interaction is shown as yellow dashed line.
On the other hand, the fluorescence intensity of 2@HSA increased upon addition of ten equivalents of the each drug — an average 10% increase with ibuprofen and 15% with phenylbutazone, respectively (figure 8a). These results are not surprising since binding of secondary ligand(s) with flexible HSA is known to induce conformation changes, leading to tighter binding and an increased fluorescence. While phenylbutazone and ibuprofen could not displace 2 from 2@HSA complex, salicylic acid (a site marker of subdomains IB and IIA) reduced the intensity of 2@HSA complex by ~21%, indicating competition for binding in subdomains IB or IIA[12]. Our phenylbutazone assay previously indicated that site IIA is not a favorable binding site for 2. Therefore, analyzing all three competitive ligand binding assays we can say that 2 forms a supramolecular complex with HSA within site IB.
To gain a visual perspective for 2@HSA supramolecular complex, molecular docking was performed by using AutoDock Vina tools[30]. A step by step procedure has been provided in the electronic supplementary information. Docking was performed by incorporating search areas that included the whole protein. The highest binding conformation (ΔG = −9.2 kcal/mol) of 2 is shown in figure 8B. It is clear from this analysis that 2 binds in the salicylic acid binding site IB, surrounded by four helix bundles. Residues LEU 115, TYR 138, ILE 142, ARG 145, TYR 161, and ARG 186 are involved in hydrophobic interactions mainly with naphthyl, methyl, ethyl, and alkenyl units of 2, thus supporting our design concept[31]. ARG 145 makes cation-π interaction with the benzene ring of 2, making the supramolecular association stronger. As previously seen in our charge density calculation, the phenolate ring is electron rich. Therefore, it determines the cation-π role in the site. Based on all the competitive ligand displacement assays and molecular docking analysis we conclude that 2 binds in the subdomain IB, and the increase of fluorescence intensity is the result of strong supramolecular association assisted by hydrophobic and cation-π interactions. Within the narrow cavity of protein the rotational restriction on 2 is most likely minimizing non-radiative energy loss from the excited state. Moreover, within the hydrophobic microenvironment of the binding site the absence of solute-solvent (H-bond type) interaction could also increase the fluorescence intensity of 2.
Excitation spectrum of 2@HSA (1:2) in buffer was quite different from the absorption spectrum (figure S9d), a fact indicating significant conformational or electronic change in the excited state. The λmax shifted to ~595 nm in presence of HSA (~35 nm bathochromic shift). The shape of the band was similar to that of the absorption of 2 in phosphate buffer-low dielectric solvent (acetone, DMSO, MeOH) mixtures (figure S9a-c). This latter phenomenon supports the conclusion that 2 localizes within a low-dielectric cavity of HSA.
High selectivity and sensitivity are the two most important characteristics for a molecular sensor. To test the efficacy of 1 as a potential fluorescent sensor for selective detection of HSA in samples, fluorescence change of 2 with common plasma proteins such as, transferrin, fibrinogen, γ-globulin, α1- GS-glycoprotein, α1- antitrypsin, γ1- antichymotrypsin, and thiol containing proteins and biomolecules such as hemoglobin, glutathione, and trypsin (figure 9a), as well as metabolic waste product creatinine, were tested. No significant change in the fluorescence intensity was noticed in the phosphate buffer solution, indicating 2 is selective to HSA among other common plasma proteins and metabolites.
Figure 9.

(a) Fluorescence intensity of 2 in presence of HSA and other biomolecules in physiological pH; average of two experiments is reported here. (b) Quantitative determination of HSA in deionized water (pH 6.23) (c) Qualitative determination of HSA with urine Chemstrip. The green color indicates albumin concentration greater than 0.90 μM.
To assess potential application of the fluorophore for urine samples, human serum albumin was determined in simulated urine samples by fitting the fluorescence intensity of 2@HSA into a standard graph (figure S11a). The simulated urine solution was prepared by following the reported method of Martinez et. al.[32]. The fluorescence intensities in the standard graph were corrected for the secondary inner filter effect using Fcorected = Fobserved × e (Aexi + Aem)/2 relationship, where Aexi and Aem represent absorbance at the excitation and emission wavelength, respectively[33]. The amount of HSA determined by this method was with high percent recovery (95% < percent recovery; table 2). The urine samples were also tested with a standard colorimetric method (Chemstrip 10 UA strips, purchased from a commercial vendor). This detection method functions based on the theory known as protein error of pH indicators [34]. A positive reaction is indicated by the color change from yellow to light green; albumin concentration greater than 0.90 μM displays a color change. Our samples were tested multiple times following the guidelines provided by the manufacturer (figure 9c). As expected, sample 1 showed negative results, whereas sample 2 showed green color within seconds. Thus the above results highlight that our fluorophore can be used as a reporter compound when detection of serum albumin is required in biological samples. The limit of detection (LOD= 3σ/k) of 1 was also calculated in simulated urine samples, and it was found to be 95 nM at pH 7.4, where σ is standard deviation of ten blank fluorescence intensities and k is the slope of the fluorescence vs [HSA] graph[35]. We also determined the amount of HSA in deionized water (pH 6.23) by fitting the fluorescence intensities to the standard graph. Three samples were tested and each time good recovery was found (figure 9b).
Table 2.
Determination of HSA in simulated urine samples.
| HSA added in simulated urine | Recovered | % recovery | |
|---|---|---|---|
| Sample 1 | 0.765E-06 M | 1.17 E-06 M | 95% |
| Sample 2 | 3.06E-06 M | 3.38E-06 M | 96% |
In this context it is important to note that the fluorescence of 1 is pH dependent. Analysis of the pH dependent equilibrium in ground state resulted pKa value of 5.5 (vide supra). Therefore, 1 mostly remains in the deprotonated conjugate base form (2, figure 5b) in neutral pH, and it acts as an active fluorochrome in our HSA determination study. Cautions must be taken for urine samples at low pH values, as pH of human urine can range from acidic to alkaline (pH 5.0 to 8.0), depending on the health conditions of the individuals, medications, diets and other factors [36]. To test the fluorescence response of 1 in low pH solutions, complexation studies with HSA were carried out in pH 5.0 and 6.0 samples.
As shown in figure 10a, both 1 and 2 were present in pH 5.0 solution. However, upon addition of HSA only peak corresponding to 2 showed bathochromic shift, indicating spontaneous complexation of HSA with 2 but not 1. Also, near constant absorption intensity of 1 in presence of excess HSA indicates that the protein does not deprotonate 1 by acid-base reaction. The fluorescence studies demonstrate this phenomenon more clearly (figure 10b). Excitation of 1 (λex = 450 nm) in presence and absence of HSA resulted identical fluorescence intensities, whereas, excitation of 2 (λex = 560 nm) showed ~10 fold enhancement of fluorescence. The latter phenomenon was identical to the observations made in phosphate buffer (pH 7.4) solutions. Therefore, from these studies it can be inferred that, in pH 5 solution, 1 does not bind with HSA by any specific mechanism. Similar observations were made in pH 6.0 buffer.
Figure 10.

(a) Absorption spectra of 1 and 2 in presence of increasing amount of HSA in pH 5.0 buffer solutions. (b) Fluorescence spectra of 1 and 2 in presence of increasing amount of HSA in pH 5.0 buffer.
This phenomenon can be ascribed to the electrostatic factors. Binding sites surrounded by the cationic side chains of amino acids might repeal positively charged 1. However, existence of any nonspecific binding of 1 with HSA is not excluded. Along this line a noteworthy example is binding of cationic photosensitizer methylene blue with HSA[28,37]. Methylene blue binds in Sudlow site II at the protein water interface in PBS buffer (pH 7.4). Although a binding constant value in the order ×105 M−1 has been reported by several research groups, no significant change in absorption and fluorescence spectra was recorded[37]. Similarly, the active pharmaceutical drug chloroquine with formal positive charge in its protonated form is not favored in any of the drug binding sites of HSA[16]. The positively charged residues exert repulsive forces at the entry points of the sites, whereas the deprotonated form is favored due to attractive coulombic interactions[16]. Similar observations were made for our previously reported probe (figure S12)[8]. Therefore based on our own findings and literature reports, we conclude that formation of active fluorochrome 2 is required for fluorimetric detection and quantification of HSA in samples.
Next, we wanted to establish a working pH range for quantitative determination of HSA in aqueous samples. Three simulated urine samples were prepared at three different pH values and each sample was spiked with 1.0 μM of HSA. The pH of the samples was adjusted to 6, 7, and 8 by adding dilute HCl and NaOH solutions. The F/F0 ratio in all the samples remained constant (figure S11b). This suggests that probe 1 can be directly used to determine HSA level in solution with near neutral (pH 6.0 to 8.0) pH values. For further lower pH samples dilute NaOH must be added to increase the pH of the solution to near neutral for more precise results. We believe that modulating the pKa (ground state and/or excited state) of this class of dyes would prove very useful not only for a broad range of pH related applications, but also for convenient generation of “turnon” fluorescent or colorimetric probes for specific biological applications for extremely acidic range (pH<4). Research in this area is underway in our laboratory.
Conclusions
In conclusion, a strategically substituted merocyanine dye was developed for selective and sensitive determination of HSA in aqueous and simulated urine samples. A reliable pKa shift strategy was applied to modulate the intramolecular charge transfer of the parent dye to give an active fluorescent probe. The spontaneous transformation of the parent fluorophore to an active fluorescent probe was achieved in physiological pH. The parent fluorophore showed positive solvatochromism and low fluorescence quantum yield due to charge transfer interaction between the donor and the acceptor moieties. Moreover, an excited state proton transfer event resulted broad and poorly resolved emission spectra in low pH solutions. However, deprotonation of the acidic proton by water molecule produced a predominant zwitterionic canonical form in water, which also displayed solvent polarity sensitive chromism. The active zwitterionic fluorochrome formed strong supramolecular complex with HSA with well resolved absorption and emission profiles. Collectively, all the experimental and theoretical studies indicate that noncovalent interactions between the active probe and the protein in a low dielectric binding site are playing primary roles in the spontaneous complexation and the subsequent multi-fold fluorescence enhancement.
The probe exhibited high sensitivity (LOD = 95 nm) and selectivity toward HSA over other common plasma proteins. Determination of HSA in simulated urine samples was possible in the low end of the microalbuminuria range. Moreover, no cross reactivity of the phenol-O(−) was observed in the studied samples and the probe exhibited identical optical property in the physiological pH range (pH 6 — 8]. Similarly, at higher alkaline pH range no reaction between hydroxide ion and the benzo[e]indolium group was observed, thus making it suitable for other potential biological applications[6]. Undoubtedly, the improved optical property (including CT property) and the altered dipolar nature of the active merocyanine form account for the observed sensitive and selective detection of HSA in aqueous solution. Hence, we envision that this strategy can be applied as an effective research tool to develop new fluorescent probes for various pH controlled chemical and biological processes.
Supplementary Material
A substituted phenol derived hemicyanine dye as fluorescent probe
pH dependent modulation of charge density and intramolecular charge transfer
Selective detection of human serum albumin in ‘turn-on’ fashion
In situ generation of a zwitterionic fluorochrome by simple adding and mixing of a dye in water
Acknowledgements
This work was supported by the IDeA Networks of Biomedical Research Excellence (INBRE) grant (grant number P20GM 103429 to R.C.). A.K.S. acknowledges the support of the National Science Foundation (CHE-1708635) and the Extreme Science and Engineering Discovery Environment (XSEDE) resource EXPANSE at San Diego Supercomputer Center through allocation TG-CHE180054 [38,39] R.C. thanks Dr. Anindya Ghosh at University of Arkansas, Little Rock, for collecting the NMR data.
Footnotes
Publisher's Disclaimer: This is a PDF file of an unedited manuscript that has been accepted for publication. As a service to our customers we are providing this early version of the manuscript. The manuscript will undergo copyediting, typesetting, and review of the resulting proof before it is published in its final form. Please note that during the production process errors may be discovered which could affect the content, and all legal disclaimers that apply to the journal pertain.
Declarations of interest
None
References
- [1].Koroshi A, Hippokratia 11 (2007) 105–107. [PMC free article] [PubMed] [Google Scholar]
- [2].Xu JF, Yang YS, Jiang AQ, Zhu HL, Crit. Rev. Anal. Chem 0 (2020) 1–21. [DOI] [PubMed] [Google Scholar]
- [3].Ronzetti M, Baljinnyam B, Yasgar A, Simeonov A, Expert Opin. Drug Discov 13 (2018) 1005–1014. [DOI] [PMC free article] [PubMed] [Google Scholar]
- [4].Han J, Burgess K, Chem. Rev 110 (2010) 2709–2728. [DOI] [PubMed] [Google Scholar]
- [5].Reja SI, Khan IA, Bhalla V, Kumar M, Chem. Commun 52 (2016) 1182–1185. [DOI] [PubMed] [Google Scholar]
- [6].Yang W, Liu C, Lu S, Cheng S, Du J, Gao Q, Shen P, Luo H, Liu Y, Yang C, J. Lumin 192 (2017) 478–485. [Google Scholar]
- [7].Choudhury R, Parker HE, Cendejas KM, Mendenhall KL, Tetrahedron Lett. 59 (2018) 3020–3025. [Google Scholar]
- [8].Choudhury R, Paudel P, Sharma AK, Webb S, Ware M, J. Photochem. Photobiol. A Chem 422 (2022) 113563. [DOI] [PMC free article] [PubMed] [Google Scholar]
- [9].Kumar N, Goel N, Biotechnol. Reports 24 (2019) e00370. [DOI] [PMC free article] [PubMed] [Google Scholar]
- [10].Liptak MD, Gross KC, Seybold PG, Feldgus S, Shields GC, J. Am. Chem. Soc 124 (2002) 6421–6427. [DOI] [PubMed] [Google Scholar]
- [11].Choudhury R, Quattlebaum B, Conkin C, Patel SR, Mendenhall K, Spectrochim. Acta - Part A Mol. Biomol. Spectrosc 235 (2020) 118305. [DOI] [PMC free article] [PubMed] [Google Scholar]
- [12].Choudhury R, Rajeshbhai Patel S, Ghosh A, J. Photochem. Photobiol. A Chem 376 (2019) 100–107. [DOI] [PMC free article] [PubMed] [Google Scholar]
- [13].Adjaye-Mensah E, Gonzalez WG, Miksovska J, Wilson JN, J. Phys. Chem. A 116 (2012) 12470–12475. [DOI] [PubMed] [Google Scholar]
- [14].Domínguez M, Rezende MC, J. Phys. Org. Chem 23 (2010) 156–170. [Google Scholar]
- [15].Chipem FAS, Mishra A, Krishnamoorthy G, Phys. Chem. Chem. Phys 14 (2012) 8775–8790. [DOI] [PubMed] [Google Scholar]
- [16].Dargó G, Bajusz D, Simon K, Müller J, Balogh GT, J. Med. Chem 63 (2020) 1763–1774. [DOI] [PMC free article] [PubMed] [Google Scholar]
- [17].Pines E, ChemInform 36 (2005) 1–66. [Google Scholar]
- [18].Agmon N, J. Phys. Chem. A 109 (2005) 13–35. [DOI] [PubMed] [Google Scholar]
- [19].Pinto Da Silva L, Green O, Gajst O, Simkovitch R, Shabat D, Esteves Da Silva JCG, Huppert D, ACS Omega 3 (2018) 2058–2073. [DOI] [PMC free article] [PubMed] [Google Scholar]
- [20].Clay A, Krishnan R, Sibi M, Webster D, Jockusch S, Sivaguru J, J. Photochem. Photobiol. A Chem 355 (2018) 38–41. [Google Scholar]
- [21].Reichardt C, Chem. Rev 94 (1994) 2319–2358. [Google Scholar]
- [22].Baraldi I, Brancolini G, Momicchioli F, Ponterini G, Vanossi D, Chem. Phys 288 (2003) 309–325. [Google Scholar]
- [23].Wada T, Nakano H, Sato H, Chem J. Theory Comput. 10 (2014) 4535–4547. [DOI] [PubMed] [Google Scholar]
- [24].Arul Murugan N, Kongsted J, Rinkevicius Z, Aidas K, Ågren H, J. Phys. Chem. B 114 (2010) 13349–13357. [DOI] [PubMed] [Google Scholar]
- [25].Murugan NA, Kongsted J, Rinkevicius Z, Ågren H, Phys. Chem. Chem. Phys 13 (2011) 1290–1292. [DOI] [PubMed] [Google Scholar]
- [26].Lakowicz JR, Keating-Nakamoto S, Biochemistry 23 (1984) 3013–3021. [DOI] [PMC free article] [PubMed] [Google Scholar]
- [27].Ghuman J, Zunszain PA, Petitpas I, Bhattacharya AA, Otagiri M, Curry S, J. Mol. Biol 353 (2005) 38–52. [DOI] [PubMed] [Google Scholar]
- [28].Alarcón E, Edwards AM, Aspee A, Moran FE, Borsarelli CD, Lissi EA, Gonzalez-Nilo D, Poblete H, Scaiano JC, Photochem. Photobiol. Sci 9 (2010) 93–102. [DOI] [PubMed] [Google Scholar]
- [29].Sugio S, Kashima A, Mochizuki S, Noda M, Kobayashi K, Protein Eng. 12 (1999) 439–446. [DOI] [PubMed] [Google Scholar]
- [30].Trott O, Olson AJ, J. Comput. Chem 31 (2010) 455–461. [DOI] [PMC free article] [PubMed] [Google Scholar]
- [31].Adasme MF, Linnemann KL, Bolz SN, Kaiser F, Salentin S, Haupt VJ, Schroeder M, Nucleic Acids Res. 49 (2021) W530–W534. [DOI] [PMC free article] [PubMed] [Google Scholar]
- [32].Martinez AW, Phillips ST, Whitesides GM, Proc. Natl. Acad. Sci. U. S. A 105 (2008) 19606–19611. [DOI] [PMC free article] [PubMed] [Google Scholar]
- [33].Yeggoni DP, Gokara M, Mark Manidhar D, Rachamallu A, Nakka S, Reddy CS, Subramanyam R, Mol. Pharm 11 (2014) 1117–1131. [DOI] [PubMed] [Google Scholar]
- [34].Alexander PEA, (1994). [Google Scholar]
- [35].Long GL, Winefordner JD, Anal. Chem 55 (1983) 712A–724A. [Google Scholar]
- [36].Hiraoka R, Kuwahara K, Wen YC, Yen TH, Hiruta Y, Cheng CM, Citterio D, ACS Sensors 5 (2020) 1110–1118. [DOI] [PubMed] [Google Scholar]
- [37].Vardevanyan PO, Antonyan AP, Parsadanyan MA, Shahinyan MA, Mikaelyan MS, Biophys. Rev. Lett 14 (2019) 17–25. [Google Scholar]
- [38].Towns, Cockerill T, Dahan M, Gaither K, Grimshaw A, Hazlewood V, Lathrop S, Lifka D, Peterson GD, Comput. Sci. Eng (2014) 62–74. [Google Scholar]
- [39].Strande S, Cai H, Tatineni M, Pfeiffer W, Irving C, Majumdar A, Mishin D, Sinkovits R, Norman M, Wolter N, Cooper T, Altintas I, Kandes M, Perez I, Shantharam M, Thomas M, Sivagnanam S, Hutton T, (2021) 1–4. [Google Scholar]
Associated Data
This section collects any data citations, data availability statements, or supplementary materials included in this article.