Abstract
The noradrenergic locus coeruleus (LC) is the first site of detectable Tau pathology in Alzheimer’s disease (AD), but the mechanisms underlying the selective vulnerability of the LC in AD have not been completely identified. Here we show that DOPEGAL, a MAO-A metabolite of noradrenaline (NE), reacts directly with the primary amine on the K353 residue of Tau to stimulate its aggregation and facilitate its propagation. Inhibition of MAO-A or mutation of the lysine 353 residue to arginine (K353R) decreases Tau K353-DOPEGAL levels and diminishes Tau pathology spreading. Wild-type Tau pre-formed fibrils (PFFs) trigger K353-DOPEGAL formation, Tau pathology propagation, and cognitive impairment in MAPT transgenic mice, all of which are attenuated with PFFs made from K353R mutant. Thus, the selective vulnerability of LC neurons in AD may be explained, in part, by NE oxidation via MAO-A into DOPEGAL, which covalently modifies Tau and accelerates its aggregation, toxicity, and propagation.
Keywords: Tau, Locus Coreuleus, MAO-A, DOPEGAL, oxidative stress, neurofibrillary tangles
Introduction
Alzheimer’s disease (AD) is a progressive neurodegenerative disorder. Clinically, it is characterized by gradual cognitive decline. One of the key pathological features in AD is intraneuronal neurofibrillary tangles (NFT), which are mainly composed of hyperphosphorylated and truncated Tau aggregates 1. Analysis of the post-mortem AD brains reveals a characteristic distribution pattern of NFT lesions over the course of the disease, initiating in the locus coeruleus (LC) to the transentorhinal cortex (EC) and progressively affecting the hippocampus (HC), temporal cortex and polymodal association areas 2. This sequential and hierarchical pathway is defined as six Braak stages. NFT, more so than Aβ pathology, displays a positive correlation between the affected areas and the clinical symptoms, suggesting that Tau lesions play a pivotal role in AD progression 3,4. LC is the major noradrenergic (NE)-producing nucleus in the brain. Degeneration of LC is one of the early hallmarks in AD 5–7. LC neurons play important role in regulating attention, arousal, mood, and some forms of learning and memory 8,9. Thus, LC dysfunction and degeneration are thought to underlie prodromal neuropsychiatric abnormalities in AD patients, such as anxiety, depression, and sleep disorders, as well as cognition impairment later in disease 10,11.
Hyperphosphorylated “pretangle” Tau is first detected in the LC, and spread to other brain regions that are connected with LC (e.g. the EC). Thus, the LC is considered one of the origins of Tau pathology in AD 12,13. Remarkably, it has been reported that ablation of the LC exacerbates cognitive deficits, while activation of the LC neurons restores reversal learning in AD mouse models 7,14. After binding to a non-specific substrate, tau may expose a high-affinity Tau-Tau binding domain, initiating its aggregation, and self-propagating thereafter 15. It has been proposed that pathologic tau in the LC induces hyperactivity of the LC neurons, thereby promoting its own spread to interconnected brain regions 16
3,4-Dihydroxyphenylacetaldehyde (DOPAL) is the aldehyde metabolite of dopamine, and 3,4-dihydroxyphenylglycolaldehyde (DOPEGAL) is the aldehyde metabolite of both norepinephrine and epinephrine. These catecholamine-derived aldehydes are neurotoxins, and their intraneuronal accumulation has been proposed as one of the mechanisms that trigger neurodegeneration in Parkinson’s disease (PD) and AD 17,18. The neurotoxic properties of the catecholamine-derived aldehydes DOPAL and DOPEGAL are thought to trigger the generation of free radicals and cell apoptosis 18,19. Catecholamines are stored in vesicle monoamine transporter 2 (VMAT2) vesicles, and can be leaked into the cytoplasm, where they are oxidized by monoamine A & B (MAOs) to generate aldehydes 20. The concentration of DOPEGAL in normal postmortem LC is about 1.4 μM. In AD patients, the concentration of DOPEGAL in LC neurons is elevated approximately by 3-fold 21,22. DOPEGAL is generated by MAO-A on the outer mitochondrial membrane in close proximity to mitochondrial permeable transition (PT) pores, and induces the Ca2+-mediated activation of the mitochondrial permeability transition 23,24. DOPEGAL is toxic in vitro and decreases cell viability 25. When DOPEGAL is injected into adrenergic neurons in the rostral ventrolateral medulla or the LC, neuronal apoptosis is triggered, suggesting the in vivo toxicity of DOPEGAL in noradrenergic neurons 26.
Asparagine endopeptidase (AEP, gene name: LGMN) is a cysteine protease that cleaves substrates after asparagine residues under acidosis. We have reported that AEP acts as δ-secretase that simultaneously cuts both APP and Tau at N585 and N368 residue, respectively, promoting Aβ production and NFT formation. Deletion of AEP alleviates AD pathologies and ameliorates cognitive deficits in various AD mouse models 27,28. Recently, we have shown that both DOPAL and DOPEGAL activate AEP, which subsequently cleaves α-synuclein and Tau, facilitating Lewy body pathology in PD or Tau aggregation in the LC of AD, respectively 29,30. Most recently, we report that ApoE4 binds to VMAT2 and excludes NE from the synaptic vesicles, leading to its oxidation by MAO-A into DOPEGAL. This highly reactive metabolite subsequently activates Tau N368 cleavage by AEP, triggering LC degeneration 31. However, we also discovered evidence that DOPEGAL can interact with Tau independently of AEP. For example, incubation of recombinant wild-type Tau with DOPEGAL induces Tau aggregation 29. Since aldehyde is highly reactive and forms protein adducts via Schiff base, we hypothesized that DOPEGAL may covalently modify the side chain of Tau in the LC and initiate Tau aggregation, accelerating its pathology and spread to interconnected brain regions. In the current work, we identify that the K353 residue of Tau is adducted by DOPEGAL, which enhances Tau fibrillization and neurotoxicity. Overexpression or inhibition of MAO-A increases and decreases Tau K353-DOPEGAL modification in the LC, respectively, mediating Tau pathology initiation and propagation in the brain.
Results
DOPEGAL modifies Tau and stimulates its fibrillization
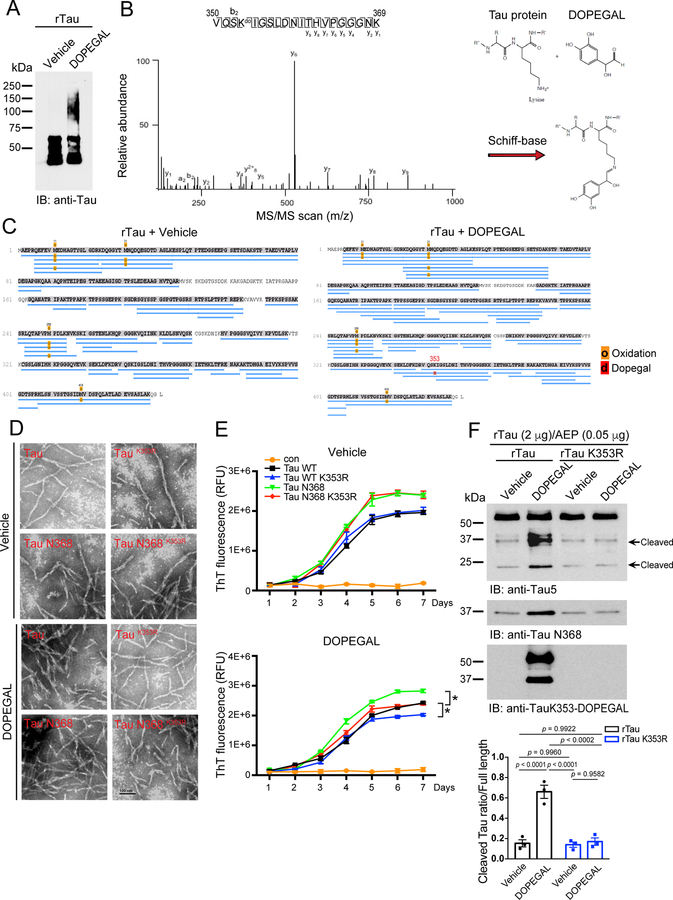
DOPEGAL, but not NE, facilitates the fibrillization of purified recombinant Tau proteins 30. Aldehydes react with proteins to form various adducts that can disrupt protein function and cause cellular damage. To map the potential covalently modified residues on Tau by DOPEGAL, we incubated purified recombinant human Tau proteins with DOPEGAL (500 μM), and conducted proteomics analysis. We found that K353 is the only residue modified by DOPEGAL, whereas numerous Met residues were oxidized under both vehicle and DOPEGAL conditions (Figure 1A–C and Extended Data figure 1C). Fitting with previous observations, AEP-truncated Tau N368 was more aggregation-prone than Tau full-length (FL), and electron microscopy (EM) revealed that they exhibited more condensed fibrils. Mutating the DOPEGAL-sensitive lysine to an arginine (K353R) mutation had no effect on either Tau FL or Tau N368 fibrillization in the vehicle control, but attenuated the ability of DOPEGAL to enhance Tau aggregation. Accordingly, EM showed that the density and compactness of Tau FL and Tau N368 fibrils were reduced in the respective K353R mutants (Figure 1D & E).
Figure 1. DOPEGAL modifies Tau lysine K353 residue and mediates Tau aggregation.
A. Recombinant Tau (rTau) was incubated with vehicle or DOPEGAL (500 μM) for 24 h. The aggregation of tau was detected by Western blot using Tau5 antibody. Data is representative of three independent experiments with similar results. B & C. LC-MS/MS spectrum demonstrating DOPEGAL-modified Tau residue at K353 in the sample of recombinant Tau treated with DOPEGAL. D. TEM (Transmission electron microscopy) images of Tau, Tau K353R, Tau N368, and Tau N368 K353R treated with vehicle or DOPEGAL representing the morphology of filaments. Scale bar is 100 nm. E. Recombinant Tau, Tau K353R, Tau N368, and Tau N368 K353R recombinant proteins were induced to aggregate in the presence (lower panel) or absence (upper panel) of DOPEGAL. Thio-T assay was used to evaluate the kinetics of aggregation of Tau over 7 days. Tau and Tau N368 aggregated more rapidly by DOPEGAL than Tau K353R and Tau N368 K353R. F. Recombinant Tau was incubated with DOPEGAL (500 μM) for 1 h and cleaved by recombinant AEP (0.05 μg) at 37 °C and pH 6.0 for 30 minutes. Western blot and densitometric quantification of cleaved Tau band showed that rTau modification by DOPEGAL enhanced its cleavage by rAEP. All data in E & F were analyzed using one-way ANOVA and shown as mean ± SEM. n = 3 per group. *P < 0.05.
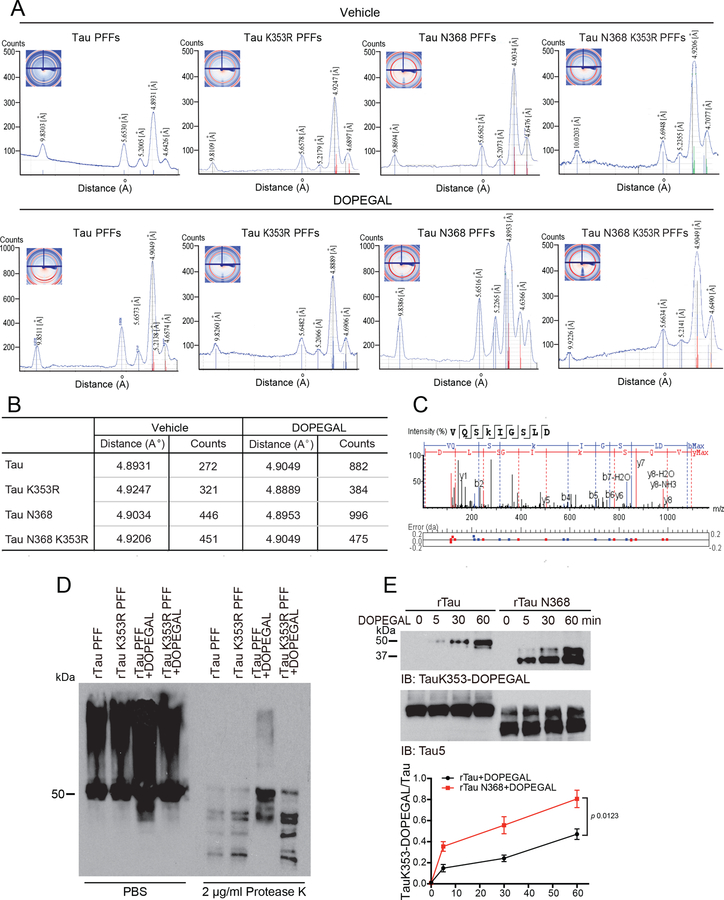
X-ray fiber diffraction measures the molecular structure from scattering data. The sub-structural analysis of the fibrils revealed that they all shared similar core structures. Stalks from each sample gave rise to anisotropic X-ray diffraction patterns displaying the typical features of a cross-β substructure, with axial inter-strand reflections at ~4.9 Å for all of the samples. DOPEGAL-treated fibrils exhibited more intense and characteristic anisotropic reflection than the vehicle, and the counts were highly increased for Tau FL and even more so for Tau N368. Markedly, K353R mutants were refractory to DOPEGAL-elicited fibrillization (Extended Data figure 1A&B), supporting the notion that K353-DOPEGAL modification plays a critical role in altering Tau conformations. To further assess the structural differences among these different species of PFFs, we performed a limited proteolysis of equal amount of fibrils with proteinase K. DOPEGAL-modified Tau fibrils were more resistant to proteinase K digestion as compared to vehicle-treated PFFs. By contrast, K353R mutated PFFs were prone to degradation regardless of vehicle or DOPEGAL treatment (Extended Data figure 1D). Together, these data indicate that DOPEGAL modification of K353 stimulates Tau to form more compact fibrils that are resistant to Protein K degradation. In accordance with these findings, time course assays showed that Tau N368 was more rapidly modified by DOPEGAL than Tau FL, resulting in significantly enhanced adduct formation (Extended Data figure 1E). In vitro cleavage assays indicated that DOPEGAL-modified Tau recombinant proteins were more vulnerable to AEP proteolytic cleavage than control Tau, whereas K353R mutated proteins exhibited comparable truncation regardless of vehicle or DOPEGAL treatment (Figure 1F), underscoring that this covalent conjugation prompts Tau fragmentation by active AEP.
DOPEGAL enhances Tau pathology in cells
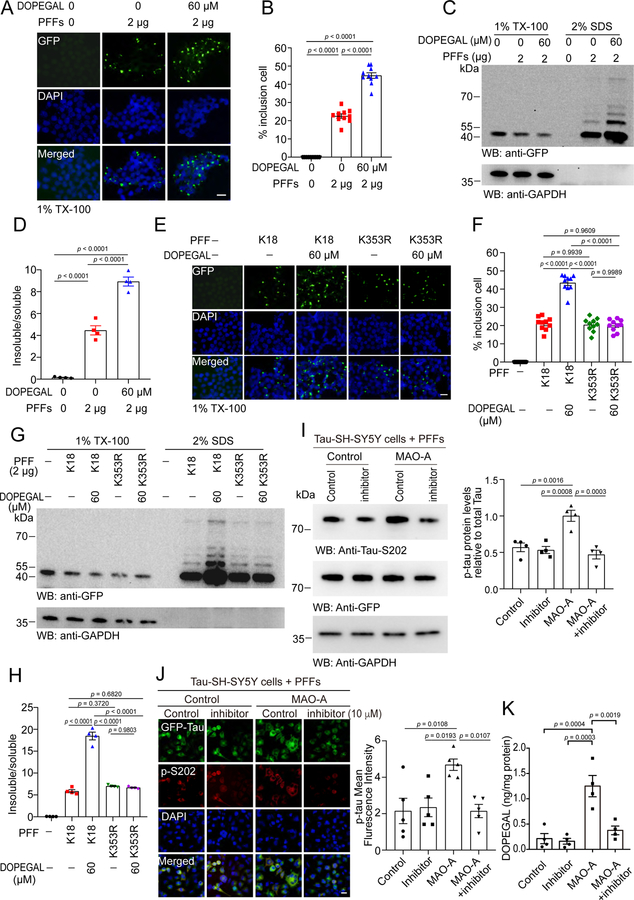
To further explore the effect of DOPEGAL on Tau fibrillization, we employed HEK293 cells stably transfected with GFP-Tau RD (repeated domain, a.a. 244–372). The cells were treated with vehicle or DOPEGAL, and then incubated with Tau PFFs to trigger Tau aggregation. Tau PFFs elicited GFP-Tau RD inclusions, which were highly accelerated by DOPEGAL (Figure 2A&B). Fractionation revealed that soluble GFP-Tau RD in Tx-100-soluble fraction was reduced in the presence of DOPEGAL, while aggregated GFP-Tau RD inclusions were consequently augmented in the SDS fractions (Figure 2C&D). Ubiquitin/GFP co-staining indicated that Tau RD was accumulated into AD pathology-like Tau fibrillary aggregates (Extended Data figure 2A). To investigate the role of Tau K353 modification on its aggregation, we treated HEK293 cells transiently expressing Tau RD or K353R with vehicle or DOPEGAL, and then incubated with Tau PFFs. DOPEGAL promoted the aggregation of wild-type Tau RD, but not K353R mutant Tau RD (Extended Data figure 2B&C). These findings were further confirmed by IB analysis of the Tx-100-soluble and SDS-soluble Tau species (Extended Data figure 2D&E). To investigate the seeding activity of DOPEGAL-modified Tau PFFs, we generated PFFs from Tau RD and K353R mutant in the presence or absence of DOPEGAL, and transduced HEK293 cells stably transfected with Tau RD with the Tau PFFs. While the PFFs generated from K353R mutant Tau displayed comparable aggregation capability to Tau-RD PFFs, they were resistant to DOPEGAL’s accelerating effect in seeding Tau aggregation (Figure 2E&F), indicating that K353R mutation alone does not affect Tau transformation into pathological aggregates. Fractionation and quantification of insoluble/soluble ratios supported that DOPEGAL-modified Tau PFFs show enhanced seeding activity, which was abolished by K353R mutation (Figure 2G&H). Moreover, we confirmed that DOPEGAL induced Tau phosphorylation and aggregation in the absence of Tau PFFs in Tau transiently expressed HEK 293 cells (Extended Data figure 2F). Because NE is metabolized into DOPEGAL by MAO-A, we assessed the consequences of increasing or decreasing MAO-A activity. MAO-A overexpression in GFP-Tau RD stably transfected SH-SY5Y catecholaminergic cell line increased DOPEGAL and stimulated Tau phosphorylation, which was blocked by the MAO-A inhibitor clorgyline (Figure 2I–K). Hence, DOPEGAL enhances Tau aggregation and phosphorylation in cells.
Figure 2. DOPEGAL modification of Tau promotes its aggregation and seeding.
A-D. The HEK293 cells stably transfected with GFP-Tau RD were exposed to DOPEGAL, and then transduced with tau PFFs. A. Representative images showing the insoluble Tau inclusions. Scale bar is 20 μm. B. Quantification of the percentage of cells with Tau inclusions. Data are shown as mean ± SEM. n = 10 per group. One-way ANOVA. C. The cells were sequentially extracted with 1% Triton X-100 lysis buffer followed by 2% SDS. Cell lysates from Triton X-100-soluble and SDS-soluble fractions were immunoblotted with GFP antibody. D. Quantification of the relative levels of Tau in the Triton X-100-soluble and SDS-soluble fractions. Data are shown as mean ± SEM. n = 4 per group. One-way ANOVA. E-H. Wild-type or K353R mutant K18 were induced to aggregate into PFFs in the presence or absence of DOPEGAL. E. The seeding activity of different PFFs was tested in HEK293 cells stably transfected with GFP-Tau RD. Scale bar is 20 μm. F. Quantification of the percentage of the cells with insoluble Tau inclusions. Data are shown as mean ± SEM. n = 10 per group. One-way ANOVA. G. The cells were sequentially extracted with 1% Triton X-100 lysis buffer followed by 2% SDS. Cell lysates from Triton X-100-soluble and SDS-soluble fractions were immunoblotted with GFP antibody. H. Quantification of the relative concentrations of Tau in the Triton X-100 soluble and SDS-soluble fractions (n = 4 per group). I. SH-SY5Y cells stably transfected with tau (Tau-SH-SY5Y cells) were transiently transfected with MAO-A or vector, and then treated with clorgyline. The cells were then transduced with tau PFFs. Western blots showing the phosphorylation of tau at S202 was increased in the presence of MAO-A, and attenuated by MAO-A inhibitor (n = 4 per group). J. The phosphorylation of tau at S202 was analyzed by immunofluorescence (red). Scale bar is 20 μm. (n = 5 per group.). K. DOPEGAL in the cells was measured by HPLC analysis (n = 4 per group). All data in H-K were analyzed using one-way ANOVA and shown as mean ± SEM.
DOPEGAL triggers Tau aggregation in primary neurons
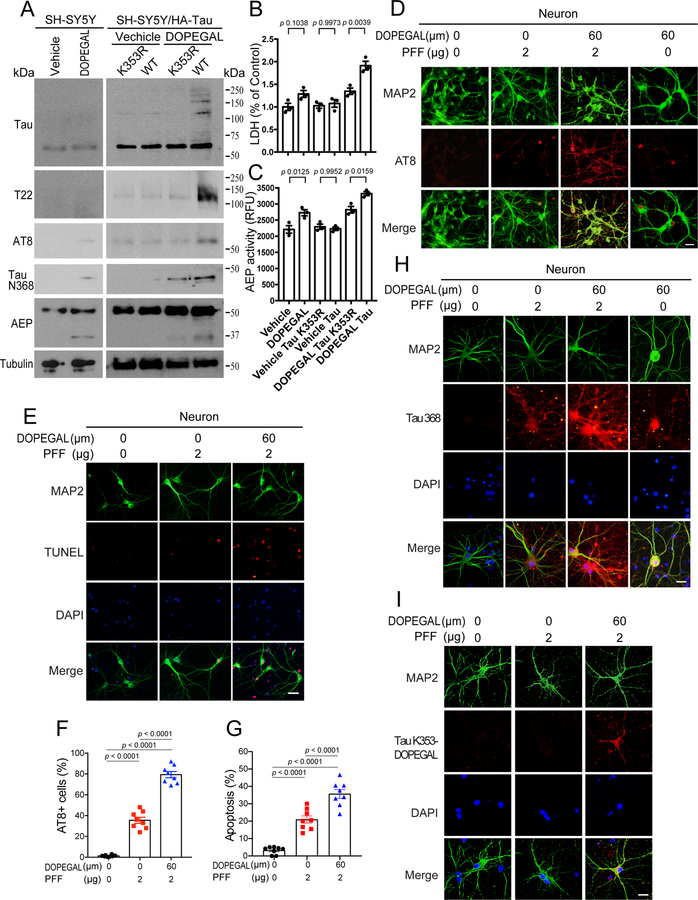
To investigate the biological consequences of Tau K353 modification by DOPEGAL, we transfected HA-Tau WT or K353R mutant into SH-SY5Y cells, and treated the cells with DOPEGAL. IB analysis showed that DOPEGAL elicited pronounced K353-DOPEGAL immunoreactivity, Tau aggregation and hyperphosphorylation, accompanied by AEP activation and Tau N368 fragmentation, which were reduced in K353R mutant transfected cells (Figure 3A). Remarkably, DOPEGAL increased AEP activation and subsequent endogenous Tau cleavage. However, oligomerization of endogenous Tau or its phosphorylation was modest, presumably, because the expression of endogenous Tau in SH-SY5Y cells is very low. Conceivably, a portion of Tau N368 cleavage in K353R transfected cells may result from endogenous Tau. LDH assay showed that DOPEGAL triggered significant cell death in Tau WT compared to K353R transfected cells, correlating with AEP enzymatic activities (Figure 3B&C). These results suggest that DOPEGAL induces AEP activation and Tau N368 fragmentation and aggregation, associated with Tau hyperphosphorylation and cytotoxicity. In primary cortical neurons, we recapitulated what we observed in Tau-transfected SH-SY5Y cells with endogenous Tau. Specifically, DOPEGAL enhanced Tau PFF-induced AEP activation, Tau N368 truncation, aggregation (T22), phosphorylation (AT8) signals and K353-DOPEGAL immune-activities in neurons, correlating with augmented neuronal apoptosis. Notably, DOPEGAL triggered endogenous Tau N368 fragmentation and phosphorylation in primary neurons in the absence of Tau PFFs (Figure 3D–I).
Figure 3. Tau modification by DOPEGAL induces AEP activation, Tau pathology, and cell death in neurons.
A. SH-SY5Y cells were transfected with Tau or Tau K353R, followed by the treatment with vehicle or DOPEGAL (60 μM). Western blot analysis showing that DOPEGAL induced Tau oligomerization, phosphorylation, AEP activation, and Tau cleavage, which were blocked by Tau K353R mutation. B. LDH assay demonstrated that Tau but not Tau K353R overexpression mediated cell death, which was enhanced by DOPEGAL treatment. C. The activation of AEP was confirmed by enzymatic assay. All data in B&C were analyzed by one-way ANOVA and shown as mean ± SEM. n = 3 per group. D & F. Primary neurons were treated with DOPEGAL in the presence or absence of tau PFFs. Immunofluorescence shows insoluble tau phosphorylation (D) and quantification (F). E & G. Neuronal apoptosis induced by DOPEGAL and tau PFFs was assessed using TUNEL staining. Scale bar is 20 μm. All data in F & G are shown as mean ± SEM. n = 8 per group. One-way ANOVA. H. Immunofluorescence shows tau cleavage and Tau modification by DOPEGAL. Scale bar is 20 μm. I. Immunofluorescence shows Tau modification by DOPEGAL. Scale bar is 20 μm. The images of H & I are representatives of three independent experiments with similar results.
K353-DOPEGAL is increased in Tau P301S mice and AD brains
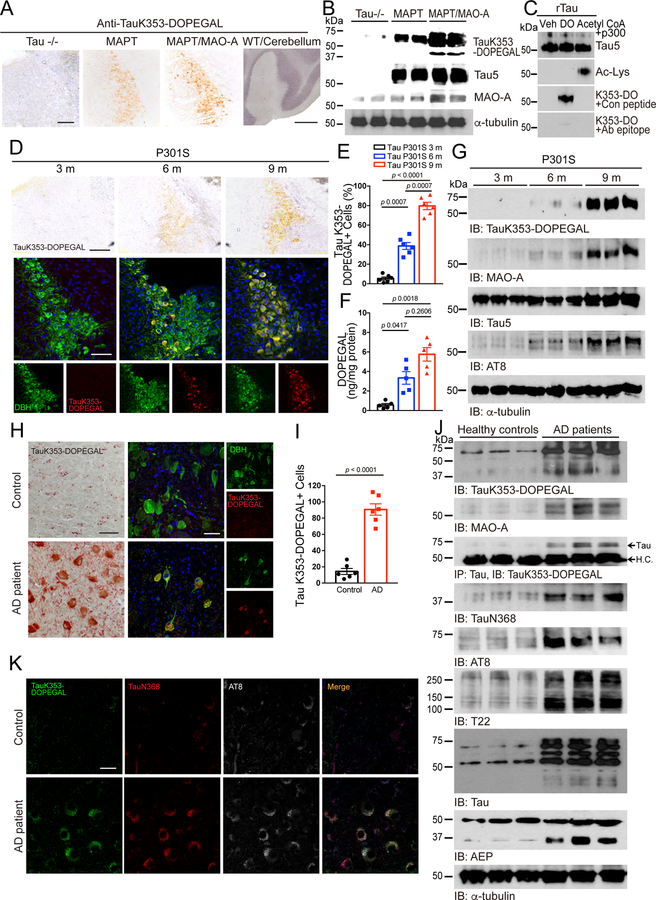
To test whether Tau K353-DOPEGAL conjugation could take place in vivo, we developed K353-DOPEGAL rabbit polyclonal antibody and injected AAV-MAO-A into the LC of MAPT mice. Immunohistochemistry (IHC) showed that MAO-A overexpression increased Tau K353-DOPEGAL immunoreactivity as compared with the control virus. By contrast, there were negligible non-specific signals in LC of Tau−/− mice and the cerebellum of young wild-type mice, which expressed the lowest level of MAO-A in the brain. These observations were recapitulated by Western blot analysis (Figure 4A&B). Next, recombinant Tau was modified by DOPEGAL or acetylation by Acetyl-CoA/p300 32 to validate the specificity of K353-DOPEGAL antibody in vitro. K353-DOPEGAL antibody specifically detected the Tau modified by DOPEGAL, but it did not recognize the acetylated Tau. Further, Tau K353-DOPEGAL signals were abolished by pre-incubation with the epitope peptide of Tau K353-DOPEGAL but not the control peptide (Figure 4C). These results indicate that the K353-DOPEGAL antibody specifically recognizes DOPEGAL-conjugated Tau. Moreover, DOPEGAL concentration and K353-DOPEGAL immunoreactivity were escalated in the LC of Tau P301S mice in an age-dependent manner, tightly correlated with dopamine β-hydroxylase DBH-positive LC neuronal degeneration (Figure 4D–F). IB revealed that MAO-A was temporally increased from 3 to 9 months in Tau P301S mice, coupled with robust K353-DOPEGAL and AT8 abundance (Figure 4G). DOPEGAL is produced exclusively in noradrenergic neurons by MAO-A metabolism of NE, which is synthesized from dopamine by DBH. Accordingly, knockout of DBH in Tau P301S mice eradicated K353-DOPEGAL and AT8 immunoreactivity in the LC (Extended Data figure 3), indicating that depletion of NE deprives MAO-A of its substrate for DOPEGAL synthesis and abolishes K353-DOPEGAL and hyperphosphorylated Tau in the LC of Tau P301S mice.
Figure 4. DOPEGAL is upregulated and modifies Tau at K353 in the progression of AD.
AD mice models including tau P301S and MAPT mice, and postmortem human control and AD patient brains were examined for DOPEGAL-modified Tau at K353 in the LC by the antibody for DOPEGAL-bound Tau at K353. A & B. Representative images of immunohistochemistry staining (A) and Western blotting (B) for Tau K353-DOPEGAL on the LC sections of 9-month-old Tau−/−, MAPT, MAO-A overexpressed MAPT mice and the cerebellum of wild type mouse. Scale bar is 100 μm and 500 μm. C. Recombinant Tau was incubated with vehicle (Veh), DOPEGAL (DO) (500 μM), or Acetyl CoA+p300. Acetylated Tau was confirmed by anti-Ac-Lys and DOPEGAL-modified Tau was confirmed by anti-TauK353-DOPEGAL. D-G. Representative images of immunohistochemistry staining (D), quantification for Tau K353-DOPEGAL+ cells (E), HPLC analysis of DOPEGAL (F), and Western blotting (G) in the LC region of 3, 6, and 9-month-old tau P301S mice. Scale bar is 100 μm. Data are shown as mean ± SEM. n = 6 mice (E), n = 5 mice (F) per group. One-way ANOVA. H & I. Representative images of immunohistochemistry staining (H) and quantification (I) for Tau K353-DOPEGAL+ cells in healthy control and AD patient’s LC brain sections. Scale bar is 20 μm. Data are shown as mean ± SEM. n = 6 per group. Student t-test with Welch’s correction. J. Western blot showing the modification of tau by DOPEGAL, activation of MAO-A and AEP, the cleavage, phosphorylation, and aggregation of tau in the LC region of AD patient. K. Representative images of triple staining for TauK353-DOPEGAL (green), Tau N368 (red), and AT8 (white) in healthy control and AD patient’s LC brain sections. Scale bar is 20 μm. All data and images of J & K are representatives of three independent experiments with similar results.
IHC showed that K353-DOPEGAL was greatly enhanced in the LC of postmortem AD brains as compared to age-matched control (Figure 4H & I). IB analysis corroborated this finding, accompanied by elevated MAO-A and AEP activation and subsequent Tau N368 fragmentation in AD brains versus controls. Consequently, AT8 and T22 levels were substantially escalated in AD brains (Figure 4J), underscoring that Tau K353 is prominently modified by DOPEGAL, and assumes highly aggregated and hyperphosphorylated forms in AD brains. Immunofluorescent (IF) co-staining confirmed that K353-DOPEGAL-conjugated Tau is truncated at N368 by active AEP, associated with Tau hyperphosphorylation in AD brains but not healthy controls (Figure 4K). To further define the role of DOPEGAL in these events, we injected DOPEGAL into the LC of MAPT mice, and replicated our previous finding that noradrenergic LC neurons were prominently reduced as compared to vehicle control 30. Moreover, the surviving DBH+ neurons contained abundant K353-DOPEGAL and Tau N368 immunoreactivity (Extended Data figure 4A, left panels). Deletion of AEP attenuated the effects of DOPEGAL administration. K353-DOPEGAL and Tau N368 fluorescent intensities were markedly reduced (Extended Data figure 4A–C), suggesting that AEP cleavage of Tau N368 plays a pivotal role in DOPEGAL covalent modification of Tau. In alignment with our previous observations 30, MAO-A overexpression also induced Tau N368 cleavage and LC neuronal loss, accompanied by K353-DOPEGAL and T22 augmentation (Extended Data figure 4D&E). Together, these data indicate that MAO-A metabolism of NE drives Tau K353 modification by DOPEGAL in LC neurons of AD brains, triggering Tau cleavage by AEP, hyperphosphorylation, and aggregation.
Inhibition of MAO-A reduces tau pathology in Tau P301S mice
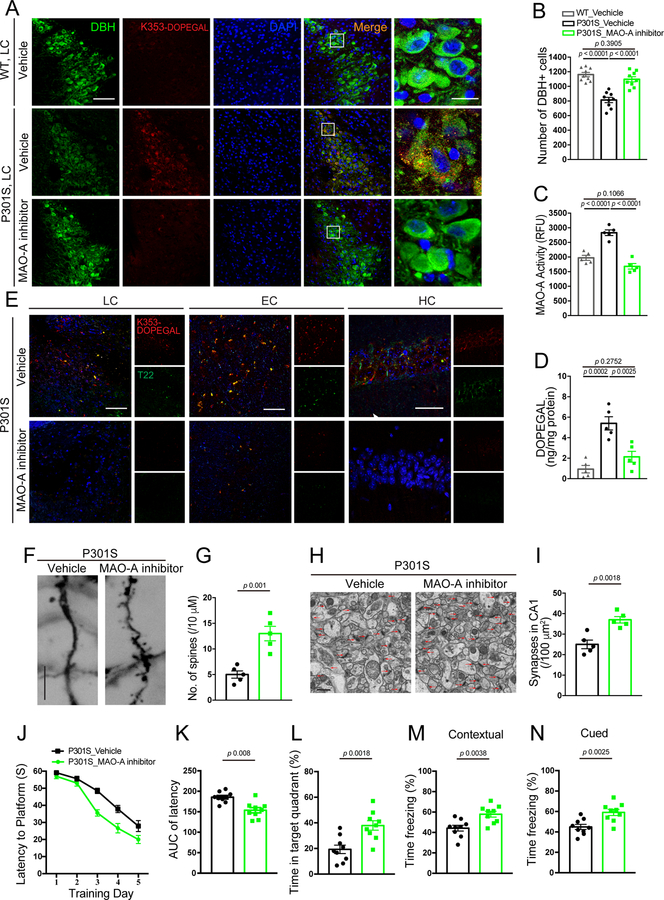
Accumulation of DOPEGAL, along with enzymes involved in its synthesis, including DBH and MAO-A, is evident in noradrenergic LC neurons in AD brains 21. To interrogate the pathological role of DOPEGAL in Tau pathology, we treated 6-month-old Tau P301S mice with the MAO-A inhibitor clorgyline for 3 consecutive months. We found that blockade of MAO-A potently reduced K353-DOPEGAL immunoreactivity and increased LC neuron number (Figure 5A–C). In accordance with these findings, clorgyline attenuated Tau N368 cleavage, phosphorylation, and K353-DOPEGAL abundance in the LC neurons (Extended Data figure 5A–C). Noticeably, inhibition of MAO-A strongly decreased DOPEGAL concentration and crippled the ability of T22-positive Tau aggregates to spread from the LC to the EC (entorhinal cortex) and HC (hippocampus) in the Tau P301S brains (Figure 5D&E). Golgi staining demonstrated that clorgyline significantly enhanced the density of dendritic spines in the HC of Tau P301S mice (Figure 5F&G). Electronic microscopy (EM) revealed that synapses were increased as well (Figure 5H&I). Consistent with the augmentation of synaptic microstructure, clorgyline considerably restored learning and memory functions of Tau P301S mice in both the Morris water maze (MWM) and fear conditioning cognitive behavioral tests (Figure 5J–N). Hence, these results demonstrate that inhibiting MAO-A-mediated DOPEGAL production diminishes Tau propagation from the LC to the forebrain, resulting in alleviation of synaptic loss and cognitive dysfunctions in Tau P301S mice.
Figure 5. Inhibition of MAO-A reduces DOPEGAL-Tau modification and Tau pathology in Tau P301S mice.
MAO-A inhibitor, clorgyline, was administered in 3-month-old tau P301S mice for 3 months (3 mg/kg/day). A. Representative images of immunofluorescent staining for Tau K353-DOPEGAL (red), DBH (green), DAPI (blue) in the LC sections from WT or Tau P301S mice. Scale bars are 100 μm (left) and 20 μm (right). B. Quantification of DBH+ cells. C & D. MAO-A activity (C) and measurement of DOPEGAL (D) in the LC of vehicle- or clorgyline-administered tau P301S mice via enzymatic and HPLC analysis. Data are shown as mean ± SEM. n = 9 mice (B), n = 5 mice (C & D) per group. One-way ANOVA. E. Representative images of immunofluorescent staining for Tau K353-DOPEGAL (red), T22 (green), and DAPI (blue) in the LC, entorhinal cortex (EC), and hippocampus (HC) of vehicle- or clorgyline-administered tau P301S mice. All scale bars are 100 μm. F. Representative images of Golgi staining in CA1 region of vehicle- or clorgyline-administered tau P301S mice. Scale bar is 5 μm. G. Quantification of dendritic spines in Golgi staining of CA1 region. Data are shown as mean ± SEM. n = 5 mice per group. Student t-test. H. Representative electron microscopy images demonstrating the increase of synapses (red arrows) in CA1 region of clorgyline-administered tau P301S mice. Scale bar is 2 μm. I. Quantification of synaptic density in electron microscopy images of the CA1 region. Data are shown as mean ± SEM. n = 5 mice per group. Student t-test. J-L. Morris water maze test demonstrating that clorgyline alleviates cognitive impairment in tau P301S mice. Shown are latency travelled to the platform (J), area under the curve for total time travelled (K), and percent time spent in the quadrant platform during the probe trial (L). M & N. Fear conditioning test. Shown are the percentage of freezing time during the contextual fear (M) and cued fear (N). All data are shown as mean ± SEM. n = 9 mice per group. Student t-test with Welch’s correction.
Blockade of Tau K353 modification diminishes Tau pathology
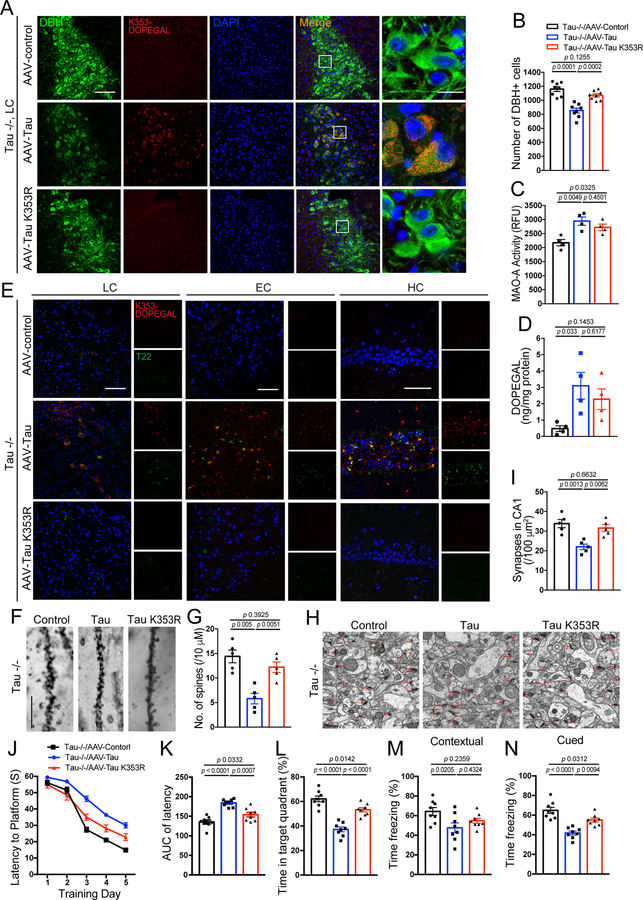
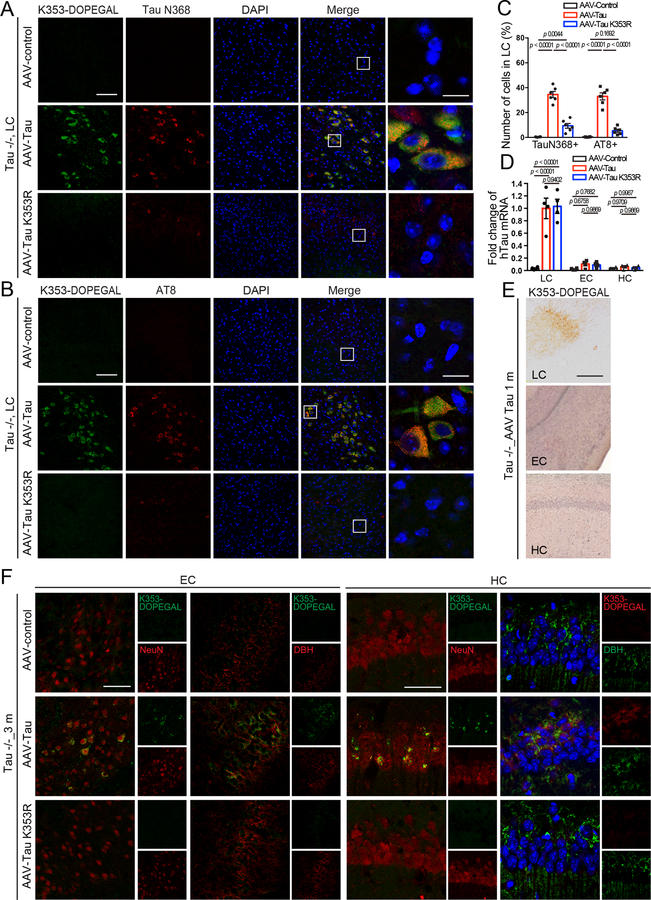
To explore the contribution of K353-DOPEGAL to Tau pathology, we used viral vectors to overexpress either WT or K353R mutant Tau that cannot be modified by DOPEGAL in the LC of Tau−/− mice. To avoid the potential interference from endogenous Tau on K353-DOPEGAL modification’s pathological effects, we chose Tau−/− mice versus MAPT or WT mice. Noticeably, WT Tau increased K353-DOPEGAL levels and induced LC degeneration. By contrast, K353R mutant Tau completely prevented K353-DOPEGAL accumulation and LC neuronal loss (Figure 6A–C). Because K353R Tau still elicited MAO-A activation, DOPEGAL levels in the LC were significantly escalated in the LC of both Tau WT and K353R mutant-infected mice (Figure 6D), indicating that Tau K353-DOPEGAL modification is indispensable for both Tau and DOPEGAL neurotoxicity. Consistent with these observations, WT Tau overexpression also provoked both Tau N368 cleavage and AT8 activity, associated with demonstrable K353-DOPEGAL modification. In contrast, these effects were ameliorated in mice injected with AAV-Tau K353R (Extended Data figure 6A–C), demonstrating that DOPEGAL conjugation on Tau K353 is required for Tau to trigger AEP activation and Tau hyperphosphorylation. T22-positive Tau aggregates in mice expressing Tau WT were also prominently conjugated by DOPEGAL on K353, which were propagated from the LC to the EC to the HC. By contrast, T22-positive Tau pathology was not detected with K353R mutant, which failed to spread along the LC-EC-HC neural circuit in Tau−/− brains (Figure 6E). Moreover, we performed RT-PCR using the samples from the LC, EC, and HC to verify whether it is Tau protein or the virus transported to the EC and HC. As expected, mRNA expression of hTau was found only in the virus-injected LC region, but not the EC or the HC (Extended Data figure 6D), supporting that Tau pathologies but not AAV vectors spread from the LC to other brain regions. Three months after the viral injection, Tau pathologies spread from the LC to other brain regions including the EC and the HC. It is worth noting that Tau K353-DOPEGAL appeared in only the LC but not EC or the HC one month after virus injection (Extended Data figure 6E & F). To ensure that the Tau pathology observed in the EC and the HC after application in the LC is post-synaptic in EC/HC cell bodies or dendrites, but not accumulated in LC fibers and terminals innervating the EC/HC, we conducted K353-DOPEGAL/NeuN or K353-DOPEGAL/DBH co-staining in the EC/HC regions and found that K353-DOPEGAL signals were detectable in NeuN positive EC/HC neurons after AAV-WT Tau infected in the LC neurons. By contrast, AAV-K353R mutant failed to propagate into the EC/HC regions (Extended Data figure 6F). These findings support that exogenous WT Tau but not K353R mutant can propagate the pathology down axons and cross the synapses in the absence of endogenous Tau. Compared to control virus, WT Tau overexpression elicited dendritic spine loss and synaptic degeneration in Tau−/− brains, which were greatly alleviated by K353R mutant (Figure 6F–I). MWM and fear conditioning tests demonstrated that overexpression of WT Tau impaired cognition, which was consistently rescued by the K353R mutant (Figure 6J–N). Therefore, overexpression of WT but not K353R mutant Tau stimulates Tau N368 cleavage by active AEP, accompanied with K353-DEPOGAL modification and Tau hyperphosphorylation, resulting in Tau pathology propagation from the LC to EC and HC, synaptic dysfunction, and cognitive impairment in Tau−/− mice.
Figure 6. K353R mutation is unable to initiate or propagate tau pathology and memory dysfunctions in Tau −/− mice.
AAV-control, AAV-Tau, and AAV-Tau K353R were injected into the LC of 3-month-old Tau−/− mice. The mice were assessed for DOPEGAL-modified Tau, Tau pathology and memory dysfunction 3 months after injection. A. Representative images of immunofluorescent staining for Tau K353-DOPEGAL (red), DBH (green), DAPI (blue) in the LC sections. Scale bars are 100 μm (left) and 20 μm (right). B. Quantification of DBH+ cells. C & D. MAO-A enzymatic activity (C) and the content of DOPEGAL (D) in the LC of virus-injected Tau−/− mice. Data are shown as mean ± SEM. n = 8 mice (B), n = 4 mice (C & D) per group. One-way ANOVA. E. Representative images of immunofluorescent staining for Tau K353-DOPEGAL (red), T22 (green), and DAPI (blue) in the LC, entorhinal cortex (EC), and hippocampus (HC) of virus-injected Tau−/− mice. All scale bars are 100 μm. F. Representative images of Golgi staining in CA1 region of virus-injected Tau−/− mice. Scale bar is 5 μm. G. Quantification of dendritic spines in Golgi staining of CA1 region. Data are shown as mean ± SEM. n = 5 mice per group. One-way ANOVA. H. Representative electron microscopy images demonstrating the change of synapses (red arrows) in the CA1 region. Scale bar is 2 μm. I. Quantification of synaptic density in CA1 region. Data are shown as mean ± SEM. n = 5 mice per group. One-way ANOVA. J-L. Morris water maze test demonstrating the alleviated memory dysfunctions by Tau K353R mutation. Shown are latency travelled to the platform (J), area under the curve for total time travelled (K), and percent time spent in the quadrant platform during the probe trial (L). M & N. Fear conditioning test. Shown are the percentage of freezing time during the contextual fear (M) and cued fear (N) tests following fear conditioning. All data are shown as mean ± SEM. n = 8 per group. One-way ANOVA.
K353-DOPEGAL modification is required for Tau propagation
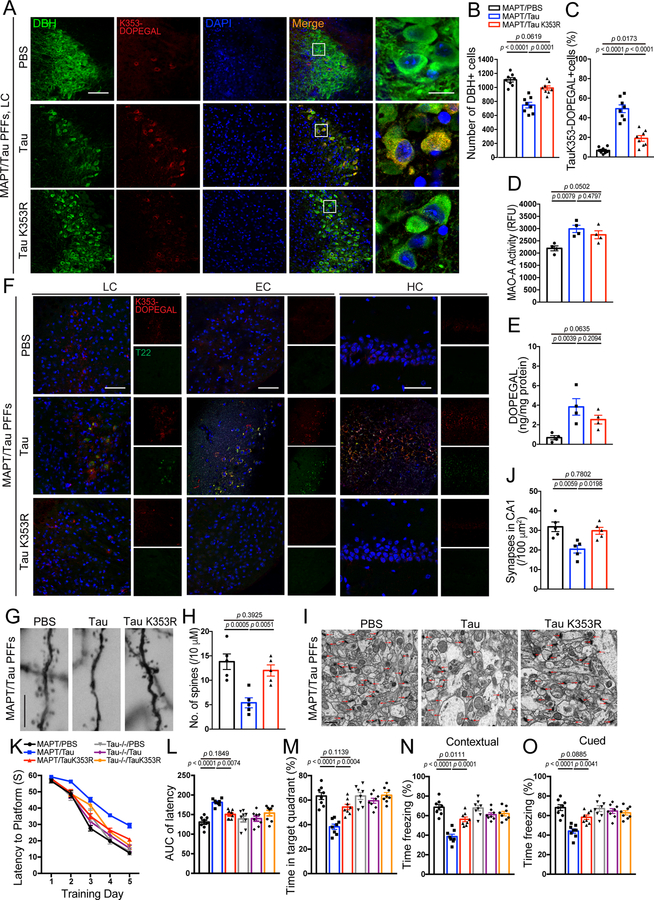
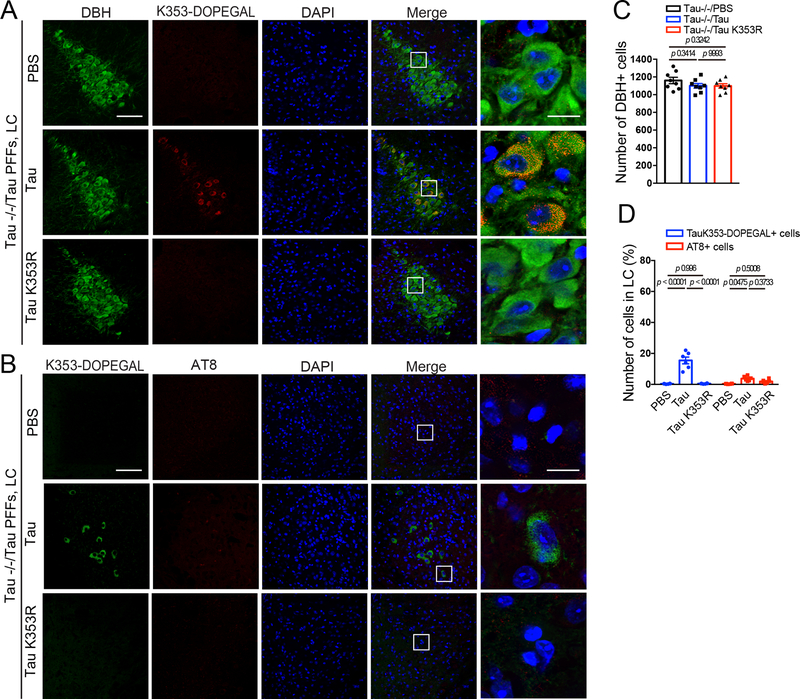
Next, we hypothesized that pre-formed fibrils (PFFs) synthesized from WT and K353R mutant Tau would induce different AD-like pathological effects in MAPT mice. Strikingly, WT Tau PFFs strongly induced LC neuronal degeneration as compared with control, associated with pronounced K353-DOPEGAL signals in surviving NE neurons. By contrast, K353R PFFs did not significantly affect LC neuronal survival. Although much weaker DOPEGAL modification signals on endogenous mouse Tau were evident, K353R mutant PFFs elicited significantly more K353-DOPEGAL positive cells in the injected LC regions than PBS control (Figure 7A–C). Importantly, when PFFs were injected into the LC of Tau −/− mice, only WT Tau PFFs, but not K353R mutant PFFs, exhibited demonstrable K353-DOPEGAL activity and LC neurotoxicity. In conjunction, WT but not K353R mutant PFFs also elevated AT8 immunoreactivity (Extended Data figure 7A–D), indicating that the endogenous machinery including active MAO-A-produced DOPEGAL and kinases that phosphorylate Tau modify injected WT PFFs. Although both MAO-A enzymatic activity and DOPEGAL levels were significantly elevated by either type of PFFs (Figure 7D & E), WT Tau PFFs possessed more potent effects on Tau pathology transmission from the LC to the EC and HC. In contrast, these events were not detectable in MAPT mice injected with K353R PFFs (Figure 7F), suggesting that DOPEGAL conjugation on Tau K353 enhances the seeding activity of Tau PFFs to act as seeds to initiate endogenous Tau pathology spreading. Golgi staining and EM analysis demonstrated that Tau WT PFFs were much stronger than K353R PFFs in triggering dendritic spines loss and synaptic degeneration in the hippocampus of MAPT mice (Figure 7G–J). MWM and fear conditioning assays revealed that Tau PFFs produced cognitive defects in MAPT mice, which were ameliorated by the K353R mutant. By contrast, Tau−/− mice manifested comparable cognitive activities regardless of Tau WT or K353R PFFs administration (Figure 7 K–O). Thus, K353-DOPEGAL conjugation plays a pivotal role in mediating Tau PFFs-provoked Tau pathology propagation and cognitive dysfunction in MAPT mice.
Figure 7. Mutation of K353R is resistant to tau fibrillization and propagation in MAPT mouse brain.
Preformed fibrils (PFFs) generated from wild-type and K353R mutant tau were injected into the LC of 3-month-old MAPT mice, and then mice were assessed for DOPEGAL-modified Tau pathology, propagation, and memory dysfunction 3 months after injection. A. Representative images of immunofluorescent staining for Tau K353-DOPEGAL (red), DBH (green), DAPI (blue) in the LC sections. Scale bars are 100 μm (left) and 20 μm (right). B & C. Quantification of DBH+ cells (B) and quantification of Tau K353-DOPEGAL+ cells (C) in the LC regions of Tau PFFs-injected MAPT mice. Data are shown as mean ± SEM. n = 8 per group. One-way ANOVA. D & E. MAO-A enzymatic activity (D) and the content of DOPEGAL (E) in the LC of PFFs-injected MAPT mice. Data are shown as mean ± SEM. n = 4 mice per group. One-way ANOVA. F. Representative images of immunofluorescent staining for Tau K353-DOPEGAL (red), T22 (green), and DAPI (blue) in the LC, entorhinal cortex (EC), and hippocampus (HC) of PFFs-injected MAPT mice. All scale bars are 100 μm. G. Representative images of Golgi staining in CA1 region of PFFs-injected MAPT mice. Scale bar is 5 μm. H. Quantification of dendritic spines in Golgi staining of CA1 region. Data are shown as mean ± SEM. n = 5 per group. One-way ANOVA. I. Representative electron microscopy images demonstrating the change of synapses (red arrows) in CA1 region of PFFs-injected MAPT mice. Scale bar is 2 μm. J. Quantification of synaptic density in electron microscopy images of CA1 region. Data are shown as mean ± SEM. n = 5 mice per group. One-way ANOVA. K-O. Morris water maze test demonstrating the alleviated memory dysfunctions by Tau K353R mutation in Tau PFF-injected MAPT mice. Shown are latency travelled to the platform (K), area under the curve for total time travelled (L), and percent time spent in the quadrant platform during the probe trial (M). N & O. Fear conditioning test. Shown are the percentage of freezing time during the contextual fear (N) and cued fear (O) tests following fear conditioning. All data are shown as mean ± SEM. n = 8 per group. One-way ANOVA.
Discussion
In the present study, we demonstrate that DOPEGAL covalently modifies the primary amine on the K353 residue of Tau via Schiff base bond, stimulating Tau aggregation and neurotoxicity. K353-DOPEGAL abundance is age-dependently increased in the LC of Tau P301S mice, correlated with elevated MAO-A and AT8 levels. MAO-A-mediated metabolism of NE to DOPEGAL was critical for these effects. Blockade of Tau modification by DOPEGAL by mutating the K353 residue to R suppressed Tau pathology spreading, synaptic loss, and cognitive deficits induced by Tau overexpression in the LC. Similar effects of the K353R mutation were evident when Tau PFFs were substituted for transgenic or viral-mediated Tau overexpression. In alignment with the finding that DOPEGAL activates AEP 30, knockout of AEP from MAPT mice decreased K353-DOPEGAL levels and blunted Tau N368 fragmentation triggered by DOPEGAL injection into the LC, preventing LC neuron loss. These findings are consistent with our recent observation that DOPEGAL activates AEP, which cleaves Tau at residue N368 into aggregation- and propagation-prone forms, thus leading to LC degeneration and the spread of Tau pathology 30. In fact, the concentration of AEP-generated Tau N368 fragment is elevated in the cerebrospinal fluid of AD patients, and correlate with the severity of Tau pathology 33,34.
Levels of the aldehydes identified as being toxic in vitro are close to physiological levels found in normal human postmortem brains 21,24. For example, DOPAL, a highly toxic and oxidative dopamine metabolite, induced significant cytotoxicity in PC12 cells at 6.6 μM, a concentration close to the physiological levels reported in normal human autopsy specimens of the SN 21,24. We reported that AEP is activated by DOPAL in the substantia nigra 29, which subsequently cleaves α-synuclein and promotes its aggregation and dopaminergic neuronal loss, leading to motor dysfunction in animal models of PD 35. DOPEGAL at similar concentrations (6 μM) induces the mitochondrial PT in isolated liver mitochondria, whereas its parent catecholamine NE had no such effect 23. Oxidative stress is a critical factor in neurodegenerative diseases 36. The reactions catalyzed by MAO-B or A to form DOPAL and DOPEGAL, respectively, produce H2O2, which can generate other ROS and free radicals 23. Injection of DOPEGAL into the rodent LC elicits adrenergic and noradrenergic neuronal loss 26,30, probably due to these toxicities. The activation of AEP by DOPEGAL triggers a cascade of events, resulting in Tau N368 cleavage, hyperphosphorylation, aggregation, and neurotoxicity in LC neurons 30.
Aldehydes react with proteins to form various adducts that can disrupt protein function and cause cellular damage 37. We have discovered that DOPEGAL covalently modifies the primary amine on Tau K353 to form Schiff bases (Figure 1), which are inherently unstable, and the binding that involves them can be reversed or further converted into more stable products by physiological reducing agents, such as glutathione or ascorbate 38. The identity of this structure was validated by LC/MS/MS and a purified specific polyclonal antibody against K353-DOPEGAL (Figure 4). Interestingly, this modification enhances both full-length Tau and Tau N368 fragment fibrillization in vitro and in cellular models. DOPEGAL induces prominent aggregation and hyperphosphorylation on Tau-RD stably transfected K18 but not K353R mutant (Figure 1 & 2). The X-ray diffraction analysis shows that DOPEGAL conjugation on K353 residue condenses Tau fibrils, and combined with the observed effects of DOPEGAL in SH-SY5Y cells and primary neurons, strongly indicate that Tau DOPEGAL modification facilitates its aggregation, hyperphosphorylation and neurotoxicity. The ability of DOPEGAL to covalently modify Tau also increases its phosphorylation and neurotoxicity in primary neuronal cultures, induced by Tau PFFs as seeds. Hyperphosphorylated Tau protein and/or NFTs cause mitochondrial dysfunction and inhibition of axonal transport in AD, which lead to the accumulation of neurotoxins 39,40. Moreover, human Tau accumulation disrupts mitochondrial dynamics and functions via increasing mitofusins, triggering neuronal degeneration 41,42. Conceivably, DOPEGAL-modified Tau aggregates may exert neurotoxicity via these mechanisms.
The progression of AD pathology follows a remarkably systematic pattern across individuals 43. Emerging evidence supports a model of cell-to-cell transmission of proteinaceous pathological Tau seeds, which leads to recruitment and templated fibrillization of endogenous cellular Tau followed by the spread of abnormal Tau throughout the brain 44. In the current work, we show that K353-DOPEGAL modification on Tau enhances its aggregation and yields compact fibrils. Interestingly, this covalent conjugation makes Tau more vulnerable for AEP cleavage (Figure 1). To interrogate this chemical modification on Tau pathology propagation, we employed an MAO-A inhibitor to treat Tau P301S mice and reveal that blocking Tau K353-DOPEGAL conjugation strongly reduces Tau aggregates propagation from the LC to the EC and HC in Tau P301S (Figure 5E). Further, overexpression of Tau in the LC region in Tau−/− mice triggers MAO-A activation and DOPEGAL elevation, resulting in K353-DOPEGAL signals elevation, Tau aggregation and transmission from the LC to the EC and HC. These effects are abolished in Tau K353R mutant (Figure 6). It is worth noting that AAV-Tau is propagated much faster than Tau PFFs in spreading along neuronal connectivity pathways 45. Trans-synaptic free Tau is released and taken up to postsynaptic cells by endocytosis or by membrane fusion of extracellular vesicles 46. Remarkably, removing endogenous Tau does not prevent Tau propagation yet reduces its neurotoxicity, suggesting that the spread of Tau does not require endogenous Tau 47. Therefore, these findings are in agreement with our observations that AAV-Tau stereotaxically injected in the LC of Tau −/− mice can spread via trans-synaptic crossing to the EC and HC, leading to cognitive deficits (Figure 6). Noticeably, injection of Tau PFFs into the LC of MAPT mice elicits similar effects, which are abrogated by K353R mutation (Figure 7). These findings support that misfolded or pathological conformers of Tau after DOPEGAL conjugation undergo cell-to-cell spread.
The LC is one of the first structures afflicted in AD, and degeneration of the LC is a ubiquitous feature of mid to late-stage disease. Research in animal models has shown that LC dysfunction and degeneration contribute to the progression of forebrain pathology and cognitive impairment 12,48–50, whereas restoration of noradrenergic signaling can ameliorate AD-like symptoms 7,51. Our findings demonstrate that DOPEGAL covalently modifies Tau K353 and stimulates its aggregation and neurotoxicity in vitro and in vivo, as well as its propagation to interconnected brain regions and resulting cognitive impairment. In parallel, activation of AEP by DOPEGAL further exacerbates its neurotoxicity via proteolytically cleaved Tau N368 and amplifies Tau pathologies. Hence, both DOPEGAL and AEP modify Tau post-translationally, and interact to further drive Tau aggregation and toxicity. Inhibitors of AEP or MAO-A are capable of blocking LC neuronal Tau pathology in our mouse models, and thus should be evaluated for therapeutic efficacy in mild cognitive impairment/early AD.
Methods
Animals.
AD mice, which are Tau P301S mice (line PS19) and wild-type human Tau mice (line MAPT), and wild-type mice (all on a C57BL/6J background) were purchased from the Jackson Laboratory (Tau P301S, 008169; MAPT, 005491; C57BL/6J, 000664). DBH−/− mice were maintained on a mixed 129/SvEv and C57BL/6 background. Tau P301S mice were crossed with DBH−/− mice to generate Tau P301S/DBH−/− mice. Adrenergic agonists and/or L-DOPS were used to rescue the DBH−/− embryonic lethality and male mating deficit. AEP−/− mice were generated on a mixed 129/Ola and C57BL/6 background. MAPT/AEP −/− were generated by crossbreeding of MAPT mice and AEP−/− mice. 3-month-old female mice were chosen for the experiments and 8 ~ 9 mice were used per groups. Temperatures of 18–23 °C with 40–60 % humidity and 12 light/12 dark cycle were used for housing condition. The group allocation during the animal experiments and the behavior analysis were conducted in a blind manner. Animal care and procedures were performed based on the National Institutes of Health Guide for Care and Use of Laboratory Animals and approved by the Institutional Animal Care and Use Committee at Emory University.
Human tissue samples.
LC sections prepared by paraffin from 10 postmortem AD cases of Braak stages IV-VI (5 males and 5 females, age 62 ± 10.9 years, mean ± SD) and 10 cognitively normal controls (6 males and 4 females, age 59.4 ± 8.8 years, mean ± SD) were offered from the Emory Goizueta Alzheimer’s Disease Research Center. The standardized diagnostic criteria of CERAD (Consortium to Establish a Registry for AD) was used for the evaluation and diagnosis of patients with AD. Informed consent was obtained from the subjects prior to death. Pathological hallmark of AD, which is the presence of amyloid plaques and neurofibrillary tangles in formalin-fixed tissue, confirmed the clinical diagnosis.
Transfection and viral infection of cells.
Primary cortical neurons were cultured as previously described 27,28. All rats were purchased from the Jackson Laboratory. HEK293 (ATCC® CRL-1573) cells and SH-SY5Y cells were transfected with plasmids encoding Tau or Tau K353R using polyethylenimine (PEI) or Lipofectamine 3000 (Thermo Fisher Scientific). AAV-Tau and AAV-Tau K353R were used for infection in primary neuron and SH-SY5Y (ATCC® CRL-2266™) neuroblastoma cells. Neurotoxicity was analyzed using LDH assay (CytoTox 96® Non-Radioactive Cytotoxicity Assay, Promega).
Western blot analysis.
The protein samples from cultured cells and mouse brain were lysed in cell lysis buffer (50 mM Tris, pH 7.4, 40 mM NaCl, 1 mM EDTA, 0.5% Triton X-100, 1.5 mM Na3VO4, 50 mM NaF, 10 mM sodium pyrophosphate, 10 mM sodium β-glycerophosphate, supplemented with a cocktail of protease inhibitors). Cell lysate was centrifuged for 20 min at 15,000 rpm. The supernatant was collected and boiled with 4X SDS loading buffer. The proteins in the samples were separated according to their size by sodium dodecyl sulfate polyacrylamide gel electrophoresis (SDS-PAGE) and transferred to a nitrocellulose membrane. The used primary antibodies for the detection of proteins are as follows: Tau5 (Santa Cruz, SC-58860, 1:1500 dilution), AT-8 (Thermo Fisher Scientific, MN1020, 1:500 dilution), beta-actin (Sigma-Aldrich, A5316, 1:1500 dilution), AEP (Cell signaling, 93627S, 1:1000 dilution), T22 (Millipore, ABN454, 1:500 dilution), Tau N368 (custom antibody27, 1:1000 dilution), and Tau K353-DOPEGAL (custom antibody, 1:1000 dilution).
MAO-A activity assay.
MAO-A enzyme activity was analyzed by Amplex Red Monoamine Oxidase Assay Kit (Invitrogen, #A12214). The lysates from cultured cell and mouse brain tissue (20 μg) were incubated with a working solution of 100 μl containing 400 μM Amplex® Red reagent, 2 U/ml HRP, and 2 mM p-tyramine substrate with MAO-B inhibitor, pargyline (Molecular Probes). The enzyme activity of MAO-A was measured by a fluorescence plate reader in the range of 530–560 nm of excitation and 590 ±10 nm of emission at 37°C for 2 hours in kinetic mode.
HPLC analysis.
Mouse brain tissues of LC area were homogenized in 150 μL ice-cold 0.1 M PCA containing 0.1 mM EDTA by probe sonication on setting 3 with a 30% duty cycle. Homogenates were centrifuged at 10,000 × g for 10 min at 4°C, and any remaining particulate matters from supernatants were eliminated by PVDF microcentrifuge filter (0.22 μm) at 5000 × rpm for 5 min at 4°C. For HPLC, an ESA 5600A CoulArray detection system, equipped with an ESA Model 584 pump and an ESA 542 refrigerated autosampler (ESA, Bedford, MA), was used. Samples were separated at 23°C using C18 column of Xterra RP 4.6 × 250 mm, 3.5 μM particle size (Waters, Milford, MA). The mobile phase consisted of 72 mM sodium hydrogen phosphate, 28 mM citric acid, 0.6 mM 1-octanesulfonic acid sodium, 0.2 mM EDTA at pH 5.35. A 20 μl of sample was injected and eluted isocratically at 0.5 mL/min and detected using a 6210 electrochemical cell. Analytical cell potentials were −175, 100, 350 mV. The analytes were identified by the matching criteria of retention time to known standards and compounds were quantified by comparing peak areas to those of standards on the dominant sensor.
Thioflavin T (ThioT) assay.
ThioT stock solution (3 mM) was filtered through a 0.2-μm syringe filter (Sigma-Aldrich. Cat#T3516). The stock solution was diluted into the aggregation buffer (20 mM Tris, pH7.4, 100 mM NaCl, 1 mM EDTA) to generate the working solution (30 μM). ThioT working solution with heparin (30 μM), recombinant Tau (2 μg), and DOPEGAL (500 μM) was incubated on an orbital shaker at 37°C and excited at 440 nm and emitted at 482 nm to measure the fluorescence intensity on the plater reader (BioTek, #251639, Vermont, USA). Fluorescence values (excitation at 440 nm and emission 482 nm) onto the plate reader (BioTek, #251639, Vermont, USA) were recorded for 7 days.
Immunostaining.
Paraffin-embedded human brain sections or free-floating mouse brain sections sliced by cryotome were treated with 0.3% H2O2 for 10 min. Sections were washed three times in PBS and blocked in 1% BSA, 0.3% Triton X-100, for 1 h, followed by overnight incubation with a dopamine beta-hydroxylase (DBH) antibody (Invitrogen, PA3–925; 1: 1000), anti-T22, anti-Tau N368, anti-TauK353-DOPEGAL, or AT-8 antibody (1: 500) at 4°C. Then, the sections were incubated with the matched fluoro-conjugated secondary antibody for 2 h at room temperature, followed by three washes in PBS. The slides were washed three times in PBS and covered with a glass using mounting solution, after DAPI staining for 5 min. Human brain sections were treated with 10 mM cupric sulfate in ammonium acetate buffer (50 mM) for 15 min to eliminate lipofuscin-like autofluorescence. For immunofluorescent staining of cultured neurons and HEK293 cells stably transfected with GFP-Tau RD, the cells were first fixed and premetallized with 4% paraformaldehyde containing 1% Triton X-100 for 10 min to eliminate the soluble tau, and stained as described above.
Electron microscopy.
The brain of mouse was perfused and fixed with 2% glutaraldehyde and 3% paraformaldehyde dissolved in PBS. Hippocampal tissues were post-fixed in 1% osmium tetroxide (OsO4) in buffer for 1 h. Tissues were embedded and made as blocks, following thin sectioning in ultramicrotome. Ultrathin sections of 90 nm were stained with uranyl acetate (Sigma-Aldrich, Germany) and lead acetate, and captured in a JEOL 200CX electron microscope at 100 kV. Synapses were identified and quantified by the presence of synaptic vesicles and postsynaptic densities.
X-ray diffraction.
The PFFs of Tau FL, Tau K353R, Tau N368, Tau N368 K353R were lyophilized for 3 days using a freeze-drying machine to prepare the dried samples for X-ray diffraction. X-ray diffraction was detected at 300 mm sample-to-detector distance with an exposure time of 30 s. The X-ray diffraction patterns for dried fibrils were radially integrated to generate one-dimensional scattering patterns in either the equatorial or meridional direction using a 30 degree sector in the azimuthal direction on either side of the anionic reflection. The position of anionic reflections and the difference in position of either side of the pattern was established by the position of maximum intensity. The position of the beam sample-to-detector distance and pixel size were determined by calibration of high-density polyethylene (HDPE).
Golgi staining.
Mice were perfused and fixed by 10% formalin and the brains of mice were post-fixed in the same fixation buffer for 24 h. The brains were immersed in 3% potassium bichromate at room temperature for 7 d in the dark, transferred into 2% silver nitrate solution, and incubated at room temperature for 3 d in the dark. Hippocampal sections were cut at 50 mm by a vibratome. After the sections were mounted in the slides, they were air-dried and dehydrated through 50%, 70%, 95%, 100% ethanol, and 100% xylene. The sections were coverslipped and images were taken.
Clorgyline administration.
MAO-A inhibitor, Clorgyline (Sigma), or vehicle was administered in the drinking water to P301S mice for 3 months. Daily water intake of mice was measured as about 5.8 mL/25 g mouse before administration. The oral dose of clorgyline was about 3 mg/kg/day.
Stereotaxic injection.
Adeno-associated viruses for Tau, Tau K353R, or MAO-A were injected intracranially into the LC region of mice. 3-month-old mice (20 ~ 25 g) of each group were anesthetized with 2 ~ 3% isoflurane (Piramal Healthcare) and meloxicam (5 mg/kg) was administered for analgesia (Loxicom, Norbrook). Viruses (2 μl) were injected into the right side of the brain using a 10-μl Hamilton syringe at a rate of 0.25 μl/min to the following stereotaxic coordinates: anteroposterior (AP) −5.4 mm and mediolateral (ML) −1.2 mm relative to bregma, and dorsoventral (DV) −3.7 mm from the dural surface. The needle remained in place for 3 minutes after the viral suspension was completely injected, and then was slowly removed over 2 minutes. The mice were monitored until they were fully recovered from the anesthesia in a heating pad.
Behavioral tests
Morris water maze.
Mice were placed in a water-filled round tub (52” diameter) in an environment with extra maze cues and trained 4 trials/d for 5 consecutive days, with a 15-minutes intertrial interval. The maximum trial time was 60 second. Mice were manually guided to it, if they did not reach the platform in the limited time. Following the 5 days of task acquisition, a probe trial was conducted without the platform and the percentage of time spent in the quadrant that previously contained the escape platform was measured over 60 seconds. All trials were analyzed for latency and we monitored body weight, visual ability, and swim speed to confirm that the deficits did not result from motor dysfunction.
Fear conditioning.
An associative learning ability for measuring aversive learning and memory of mice was tested over a period of 3 days. Mice were placed in the fear conditioning apparatus (7″ W, 7″ D X 12″ H, Coulbourn Instruments), composed of Plexiglas and a metal shock grid floor. They were allowed to explore the enclosure for 3 minutes and 3 conditioned stimulus (CS)-unconditioned stimulus (US) pairings were given with one-minute interval. The conditions of a 20-s 85-db and 2 s of a 0.5-mA foot shock were used for CS and US, respectively. In one minute after the last CS-US presentation, mice were returned to their home cage. For the contextual test in the second day, mice were placed in the same chamber used conditioning test in the first day and the freezing time was recorded by video camera and the software provided by Colbourn without any shocks. For a tone test in the third day, mice were exposed to the CS in a novel compartment. Mice were allowed to explore the novel context for 2 minutes, following the 85-db tone for 6 min, and then the freezing behavior was recorded.
Unbiased stereological quantification.
Noradrenergic cells in LC were counted using the Stereo Investigator software (MBF Bioscience, Williston, VT) and Olympus microscope. LC sections of 30 μm at every 6th section were stained with DBH antibody and analyzed under the randomly placed counting frames (50 × 50 μm) on a counting grid (120 × 120 μm). Optical dissector of 22 μm with 2 μm upper and lower guard zones was used. The total number of DBH-positive neurons in the LC was evaluated according to the optical fractionator method. The counting positive neurons was decided by the same threshold of the intensity of immune-reactive neurons. All analysis was conducted by the blinded manner.
Liquid chromatography/tandem mass spectrometric analysis.
~ 100 μg DOPEGAL modified rTau as well as the unmodified rTau were subject to short gel analysis followed by DTT reduction, iodoacetamide alkylation, and in-gel digestion (13 ng/μl trypsin overnight). The resulting tryptic peptides were fractionated and concatenated into 20 fractions on a HPLC column (Waters Xbridge C18, 2.1×100 mm, 3.5 μm) at 100 μl/min with a gradient of 15–50% B in 60 min. Solvent A consists of 10 mM ammonium formate pH 8.0 and solvent B is made of 10 mM ammonium formate and 90% acetonitrile pH 8.0. Each peptide fraction was loaded onto a nanoscale capillary reverse-phase C18 column (75 μm x 150 mm, C18, 1.9 μm) and analyzed by a high-performance liquid chromatography system (ThermoFisher, ultimate 3000) coupled with a LTQ Orbitrap HF mass spectrometer (ThermoFisher Scientific) operating in the optimized high-resolution mode 52. The acquired MS/MS data were searched against a database to identify DOPEGAL modified lysine(s) in rTau through a dynamic mass shift for the modified lysine (+105.0317 Da) as well as methionine oxidation (+15.9949 Da), using PEAKS software (PEAKS8.5, Bioinformatics Solutions Inc.) 53. The identified modified peptides were filtered by mass accuracy and matching scores to reduce peptide FDRs to less than 1%.
Statistical analysis.
3 or more independent experiments were performed for all cell culture data and presented as mean ± S.E.M. No statistical methods were used to pre-determine animal number for in vivo experiments. However, we used the similar mice number to previous studies using AD mice model. The data met the assumption of normality and equal variances were tested. The significance between 2 groups was analyzed by Student’s t-test. For the significance of more than 2 groups, one-way or two-way ANOVA with Tukey’s post-hoc test was applied. A value of < 0.05 was considered to be statistically significant.
Extended Data
Extended Data Fig. 1. Biophysical characterization of recombinant Tau and Tau K353R mutant fibrils.
A. X-ray diffraction assay demonstrating characters of fibrils generated from Tau, Tau K353R, Tau N368, and Tau N368 K353R protein. B. Quantification table showed that DOPEGAL increased the counts of β-sheet at around 4.8 Å for Tau and Tau N368, but not Tau K353R and Tau N368 K353R. C. LC-MS/MS spectrum confirming DOPEGAL-modified Tau residue at K353 by the application of GluC digestion for the protein samples. D. Recombinant wild-type and K353R Tau were induced to aggregate into PFFs in the presence or absence of DOPEGAL. The PFFs were digested with Protease K (2 μg/ml). All data are representatives of three independent experiments with similar results. E. Recombinant Tau and Tau N368 were incubated with DOPEGAL (500 μM) for 0, 5, 30, and 60 minutes. Western blot and densitometric quantification of TauK353-DOPEGAL band showed that Tau N368 is more prone to be modified by DOPEGAL than full-length Tau. All data are shown as mean ± SEM. n = 3 per group. Paired Student t-test.
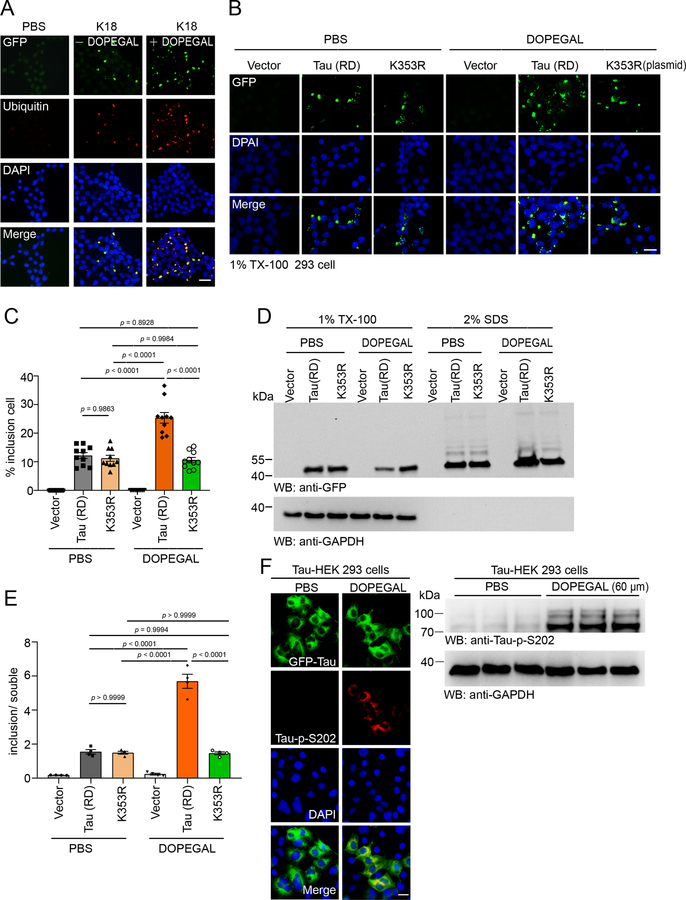
Extended Data Fig. 2. DOPEGAL promotes tau aggregation, attenuated by Tau K353R mutation.
A. Representative images showing the co-localization of aggregated tau with ubiquitin in tau PFF-treated HEK293 cells stably transfected with GFP-Tau RD in the presence or absence of DOPEGAL. Scale bar is 20 μm. B. HEK293 cells were transfected with wild-type or K353R mutant Tau RD, treated with DOPEGAL, and then transduced with tau PFFs. The green dots show tau inclusions. Scale bar is 20 μm. C. Quantification of the percentage of cells with tau inclusions. Data are shown as mean ± SEM. n = 10 per group. One-way ANOVA. D. The cells were sequentially extracted with 1% Triton X-100 lysis buffer followed by 2% SDS. Cell lysates from Triton X-100 soluble and SDS-soluble fractions were immunoblotted with GFP antibody. E. Quantification of the relative concentration of tau in the Triton X-100 soluble and SDS-soluble fractions. Data are shown as mean ± SEM. n = 4 per group. One-way ANOVA. F. The HEK293 cells stably transfected with GFP-Tau RD were exposed to DOPEGAL. The phosphorylation of tau at S202 was analyzed by immunofluorescence (red) and western blot. All data and images are representatives of three independent experiments with similar results.
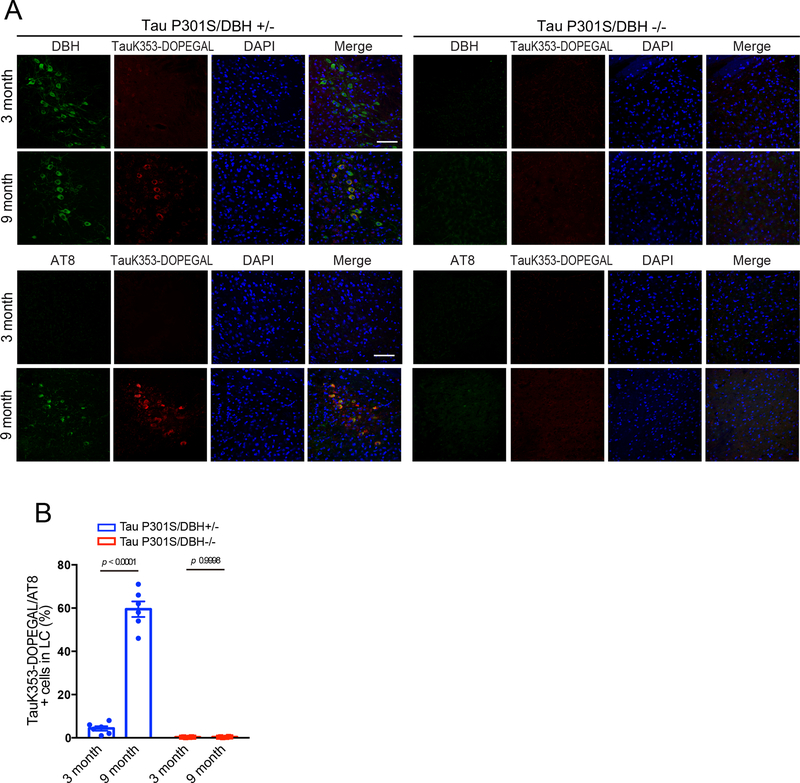
Extended Data Fig. 3. DOPEGAL modification at Tau K353 is dependent on NE.
Tau P301S/DBH+/− and Tau P301S/DBH−/− mice of 3 months and 9 months old were examined for DOPEGAL modification and phosphorylation of Tau in the LC by immunofluorescence staining. A. Representative images of DBH (green), Tau K353-DOPEGAL (red), and DAPI (blue), AT8 (green), Tau K353-DOPEGAL (red), and DAPI (blue) staining in LC sections of Tau P301S/DBH+/− and Tau P301S/DBH−/− mice. Scale bar = 100 μm. B. Quantification of Tau K353-DOPEGAL/AT8+ cells. Data are shown as mean ± SEM. n = 6 per group. Two-way ANOVA with Sidak’s multiple comparison.
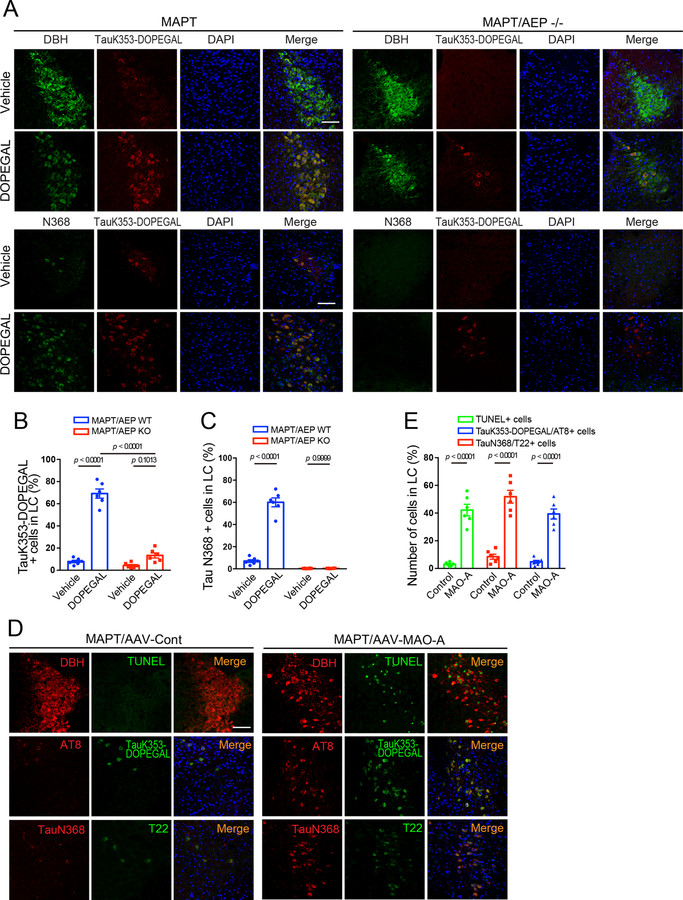
Extended Data Fig. 4. DOPEGAL modification of Tau is regulated by AEP and MAO-A.
DOPEGAL (0.25 μg) was injected into the LC regions of MAPT and MAPT/AEP−/− mice. DOPEGAL modification and cleavage of Tau in the LC were examined by immunofluorescence staining. A. Representative images of DBH (green), TauK353-DOPEGAL (red), and DAPI (blue); Tau N368 (green), TauK353-DOPEGAL (red), and DAPI (blue) staining in LC sections of DOPEGAL-injected MAPT and MAPT/AEP−/− mice. Scale bar is 100 μm. B & C. Quantification of TauK353-DOPEGAL+ (B) and Tau N368+ cells (C). Data are shown as mean ± SEM. n = 6 per group. Two-way ANOVA with Sidak’s multiple comparison. D. AAV-control or AAV-MAO-A was injected into the LC regions of MAPT mice. Neuronal cell death (TUNEL) and DOPEGAL modification (Tau K353-DOPEGAL), cleavage (Tau N368), phosphorylation (AT8), and aggregation (T22) of Tau in the LC were examined by immunofluorescence staining. Scale bar is 100 μm. E. Co-stained positive cells were quantified in the LC of AAV-injected MAPT mice. Data are shown as mean ± SEM. n = 6 per group. Student t-test.
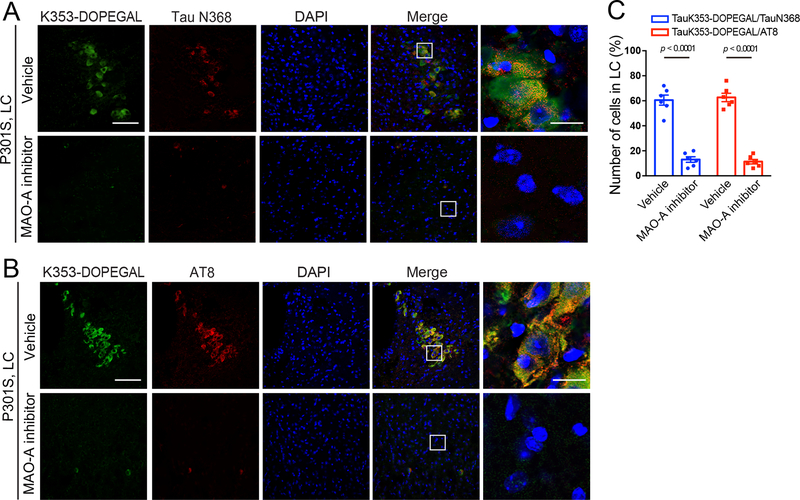
Extended Data Fig. 5. Inhibition of MAO-A reduces DOPEGAL-Tau modification and Tau pathology in P301S mice.
MAO-A inhibitor clorgyline was administered in 3-month-old tau P301S mice for 3 months (3 mg/kg/day). A & B. Representative images of immunofluorescent staining for Tau K353-DOPEGAL (green), Tau N368 (red), and DAPI (blue) (A) and Tau K353-DOPEGAL (green); AT8 (red); DAPI (blue) (B). Scale bars are 100 μm (left) and 20 μm (right). C. Quantification of Tau K353-DOPEGAL/TauN368+ and Tau K353-DOPEGAL/AT8+ cells in the LC sections of vehicle- or clorgyline-treated Tau P301S mice. Data are shown as mean ± SEM. n = 6 mice per group. Student t-test.
Extended Data Fig. 6. Tau K353R mutation blocks tau pathology spreading from the LC to the forebrain in Tau −/− mice.
AAV-control, AAV-Tau, and AAV-Tau K353R were injected into the LC of 3-month-old Tau −/− mice. The mice were assessed for Tau cleavage and phosphorylation 3 months after injection. A & B. Representative images of immunofluorescent staining for Tau K353-DOPEGAL (green); Tau N368 (red); DAPI (blue) (A) and Tau K353-DOPEGAL (green); AT8 (red); DAPI (blue) (B). Scale bars are 100 μm (left) and 20 μm (right). C. Quantification of Tau N368+ and AT8+ cells in the LC sections. Data are shown as mean ± SEM. n = 6 mice per group. Two-way ANOVA with Sidak’s multiple comparison. D. Quantitative PCR demonstrating the expression of human Tau in LC, EC, and HC at 3 months after viral injection. Data are shown as mean ± SEM. n = 4. Two-way ANOVA with Sidak’s multiple comparison. E. Representative images of immunohistochemistry staining for Tau K353-DOPEGAL on the LC, EC, and HC sections at 1 month after AAV-Tau injection into LC of Tau−/− mice. Scale bar is 200 μm. F. K353-DOPEGAL/NeuN or K353-DOPEGAL/DBH immunofluorescent co-staining on the EC or HC of Tau −/− mice. Tau K353-DOPEGAL (green)/NeuN or DBH (red); Tau K353-DOPEGAL (red)/ DBH (green)/DAPI (blue). Scale bar is100 μm. All images of E & F are representatives of three independent experiments with similar results.
Extended Data Fig. 7. Tau PFFs fail to induce tau pathology in Tau−/− mice.
Pre-formed fibrils (PFFs) of Tau or Tau K353R were injected into the LC of 3-month-old Tau −/− mice. The mice were assessed for DOPEGAL modification and phosphorylation of Tau 3 months later. A, B. Representative images of immunofluorescent staining for Tau K353-DOPEGAL (red); DBH (green); DAPI (blue) (A) and Tau K353-DOPEGAL (green); AT8 (red); DAPI (blue) (B). Scale bars are 100 μm (left) and 20 μm (right). C. Quantification of DBH+ cells in the LC sections of PBS, Tau, or Tau K353R PFFs-injected Tau−/− mice. Data are shown as mean ± SEM. n = 8 per group. One-way ANOVA. D. Quantification of Tau K353-DOPEGAL+ and AT8+ cells in the LC sections of PFFs-injected Tau −/− mice. Data are shown as mean ± SEM. n = 6 per group. Two-way ANOVA with Sidak’s multiple comparison.
Supplementary Material
Acknowledgments
We thank the Emory Goizueta Alzheimer’s Disease Research Center for postmortem human AD and healthy control samples. This work was supported by the NIH (R01 AG061175 to SSK and DW), the National Natural Science Foundation of China (No. 81822016 to ZZ), and the National Key Basic Research Program of China Grant (2019YFE0115900 to ZZ). Additional support was provided by the Emory Neuroscience NINDS Core Facilities (P30NS055077). Further support was provided by the Georgia Clinical & Translational Science Alliance of the National Institutes of Health under Award Number UL1TR002378. This study was supported in part by the Rodent Behavioral Core (RBC), Viral Vector Core, and HPLC Bioanalytical Core, which are subsidized by the Emory University School of Medicine and are part of the Emory Integrated Core Facilities.
Footnotes
Competing Interests
The authors have declared that no conflict of interests exists.
Data Availability
The authors declare that all data supporting the findings of this study are available within the article and Source Data files.
References
- 1.Grundke-Iqbal I et al. Abnormal phosphorylation of the microtubule-associated protein tau (tau) in Alzheimer cytoskeletal pathology. Proc Natl Acad Sci U S A 83, 4913–7 (1986). [DOI] [PMC free article] [PubMed] [Google Scholar]
- 2.Braak H & Braak E Neuropathological stageing of Alzheimer-related changes. Acta Neuropathol 82, 239–59 (1991). [DOI] [PubMed] [Google Scholar]
- 3.Arriagada PV, Growdon JH, Hedley-Whyte ET & Hyman BT Neurofibrillary tangles but not senile plaques parallel duration and severity of Alzheimer’s disease. Neurology 42, 631–9 (1992). [DOI] [PubMed] [Google Scholar]
- 4.Cho H et al. Tau PET in Alzheimer disease and mild cognitive impairment. Neurology 87, 375–83 (2016). [DOI] [PubMed] [Google Scholar]
- 5.Weinshenker D Functional consequences of locus coeruleus degeneration in Alzheimer’s disease. Curr Alzheimer Res 5, 342–5 (2008). [DOI] [PubMed] [Google Scholar]
- 6.Chalermpalanupap T et al. Targeting norepinephrine in mild cognitive impairment and Alzheimer’s disease. Alzheimers Res Ther 5, 21 (2013). [DOI] [PMC free article] [PubMed] [Google Scholar]
- 7.Rorabaugh JM et al. Chemogenetic locus coeruleus activation restores reversal learning in a rat model of Alzheimer’s disease. Brain 140, 3023–3038 (2017). [DOI] [PMC free article] [PubMed] [Google Scholar]
- 8.Ressler KJ & Nemeroff CB Role of norepinephrine in the pathophysiology and treatment of mood disorders. Biol Psychiatry 46, 1219–33 (1999). [DOI] [PubMed] [Google Scholar]
- 9.Sara SJ The locus coeruleus and noradrenergic modulation of cognition. Nat Rev Neurosci 10, 211–23 (2009). [DOI] [PubMed] [Google Scholar]
- 10.Herrmann N, Lanct?T KL & Khan LR The role of norepinephrine in the behavioral and psychological symptoms of dementia. Journal of Neuropsychiatry & Clinical Neurosciences 16, 261 (2004). [DOI] [PubMed] [Google Scholar]
- 11.Theofilas P, Dunlop S, Heinsen H & Grinberg LT Turning on the Light Within: Subcortical Nuclei of the Isodentritic Core and their Role in Alzheimer’s Disease Pathogenesis. J Alzheimers Dis 46, 17–34 (2015). [DOI] [PMC free article] [PubMed] [Google Scholar]
- 12.Theofilas P et al. Locus coeruleus volume and cell population changes during Alzheimer’s disease progression: A stereological study in human postmortem brains with potential implication for early-stage biomarker discovery. Alzheimers Dement 13, 236–246 (2017). [DOI] [PMC free article] [PubMed] [Google Scholar]
- 13.Rüb U et al. The Brainstem Tau Cytoskeletal Pathology of Alzheimer’s Disease: A Brief Historical Overview and Description of its Anatomical Distribution Pattern, Evolutional Features, Pathogenetic and Clinical Relevance. Curr Alzheimer Res 13, 1178–97 (2016). [DOI] [PubMed] [Google Scholar]
- 14.Chalermpalanupap T, Schroeder JP, Rorabaugh JM, Liles LC & Lah JJ Locus Coeruleus Ablation Exacerbates Cognitive Deficits, Neuropathology, and Lethality in P301S Tau Transgenic Mice. 38, 74–92 (2018). [DOI] [PMC free article] [PubMed] [Google Scholar]
- 15.Wischik CM, Harrington CR & Storey JM Tau-aggregation inhibitor therapy for Alzheimer’s disease. Biochem Pharmacol 88, 529–39 (2014). [DOI] [PubMed] [Google Scholar]
- 16.Kelly SC et al. Locus coeruleus cellular and molecular pathology during the progression of Alzheimer’s disease. Acta Neuropathol Commun 5, 8 (2017). [DOI] [PMC free article] [PubMed] [Google Scholar]
- 17.Mattammal MB, Strong R, Lakshmi VM, Chung HD & Stephenson AH Prostaglandin H synthetase-mediated metabolism of dopamine: implication for Parkinson’s disease. J Neurochem 64, 1645–54 (1995). [DOI] [PubMed] [Google Scholar]
- 18.Burke WJ 3,4-dihydroxyphenylacetaldehyde: a potential target for neuroprotective therapy in Parkinson’s disease. Curr Drug Targets CNS Neurol Disord 2, 143–8 (2003). [DOI] [PubMed] [Google Scholar]
- 19.Li SW, Lin TS, Minteer S & Burke WJ 3,4-Dihydroxyphenylacetaldehyde and hydrogen peroxide generate a hydroxyl radical: possible role in Parkinson’s disease pathogenesis. Brain Res Mol Brain Res 93, 1–7 (2001). [DOI] [PubMed] [Google Scholar]
- 20.Eisenhofer G, Kopin IJ & Goldstein DS Catecholamine metabolism: a contemporary view with implications for physiology and medicine. Pharmacol Rev 56, 331–49 (2004). [DOI] [PubMed] [Google Scholar]
- 21.Burke WJ et al. Accumulation of 3,4-dihydroxyphenylglycolaldehyde, the neurotoxic monoamine oxidase A metabolite of norepinephrine, in locus ceruleus cell bodies in Alzheimer’s disease: mechanism of neuron death. Brain Res 816, 633–7 (1999). [DOI] [PubMed] [Google Scholar]
- 22.Burke WJ et al. Neurotoxicity of MAO metabolites of catecholamine neurotransmitters: role in neurodegenerative diseases. Neurotoxicology 25, 101–15 (2004). [DOI] [PubMed] [Google Scholar]
- 23.Burke WJ, Kristal BS, Yu BP, Li SW & Lin TS Norepinephrine transmitter metabolite generates free radicals and activates mitochondrial permeability transition: a mechanism for DOPEGAL-induced apoptosis. Brain Res 787, 328–32 (1998). [DOI] [PubMed] [Google Scholar]
- 24.Kristal BS et al. Selective dopaminergic vulnerability: 3,4-dihydroxyphenylacetaldehyde targets mitochondria. Free Radic Biol Med 30, 924–31 (2001). [DOI] [PubMed] [Google Scholar]
- 25.Burke WJ, Schmitt CA, Gillespie KN & Li SW Norepinephrine transmitter metabolite is a selective cell death messenger in differentiated rat pheochromocytoma cells. Brain Res 722, 232–5 (1996). [DOI] [PubMed] [Google Scholar]
- 26.Burke WJ et al. Catecholamine monoamine oxidase a metabolite in adrenergic neurons is cytotoxic in vivo. Brain Res 891, 218–27 (2001). [DOI] [PubMed] [Google Scholar]
- 27.Zhang Z et al. Cleavage of tau by asparagine endopeptidase mediates the neurofibrillary pathology in Alzheimer’s disease. Nat Med 20, 1254–62 (2014). [DOI] [PMC free article] [PubMed] [Google Scholar]
- 28.Zhang Z et al. Delta-secretase cleaves amyloid precursor protein and regulates the pathogenesis in Alzheimer’s disease. Nat Commun 6, 8762 (2015). [DOI] [PMC free article] [PubMed] [Google Scholar]
- 29.Kang SS et al. α-Synuclein stimulation of monoamine oxidase-B and legumain protease mediates the pathology of Parkinson’s disease. Embo j 37(2018). [DOI] [PMC free article] [PubMed] [Google Scholar]
- 30.Kang SS et al. Norepinephrine metabolite DOPEGAL activates AEP and pathological Tau aggregation in locus coeruleus. J Clin Invest 130, 422–437 (2020). [DOI] [PMC free article] [PubMed] [Google Scholar]
- 31.Kang SS et al. ApoE4 inhibition of VMAT2 in the locus coeruleus exacerbates Tau pathology in Alzheimer’s disease. Acta Neuropathol (2021). [DOI] [PMC free article] [PubMed] [Google Scholar]
- 32.Cook C et al. Acetylation of the KXGS motifs in tau is a critical determinant in modulation of tau aggregation and clearance. Hum Mol Genet 23, 104–16 (2014). [DOI] [PMC free article] [PubMed] [Google Scholar]
- 33.Leuzy A et al. Longitudinal tau and metabolic PET imaging in relation to novel CSF tau measures in Alzheimer’s disease. Eur J Nucl Med Mol Imaging 46, 1152–1163 (2019). [DOI] [PMC free article] [PubMed] [Google Scholar]
- 34.Blennow K et al. Cerebrospinal fluid tau fragment correlates with tau PET: a candidate biomarker for tangle pathology. Brain 143, 650–660 (2020). [DOI] [PMC free article] [PubMed] [Google Scholar]
- 35.Zhang Z et al. Asparagine endopeptidase cleaves α-synuclein and mediates pathologic activities in Parkinson’s disease. Nat Struct Mol Biol 24, 632–642 (2017). [DOI] [PMC free article] [PubMed] [Google Scholar]
- 36.Sayre LM, Smith MA & Perry G Chemistry and biochemistry of oxidative stress in neurodegenerative disease. Curr Med Chem 8, 721–38 (2001). [DOI] [PubMed] [Google Scholar]
- 37.Marchitti SA, Deitrich RA & Vasiliou V Neurotoxicity and metabolism of the catecholamine-derived 3,4-dihydroxyphenylacetaldehyde and 3,4-dihydroxyphenylglycolaldehyde: the role of aldehyde dehydrogenase. Pharmacol Rev 59, 125–50 (2007). [DOI] [PubMed] [Google Scholar]
- 38.Tuma DJ, Donohue TM Jr., Medina VA & Sorrell MF Enhancement of acetaldehyde-protein adduct formation by L-ascorbate. Arch Biochem Biophys 234, 377–81 (1984). [DOI] [PubMed] [Google Scholar]
- 39.Cheng Y & Bai F The Association of Tau With Mitochondrial Dysfunction in Alzheimer’s Disease. Front Neurosci 12, 163 (2018). [DOI] [PMC free article] [PubMed] [Google Scholar]
- 40.Mandelkow EM, Stamer K, Vogel R, Thies E & Mandelkow E Clogging of axons by tau, inhibition of axonal traffic and starvation of synapses. Neurobiol Aging 24, 1079–85 (2003). [DOI] [PubMed] [Google Scholar]
- 41.Hu Y et al. Tau accumulation impairs mitophagy via increasing mitochondrial membrane potential and reducing mitochondrial Parkin. Oncotarget 7, 17356–68 (2016). [DOI] [PMC free article] [PubMed] [Google Scholar]
- 42.Li XC et al. Human wild-type full-length tau accumulation disrupts mitochondrial dynamics and the functions via increasing mitofusins. Sci Rep 6, 24756 (2016). [DOI] [PMC free article] [PubMed] [Google Scholar]
- 43.Jucker M & Walker LC Pathogenic protein seeding in Alzheimer disease and other neurodegenerative disorders. Ann Neurol 70, 532–40 (2011). [DOI] [PMC free article] [PubMed] [Google Scholar]
- 44.Gibbons GS, Lee VMY & Trojanowski JQ Mechanisms of Cell-to-Cell Transmission of Pathological Tau: A Review. JAMA Neurol 76, 101–108 (2019). [DOI] [PMC free article] [PubMed] [Google Scholar]
- 45.Bell BJ, Malvankar MM, Tallon C & Slusher BS Sowing the Seeds of Discovery: Tau-Propagation Models of Alzheimer’s Disease. ACS Chem Neurosci 11, 3499–3509 (2020). [DOI] [PMC free article] [PubMed] [Google Scholar]
- 46.Asai H et al. Depletion of microglia and inhibition of exosome synthesis halt tau propagation. Nat Neurosci 18, 1584–93 (2015). [DOI] [PMC free article] [PubMed] [Google Scholar]
- 47.Wegmann S et al. Removing endogenous tau does not prevent tau propagation yet reduces its neurotoxicity. EMBO J 34, 3028–41 (2015). [DOI] [PMC free article] [PubMed] [Google Scholar]
- 48.Heneka MT et al. Locus ceruleus degeneration promotes Alzheimer pathogenesis in amyloid precursor protein 23 transgenic mice. J Neurosci 26, 1343–54 (2006). [DOI] [PMC free article] [PubMed] [Google Scholar]
- 49.Hammerschmidt T et al. Selective loss of noradrenaline exacerbates early cognitive dysfunction and synaptic deficits in APP/PS1 mice. Biol Psychiatry 73, 454–63 (2013). [DOI] [PMC free article] [PubMed] [Google Scholar]
- 50.Weinshenker D Long Road to Ruin: Noradrenergic Dysfunction in Neurodegenerative Disease. Trends Neurosci 41, 211–223 (2018). [DOI] [PMC free article] [PubMed] [Google Scholar]
- 51.Heneka MT et al. Locus ceruleus controls Alzheimer’s disease pathology by modulating microglial functions through norepinephrine. Proc Natl Acad Sci U S A 107, 6058–63 (2010). [DOI] [PMC free article] [PubMed] [Google Scholar]
- 52.Yu K et al. High-Throughput Profiling of Proteome and Posttranslational Modifications by 16-Plex TMT Labeling and Mass Spectrometry. Methods Mol Biol 2228, 205–224 (2021). [DOI] [PMC free article] [PubMed] [Google Scholar]
- 53.Ma B et al. PEAKS: powerful software for peptide de novo sequencing by tandem mass spectrometry. Rapid Commun Mass Spectrom 17, 2337–42 (2003). [DOI] [PubMed] [Google Scholar]
- 54.Yu K et al. High-Throughput Profiling of Proteome and Posttranslational Modifications by 16-Plex TMT Labeling and Mass Spectrometry. Methods Mol Biol 2228, 205–224 (2021). [DOI] [PMC free article] [PubMed] [Google Scholar]
- 55.Ma B et al. PEAKS: powerful software for peptide de novo sequencing by tandem mass spectrometry. Rapid Commun Mass Spectrom 17, 2337–42 (2003). [DOI] [PubMed] [Google Scholar]
Associated Data
This section collects any data citations, data availability statements, or supplementary materials included in this article.
Supplementary Materials
Data Availability Statement
The authors declare that all data supporting the findings of this study are available within the article and Source Data files.


