Abstract
Placental protein-13 (PP-13) is a member of the galectin group involved in placental implantation, maternal artery remodeling, and placental inflammatory processes. Its levels are lower in the first trimester for pregnancies later affected by ischemic placental disease, and slowly increase during the second and third trimesters of pregnancy. The aim of the present meta-analysis is to assess the predictive performance of PP-13 in first trimester preeclampsia screening. PubMed, Web of Science, Scopus, Embase, BIOSIS, and Cochrane databases were used to find relevant studies. All prospective and retrospective observational studies that evaluated the accuracy of PP-13 in predicting preeclampsia were assessed. The investigation revealed that the quantitative synthesis was based on 14 studies with a total number of 8,239 women. The pooled sensitivity of PP-13 for the prediction of preeclampsia was 0.53 [95% (confidence interval (CI), 0.08-0.99], and the pooled specificity was 0.83 (95% CI, 0.38-1.29). Further analysis revealed a higher accuracy of PP-13 for the screening of late-onset preeclampsia [pooled sensitivity of 0.58 [95% CI, -0.17-1.33) with a specificity of 0.85 (95% CI, 0.10-1.60)] when compared with early-onset preeclampsia [pooled sensitivity of 0.51 (95% CI, -0.04-1.05) with a specificity of 0.88 (95% CI, 0.33-1.42)]. In conclusion, PP-13 appears to be a promising biomarker for evaluating the risk of developing preeclampsia during the first trimester of pregnancy. As a result, incorporating it into future predictive models is a viable option.
Keywords: preeclampsia, screening, first trimester, PP-13, galectin-13
Introduction
Preeclampsia (PE) is a form of ischemic placental disease and its physiopathology remains unclear, although recent advances have been made in increasing its understanding. Despite being a rare disorder, which affects between 2-10% of pregnant women, PE is still a significant cause of maternal and perinatal morbidity and mortality (1).
Galectins are carbohydrate-binding proteins that control cell growth, proliferation, differentiation, apoptosis, signal transduction, mRNA splicing, and extracellular matrix interactions (2). To date, approximately 20 members of the galectin family have been identified, and one in particular, protein-galectin-13 or placental protein-13 (PP-13), has gained recognition as an important factor in the pathogenesis of preeclampsia (3). It seems that PP-13 is involved in deep placentation, vascular remodeling and immune tolerance (4). Therefore, the background for its use in preeclampsia screening with or without intrauterine growth restriction has been proposed.
In the present systematic review and meta-analysis, we aimed to assess the predictive performance of PP-13 for preeclampsia screening in the first trimester of pregnancy.
Research methods
From the onset of each database through March 14, 2021, we conducted a comprehensive manual and electronic search using the Preferred Reporting Items for Systematic Reviews and Meta-Analyses guidelines (PRISMA) to discover literature on the predictive value of PP-13 in preeclampsia (5).
PubMed, Web of Science, Scopus, Embase, BIOSIS, and Cochrane Library were used (6-11). ‘Preeclampsia’, ‘first trimester’, ‘screening’, ‘placental protein 13’, ‘PP-13’, and ‘galectin-13’ were employed as medical topic headings (MeSH) or key words, which were combined with Boolean operators AND and OR. There were no restrictions on the type of study or the language used. The bibliographies of the selected publications were rechecked to ensure that all relevant studies were included. The inclusion criteria (summarized in Table I) were: observational studies, such as cross-sectional, case-control, or cohort studies that analyzed the predictive performance of PP-13 in the first trimester of pregnancy; studies published until March 2021. Studies that did not fulfill the abovementioned criteria were excluded from our review.
Table I.
Inclusion criteria of the studies.
| Study design | Observational study with a well-defined study population |
|---|---|
| Source | Peer-reviewed journals |
| Language | Any |
| Disease | Preeclampsia |
| Sample type | Blood, serum, or plasma |
| Gestational age | First trimester |
| Assay type | Any |
| Onset of preeclampsia | Any (early or late) |
| Sample size | ≥50 |
The full-text papers were independently reviewed by two physician investigators (DN and IAV) to establish their eligibility for the review. Any differences between the two were remedied through conversation. A third reviewer (AC) added a casting vote if a consensus could not be reached.
Two reviewers (DN and IAV) retrieved data from the eligible studies separately using a standard process. Most of the published research used various cut-offs to assess the level of PP-13 at various gestational ages. Data concerning the first author, publication year, study design, characteristics of the population examined, number of cases and controls, gestational age at sampling, cut-offs used, test kits, and the information needed to create a 2x2 table were obtained.
Two independent reviewers assessed the methodological quality of the included studies using the QUADAS-2 technique (Quality Assessment of Diagnostic Accuracy Studies-2) (12,13).
The number of pregnant women with true-positive, true-negative, false-positive, and false-negative test results were retrieved from all of the studies. A 2x2 diagnosis table was created by calculating the accuracy measures, the illness prevalence, and the sample size stated in the study. Each study's sensitivity, specificity, positive, and negative probability ratios were determined using a 95% confidence interval (CI).
For hierarchical modeling, a hierarchical summary receiver operating characteristic (HSROC) model was utilized to generate equal summary estimates for sensitivity and specificity, taking into account variability both between and within studies (heterogeneity) (random sampling error). The Der Simonian-Laird approach was used to estimate random effects (14). The Q test was used to assess statistical heterogeneity among the studies, and the I2 statistic was used to measure the degree of heterogeneity.
The area under the summary receiver operating characteristic curve (AUC) was determined using the accuracy data from all the included investigations, which were plotted on a summary receiver operating characteristic SROC with sensitivity on the x-axis and specificity on the y-axis. This is the same as the summary diagnostic odds ratio (OR), which measures the strength of the link between the test and the disease. The random-effects model was adopted because of the expected clinical and statistical heterogeneity among the trials. StataMP 16.0 (StataCorp) was used to statistically analyze all of the data.
Results
A total of 82 studies were identified. After screening the titles and abstracts, the systematic review and meta-analysis comprised 14 studies (15-28) (Fig. 1).
Figure 1.
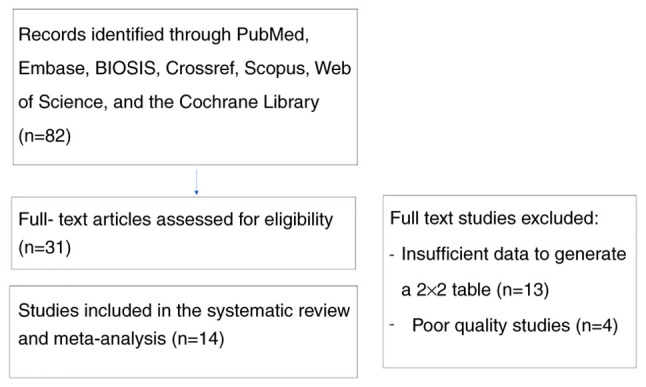
Search strategy and study selection.
The quality assessment of these studies is summarized in Table II. In most of the studies, there was good reporting with a prospective design, consecutive recruitment, adequate description of the selection criteria, patient spectrum, test, and use of appropriate reference standards.
Table II.
Quality analysis of the included studies.
| Risk of bias | Applicability concerns | ||||||
|---|---|---|---|---|---|---|---|
| Authors of the study (Refs.) | Patient selection | Index test | Reference standard | Flow and timing | Patient selection | Index test | Reference standard |
| Spencer et al (15) | Low risk | Low risk | Low risk | Low risk | Low risk | Low risk | Low risk |
| Chafetz et al (16) | Low risk | Low risk | Low risk | Low risk | Low risk | Low risk | Low risk |
| Gonen et al (17) | Low risk | High risk | Low risk | Low risk | Low risk | Low risk | Low risk |
| Khalil et al (18) | Low risk | High risk | Low risk | Low risk | Low risk | Low risk | Low risk |
| Akolekar et al (19) | Low risk | Unclear risk | Low risk | Low risk | Low risk | Low risk | Low risk |
| Khalil et al (20) | Low risk | Unclear risk | Low risk | Low risk | Low risk | Unclear risk | Low risk |
| Wortelboer et al (21) | Low risk | Unclear risk | Low risk | Low risk | Low risk | Low risk | Low risk |
| Odibo et al (22) | Low risk | Unclear risk | Low risk | Low risk | Low risk | Unclear risk | Low risk |
| Schneuer et al (23) | Low risk | Unclear risk | Low risk | Low risk | Low risk | Low risk | Low risk |
| Deurloo et al (24) | Low risk | Unclear risk | Low risk | High risk | Low risk | Low risk | Low risk |
| Meiri et al (25) | Low risk | Unclear risk | Low risk | High risk | Low risk | Low risk | Low risk |
| Luo and Han (26) | Low risk | Unclear risk | Low risk | High risk | Low risk | Low risk | Low risk |
| Asiltas et al (27) | Low risk | Unclear risk | Low risk | High risk | Low risk | Low risk | Low risk |
| Soongsatitanon and Phupong (28) | Low risk | Unclear risk | Low risk | High risk | Low risk | Low risk | Low risk |
Early-(EO-PE) or late-onset (LO-PE) preeclampsia and preeclampsia associated with small for gestational age fetuses (PE-SGA) were considered separate study groups and studied individually. Table III summarizes the study characteristics.
Table III.
Characteristics of the included studies.
| Authors of the study (Refs.) | Year | Country | Study design | Characteristics of the population | Disease endpoint | Sample type | Assay used | age (week) | Gestational Cases (n) | Controls (n) |
|---|---|---|---|---|---|---|---|---|---|---|
| Spencer et al (15) | 2006 | UK | Prospective | Screening in ANC | All PE, EO-PE | Serum | ELISA | 11-13+6 | All PE (88) EO-PE (44) | 446 |
| Chafetz et al (16) | 2007 | USA | Prospective | Screening in ANC | All PE | Serum | ELISA | 9-12 | 47 | 290 |
| Gonen et al (17) | 2008 | Israel | Prospective | Screening in ANC | All PE, EO-PE, LO-PE | Serum | ELISA | 6-10 | All PE (20) EO-PE (5) LO-PE (5) | 1,178 |
| Khalil et al (18) | 2009 | UK | Prospective | Women with high risk of PE | EO-PE, term and preterm PE | Serum | ELISA | 11-13+6 | EO-PE (14) Preterm PE (36) Term PE (6) | 210 |
| Akolekar et al (19) | 2009 | UK | Prospective | Screening in ANC | EO-PE | Serum | DELFIA | 11-13+6 | 48 | 416 |
| Khalil et al (20) | 2010 | UK | Prospective | Women with high risk of PE | All PE, EO-PE, PE+SGA | Serum | ELISA | 11-13+6 | All PE (42) EO-PE (14) PE+SGA (13) | 210 |
| Wortelboer et al (21) | 2010 | The Netherlands | Prospective | Screening in ANC | EO-PE | Serum | DELFIA | 8-13+6 | 45 | 480 |
| Odibo et al (22) | 2011 | USA | Prospective | Screening in ANC | All PE, EO-PE | Serum | DELFIA | 11-14 | All PE (42) EO-PE-12 | 410 |
| Schneuer et al (23) | 2012 | Australia | Prospective | Screening in ANC | All PE, EO-PE | Serum | DELFIA | 10-14 | All PE (71) EO-PE (5) | 2,423 |
| Deurloo et al (24) | 2013 | Amsterdam | Retrospective | Screeening in ANC | All PE | Serum | ELISA | 9-13+6 | 17 | 165 |
| Meiri et al (25) | 2014 | Israel | Prospective | Screening in ANC | All PE | Serum | ELISA | 8-14 | 63 | 757 |
| Luo and Han (26) | 2017 | China | Prospective | Screening in ANC | All PE | Serum | ELISA | 9-13+6 | 33 | 71 |
| Asiltas et al (27) | 2018 | Turkey | Prospective | Screening in ANC | All PE | Serum | ELISA | 11-13+6 | 38 | 122 |
| Soongsatitanon and Phupong (28) | 2020 | Thailand | Prospective | Screening in ANC | All PE | Serum | ELISA | 11-13+6 | 29 | 324 |
ALL-PE, all types of preeclampsia; EO-PE, early-onset preeclampsia; LO-PE, late-onset preeclampsia; SGA, small for gestational age; ANC, antenatal clinic.
The 14 publications studied were published between 2006 and 2020 and were worldwide, with no preference for one region. The meta-analysis included a total of 737 cases of preeclampsia and 7,502 controls.
The mean value of PP-13 expressed in multiples of median (MoM) and standard deviation was 0.92±0.95 for all preeclampsia group, 0.62±0.22 for the early-onset preeclampsia (EO-PE) group, and 0.5±0.19 for the late-onset preeclampsia (LO-PE) or small for gestational age and preeclampsia group (PE + SGA) group, respectively. No statistically significant difference was observed between the groups regarding the cut-off value of PP-13 (P=0.414). The accuracy of the test in the various studies is tabulated in Table IV.
Table IV.
Diagnostic accuracy of PP-13 for the prediction of PE in the various studies.
| Authors of the study (Refs.) | Year | Type of PE | LR(+) | LR(-) | DOR |
|---|---|---|---|---|---|
| Spencer et al (15) | 2006 | All PE | 2.22 | 0.70 | 3.19 |
| Chafetz et al (16) | 2007 | All PE | 7.87 | 0.24 | 33.30 |
| Khalil et al (18) | 2009 | All PE | 6.90 | 0.34 | 20.08 |
| Odibo et al (22) | 2011 | All PE | 6.35 | 0.73 | 8.74 |
| Odibo et al (22) | 2011 | All PE | 4.52 | 0.61 | 7.43 |
| Odibo et al (22) | 2011 | All PE | 2.50 | 0.63 | 4.00 |
| Schneuer et al (23) | 2012 | All PE | 3.10 | 0.89 | 3.49 |
| Deurloo et al (24) | 2013 | All PE | 1.18 | 0.96 | 1.23 |
| Meiri et al (25) | 2014 | All PE | 3.69 | 0.26 | 14.02 |
| Meiri et al (25) | 2014 | All PE | 5.22 | 0.53 | 9.86 |
| Luo and Han (26) | 2017 | All PE | 3.07 | 0.49 | 6.26 |
| Asiltas et al (27) | 2018 | All PE | 9.10 | 0.12 | 77.92 |
| Soongsatitanon and Phupong (28) | 2020 | All PE | 1.51 | 0.73 | 2.06 |
| Spencer et al (15) | 2006 | EO-PE | 2.51 | 0.62 | 4.01 |
| Gonen et al (17) | 2008 | EO-PE | 3.99 | 0.25 | 15.97 |
| Gonen et al (17) | 2009 | EO-PE | 7.14 | 0.32 | 22.50 |
| Khalil et al (20) | 2010 | EO-PE | 6.43 | 0.40 | 16.20 |
| Akolekar et al (19) | 2009 | EO-PE | 4.13 | 0.83 | 4.95 |
| Akolekar et al (19) | 2009 | EO-PE | 3.71 | 0.70 | 5.34 |
| Wortelboer et al (21) | 2010 | EO-PE | 4.89 | 0.80 | 6.15 |
| Wortelboer et al (21) | 2010 | EO-PE | 4.00 | 0.67 | 6.00 |
| Odibo et al (22) | 2011 | EO-PE | 3.75 | 0.31 | 12.00 |
| Schneuer et al (23) | 2012 | EO-PE | 4.00 | 0.84 | 4.76 |
| Spencer et al (15) | 2006 | LO-PE/PE + SGA | 1.94 | 0.77 | 2.53 |
| Gonen et al (17) | 2008 | LO-PE/PE + SGA | 3.99 | 0.25 | 15.97 |
| Khalil et al (18) | 2009 | LO-PE/PE + SGA | 5.00 | 0.56 | 9.00 |
| Khalil et al (18) | 2009 | LO-PE/PE + SGA | 6.11 | 0.43 | 14.14 |
| Khalil et al (20) | 2010 | LO-PE/PE + SGA | 6.15 | 0.43 | 14.40 |
All-PE, all types of preeclampsia; EO-PE, early onset preeclampsia; LO-PE, late onset preeclampsia; PE + SGA, preeclampsia and small for gestational age; LR(+), positive likelihood ratio; LR(-), negative likelihood ratio; DOR, diagnostic odds ratio.
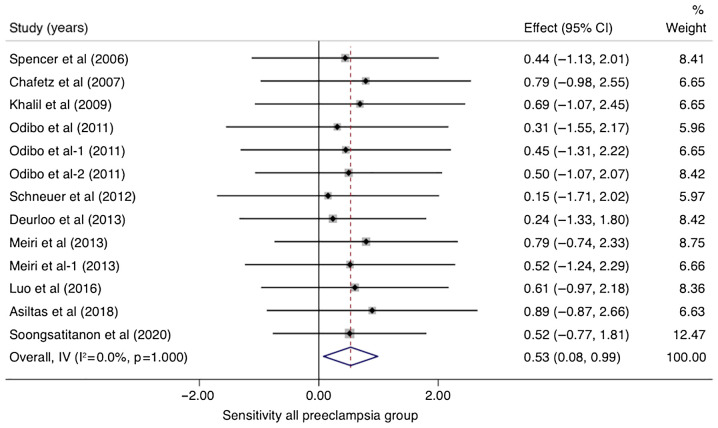
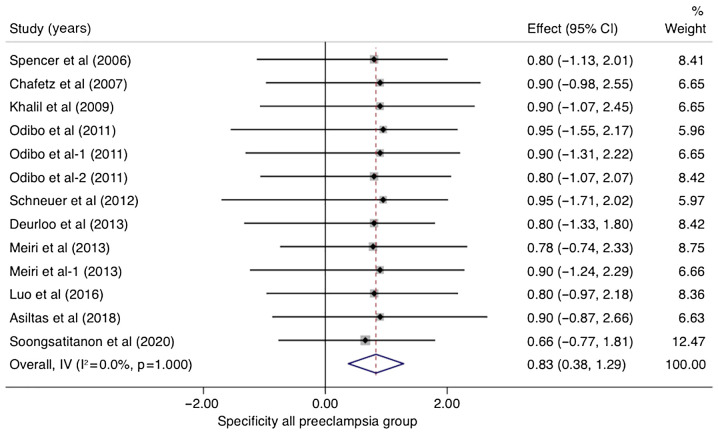
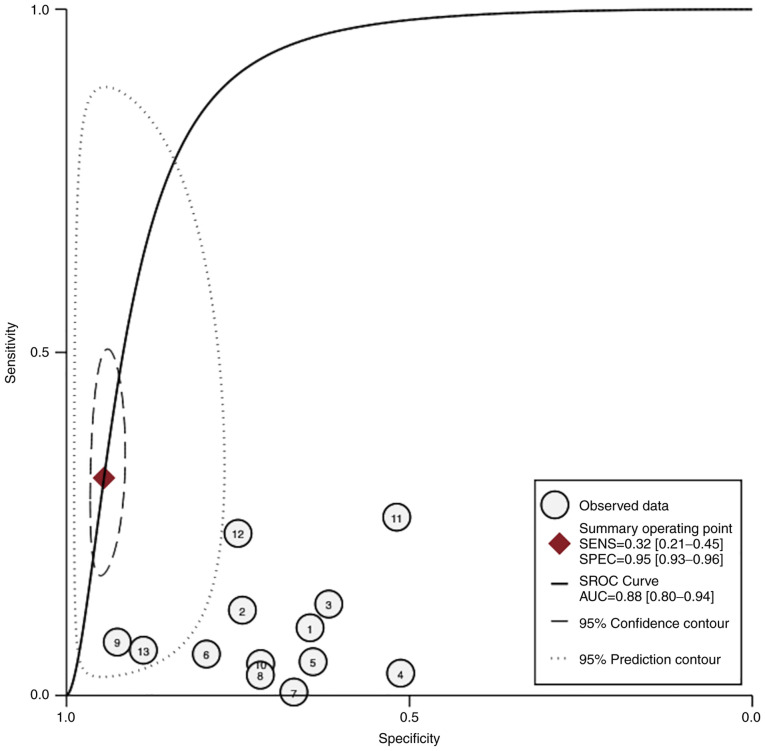
In studies that analyzed women with PE without sub-classifying the population into EO-PE and LO-PE (n=10), the pooled sensitivity of PP-13 was 0.53 (95% CI, 0.08-0.99, I2 0.0%) and the pooled specificity of PP-13 was 0.83 (95% CI, 0.38-1.29, I2 0.0%) (Figs. 2 and 3). The summary receiver operating characteristic curve (SROC) was 0.88 (95% CI, 0.80-0.94) (Fig. 4).
Figure 2.
Forrest plot indicates the pooled sensitivity of placental protein-13 (PP-13) for the all preeclampsia group. CI, confidence interval.
Figure 3.
Forrest plot indicates the pooled specificity of placental protein-13 (PP-13) for all preeclampsia group. CI, confidence interval.
Figure 4.
HSROC curve of the sensitivity vs. specificity of the placental protein-13 (PP-13) for the preeclampsia prediction in all types of preeclampsia (ALL-PE) group. The straight line represents the curve. Each of the analyzed studies is represented by a circle. The square represents the point estimate to which summary sensitivity and specificity correspond, and the respective 95% CI is represented by the dashed line, whereas the dotted line represents the 95% confidence area in which a new study will be located. CI, confidence interval; AUC, area under the curve; HSROC, hierarchical summary receiver operating characteristic curve.
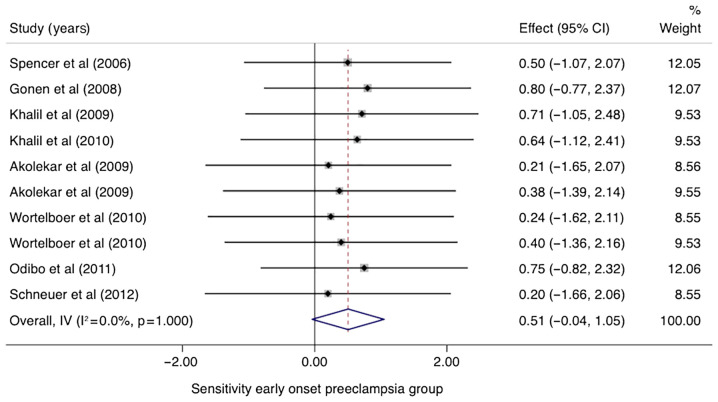
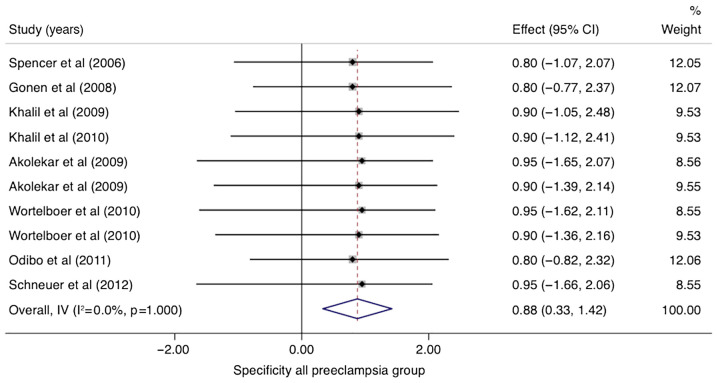
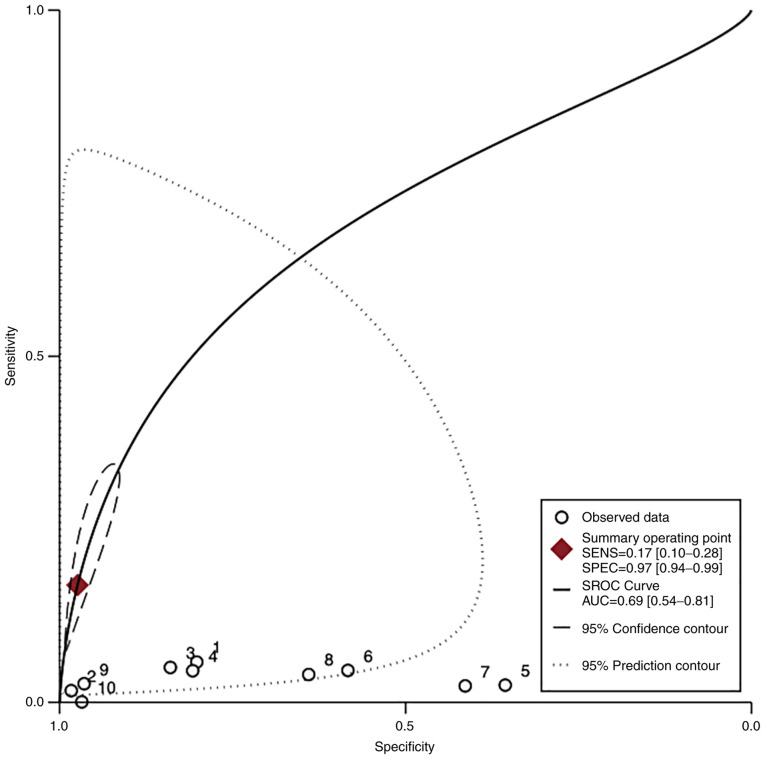
In the group of studies that categorized EO-PE separately, the pooled sensitivity of PP-13 was 0.51 (95% CI, -0.04-1.05, I2 0.0%) with a specificity of 0.88 (95% CI, 0.33-1.42, I2 0.0%) (Figs. 5 and 6). The area under the SROC was 0.69 (95% CI, 0.54-0.81) (Fig. 7).
Figure 5.
Forrest plot indicates the pooled sensitivity of placental protein-13 (PP-13) for the early-onset preeclampsia (EO-PE) group. CI, confidence interval.
Figure 6.
Forrest plot indicates the pooled specificity of placental protein-13 (PP-13) for the early-onset preeclampsia (EO-PE) group. CI, confidence interval.
Figure 7.
HSROC curve of the sensitivity vs. specificity of the placental protein-13 (PP-13) for the preeclampsia prediction in the early-onset preeclampsia (EO-PE) group. The straight line represents the curve. Each of the analyzed studies is represented by a circle. The square represents the point estimate to which summary sensitivity and specificity correspond, and the respective 95% CI is represented by the dashed line, whereas the dotted line represents the 95% confidence area in which a new study will be located. CI, confidence interval; AUC, area under the curve; HSROC, hierarchical summary receiver operating characteristic curve.
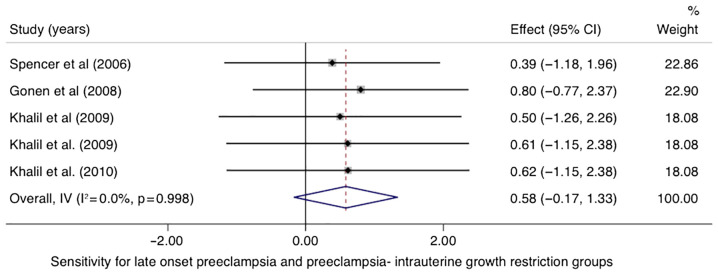
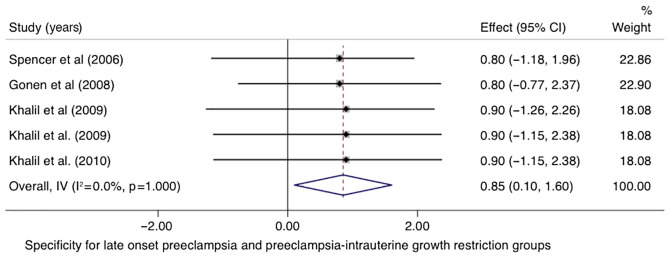
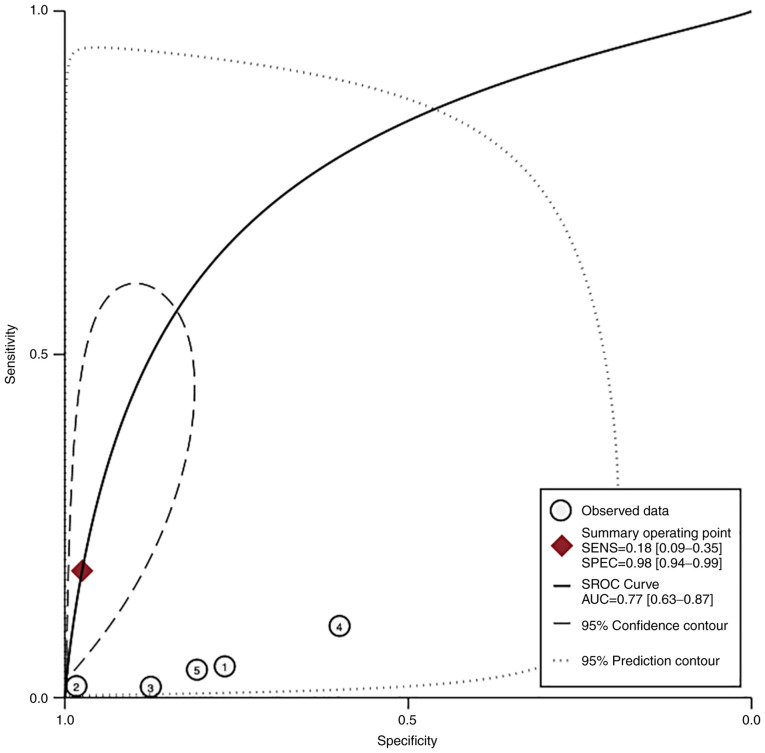
In the LO-PE/PE + SGA groups, the pooled sensitivity of PP-13 was 0.58 (95% CI, -0.17-1.33, I2 0.0%) with a specificity of 0.85 (95% CI, 0.10-1.60, I2 0.0%) (Figs. 8 and 9). The area under the SROC was 0.77 (95% CI, 0.63-0.87) (Fig. 10).
Figure 8.
Forrest plot indicates the pooled sensitivity of the placental protein-13 (PP-13) for the late onset preeclampsia (LO-PE) or combined preeclampsia and small for the gestational age (PE-SGA) group. CI, confidence interval.
Figure 9.
Forrest plot indicates the pooled specificity of the placental protein-13 (PP-13) for the late onset preeclampsia (LO-PE) or combined preeclampsia and small for the gestational age (PE-SGA) group. CI, confidence interval.
Figure 10.
HSROC curve of the sensitivity vs. specificity of the placental protein-13 (PP-13) for the preeclampsia prediction, in the late onset preeclampsia (LO-PE) or combined preeclampsia and small for the gestational age (PE-SGA). The straight line represents the curve. Each of the analyzed studies is represented by a circle. The square represents the point estimate to which summary sensitivity and specificity correspond, and the respective 95% CI is represented by the dashed line, whereas the dotted line represents the 95% confidence area in which a new study will be located. CI, confidence interval; AUC, area under the curve; HSROC, hierarchical summary receiver operating characteristic curve.
According to the Fagan nomogram, for a given pre-test probability of 25% for the preeclampsia group, the post-test probability was 66 and 19% for positive and negative PP-13 biomarker readings, respectively (Fig. 11).
Figure 11.
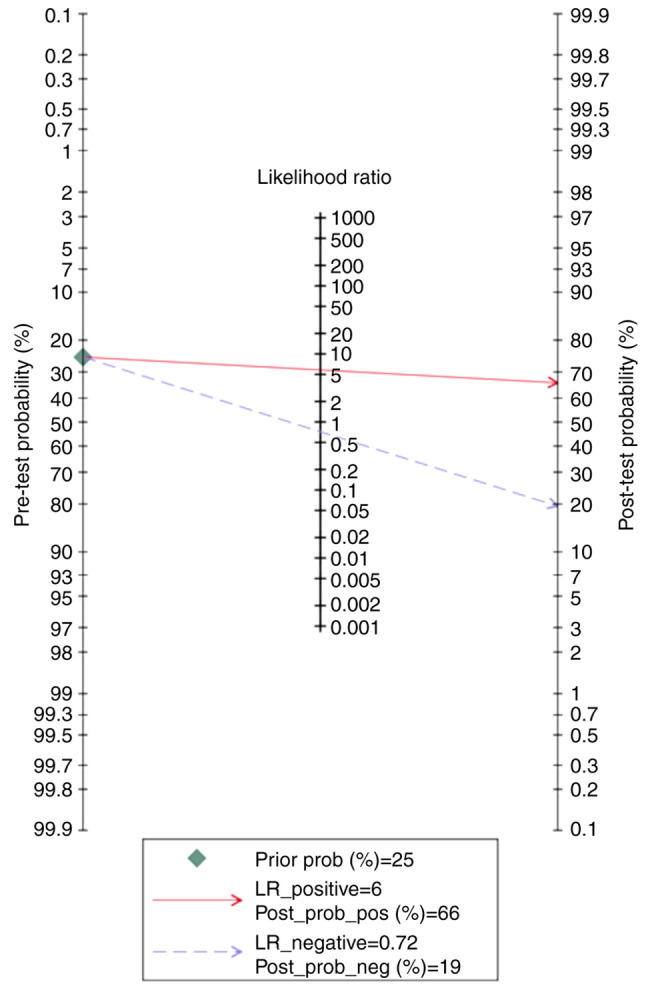
Fagan nomogram of the placental protein-13 (PP-13) for prediction of preeclampsia in the all preeclampsia (ALL-PE) group showing positive (upper line) and negative (lower line) post-test probability results. LR, likelihood ratio.
According to the Fagan nomogram, the positive and negative results of the PP-13 biomarker had a post-test probability of 69 and 22%, respectively, for the specified pre-test probability of 25% for the EO-PE group (Fig. 12).
Figure 12.
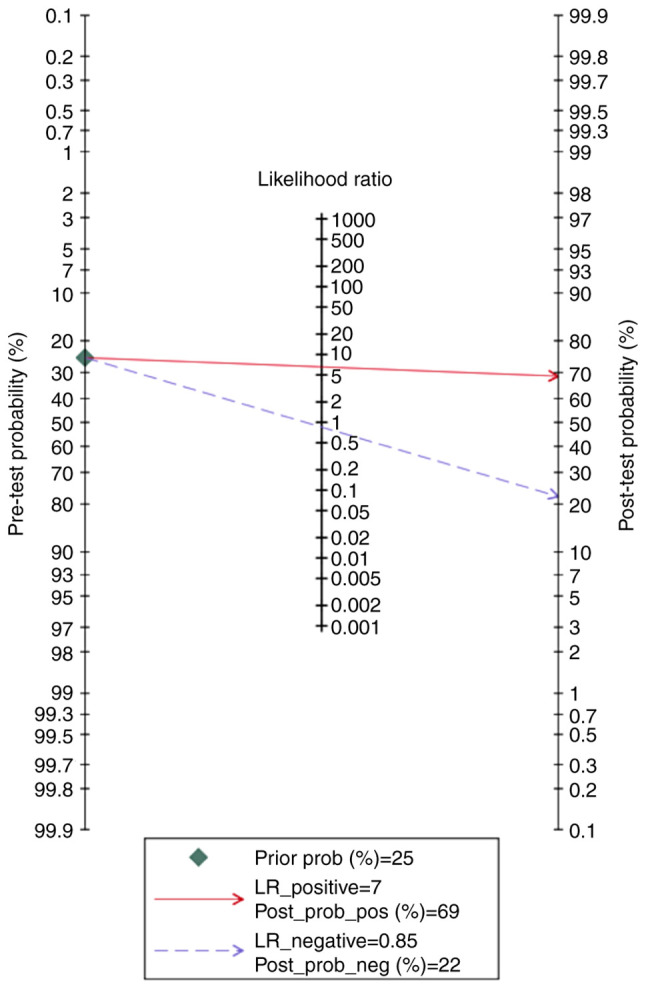
Fagan nomogram of the placental protein-13 (PP-13) for prediction of preeclampsia in the early onset preeclampsia (EO-PE) group showing positive (upper line) and negative (lower line) post-test probability results. LR, likelihood ratio.
Finally, the Fagan nomogram revealed that, for a given pre-test probability of 25% for the LO-PE/PE + SGA groups, the post-test probability for positive and negative PP-13 biomarker values was 71 and 22%, respectively (Fig. 13).
Figure 13.
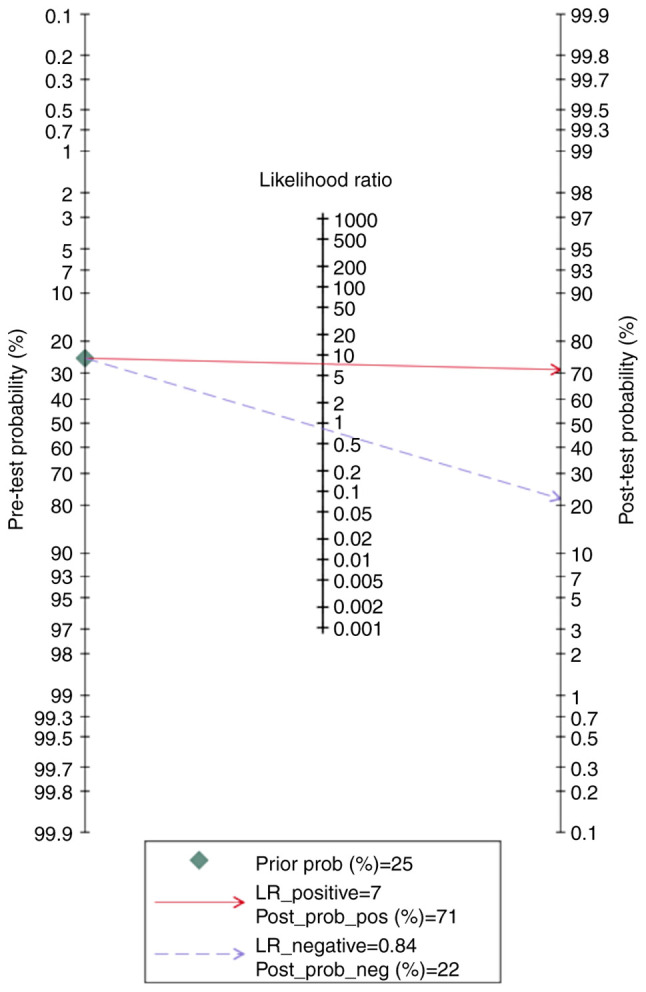
Fagan nomogram of the placental protein-13 (PP-13) for prediction of preeclampsia in the late onset preeclampsia (LO-PE) or combined preeclampsia and small for the gestational age (PE-SGA) showing positive (upper line) and negative (lower line) post-test probability results. LR, likelihood ratio.
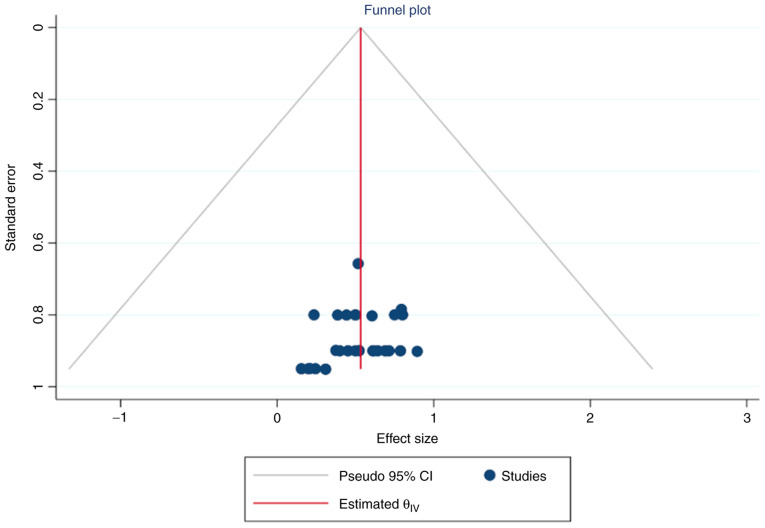
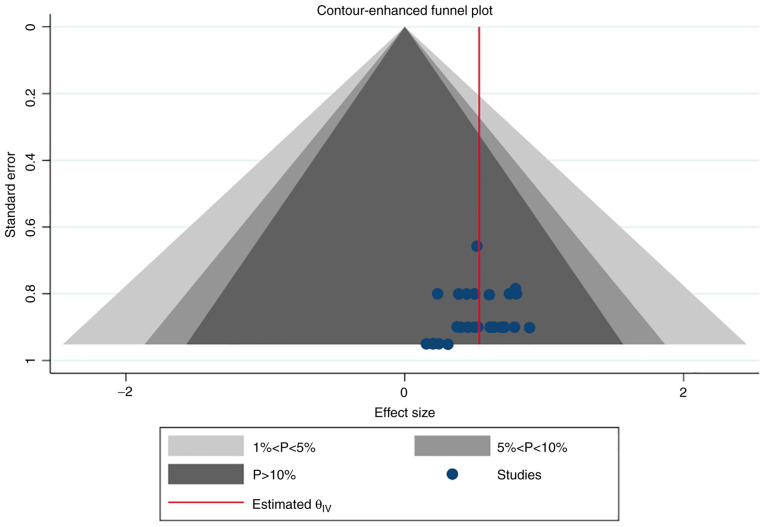
Simple and contour-enhanced funnel plots did not indicate a risk of publication bias (Figs. 14 and 15).
Figure 14.
Simple funnel plot of publication biases on placental protein-13 (PP-13) for preeclampsia screening. CI, confidence interval.
Figure 15.
Contour-enhanced funnel plot of publication biases on placental protein-13 (PP-13) for preeclampsia screening.
Discussion
Preeclampsia is a multisystem condition with a complex etiology. As a consequence, much research has been conducted to identify the women at risk to improve pregnancy outcomes. Clinical criteria alone, such as previous medical and obstetric history, are ineffective in predicting the condition (29). Therefore, it is important to develop integrative algorithms to predict preeclampsia. These include the use of novel biomarkers, sonographic features, and maternal characteristics to obtain higher detection rates.
Protein-galectin-13 or placental protein-13 (PP-13), a protein linked to cell differentiation and inflammatory processes in the placenta, seems to be an effective biomarker for preeclampsia screening (16,30).
This work is the first meta-analysis that offers an overview of the discriminatory performance and predictive capacity of the PP-13 biomarker for first trimester preeclampsia screening.
A total of 14 studies met the inclusion criteria and were subjected to quality testing using the QUADAS-2 tool. Our results demonstrated good overall test accuracy in disease prediction. Given the sensitivity and specificity of this marker, the findings of this meta-analysis showed that maternal PP-13 concentration was lower in preeclampsia and could serve as a valuable diagnostic marker (0.53 and 0.83, respectively).
The diagnostic accuracies in the various subgroups further highlight the importance of PP-13 in preeclampsia. Studies have demonstrated that the two forms of preeclampsia, early-onset preeclampsia (EO-PE) and late-onset preeclampsia (LO-PE), have different physiopathological backgrounds. EO-PE manifests secondary to poor placentation, while LO-PE appears to be a placental malperfusion, caused by limited uterine vascular capacity (31).
It is the EO-PE disease that contributes most to perinatal morbidity, mortality and long-term maternal complications, and therefore numerous efforts are put into its recognition.
Our meta-analysis demonstrated that the predictive performance of PP-13 in LO-PE was higher, although not statistically significant, than that of EO-PE, indicating a good screening performance of this biomarker for both forms of the disease. Moreover, PP-13 had a good negative post-test probability for all included groups (preeclampsia group, 19%; EO-PE group, 22%; LO-PE/PE + SGA group, 22%).
The predictive performance of PP-13 could be increased when using this biomarker in conjunction with maternal characteristics and uterine artery Doppler parameters as shown by previous studies (28,32).
Studies linking PP-13 to fetal growth restriction (FGR) and oxidative stress indices in preeclamptic women suggest the importance of PP-13 as a biomarker of poor placentation throughout the prenatal period. In our meta-analysis, the summary receiver operating characteristic curve (SROC) for the LO-PE and the preeclampsia associated with small for gestational age fetuses (PE-SGA) groups was 0.77.
Our meta-analysis has several limitations. Because the results of our analysis were based mostly on case-control and retrospective studies that examined PP-13 serum levels, the possibility of selection bias must be considered. Furthermore, as PP-13 serum levels were assessed during the first trimester of pregnancy, its prognostic usefulness during the second and third trimesters remains unknown.
The present meta-analysis could serve as a pilot for future research as it provides substantial evidence that can be employed in the design of future studies, especially when it comes to assessing the predictive accuracy of the various cut-offs that have been offered to date. This way, the possibility of bias will be reduced, and comparable results will be produced, allowing for the generalization of findings. PP-13 should be investigated in multivariate models alongside other emerging biomarkers to develop algorithms for providing the best predictive efficacy.
PP-13 could be used as a promising biomarker in preeclampsia screening from the first trimester of pregnancy. Compared to EO-PE, its predictive performance seems better for LO-PE, but the difference between the two was not found to be statistically significant. Because the current data is based on first-trimester readings, more research is needed to determine its prognostic accuracy later in pregnancy.
Given this information, more well-designed prospective studies are needed to shed light on patient phenotypes that appear to demonstrate the most noticeable differences (those with severe, early-onset preeclampsia and those who are prone to developing eclampsia).
The inclusion of PP-13 in predictive models with existing biomarkers could aid in determining its potential additional value in predicting disease and the severity of the associated consequences.
Acknowledgements
Not applicable.
Funding Statement
Funding: No funding was received.
Availability of data and materials
The datasets used and/or analyzed during the current study are available from the corresponding author on reasonable request.
Authors' contributions
This meta-analysis was written as part of the doctoral program for IAV at ‘Grigore T. Popa’ University. DN, AC and IAV performed the systematic review, analyzed data, and wrote the manuscript; AC, DN and DS interpreted the data; DN, IAV, RM and IP developed the study concept and design. DN and DS carried out the literature search, and were assisted by AC and IAV, who retrieved the evidence and chose the papers. The data were extracted by AC, IAV and DS. The final version of the publication was written by IAV, AC, DN and DS. A final inspection of the manuscript was entrusted to IAV and DN. All authors read and approved the final manuscript for publication.
Ethics approval and consent to participate
Not applicable.
Patient consent for publication
Not applicable.
Competing interests
All authors report no competing interests.
References
- 1.Ananth CV, Keyes KM, Wapner RJ. Pre-eclampsia rates in the United States, 1980-2010: Age-period-cohort analysis. BMJ. 2013;347(f6564) doi: 10.1136/bmj.f6564. [DOI] [PMC free article] [PubMed] [Google Scholar]
- 2.Barondes SH, Castronovo V, Cooper DN, Cummings RD, Drickamer K, Feizi T, Gitt MA, Hirabayashi J, Hughes C, Kasai K, et al. Galectins: A family of animal beta-galactoside-binding lectins. Cell. 1994;76:597–598. doi: 10.1016/0092-8674(94)90498-7. [DOI] [PubMed] [Google Scholar]
- 3.Kang HG, Kim DH, Kim SJ, Cho Y, Jung J, Jang W, Chun KH. Galectin-3 supports stemness in ovarian cancer stem cells by activation of the Notch1 intracellular domain. Oncotarget. 2016;7:68229–68241. doi: 10.18632/oncotarget.11920. [DOI] [PMC free article] [PubMed] [Google Scholar]
- 4.Sammar M, Drobnjak T, Mandala M, Gizurarson S, Huppertz B, Meiri H. Galectin 13 (PP13) facilitates remodeling and structural stabilization of maternal vessels during pregnancy. Int J Mol Sci. 2019;20(3192) doi: 10.3390/ijms20133192. [DOI] [PMC free article] [PubMed] [Google Scholar]
- 5.Page MJ, Moher D, Bossuyt PM, Boutron I, Hoffmann TC, Mulrow CD, Shamseer L, Tetzlaff JM, Akl EA, Brennan SE, et al. PRISMA 2020 explanation and elaboration: Updated guidance and exemplars for reporting systematic reviews. BMJ. 2021;372(n160) doi: 10.1136/bmj.n160. [DOI] [PMC free article] [PubMed] [Google Scholar]
- 6. National Center for Biotechnology Information (NCBI). PubMed database. https://pubmed.ncbi.nlm.nih.gov/. Accessed February 28, 2021. [Google Scholar]
- 7. Clarivate. Web of Science database. https://clarivate.com/webofsciencegroup/solutions/web-of-science/. Accessed on 28.02.2021. [Google Scholar]
- 8. Elsevier. Scopus database. https://www.scopus.com/home.uri. Accessed February 28, 2021. [Google Scholar]
- 9. Elsevier. Embase database. https://www.embase.com/landing?status=grey. Accessed February 28, 2021. [Google Scholar]
- 10. Clarivate. BIOSISCitationIndex. https://clarivate.com/webofsciencegroup/solutions/webodscience-biosis-citation-index/. Accessed February 28, 2021. [Google Scholar]
- 11. Cochrane Library. Cochrane database. https://www.cochranelibrary.com/. Accessed February 28, 2021. [Google Scholar]
- 12.Whiting P, Rutjes AW, Reitsma JB, Bossuyt PM, Kleijnen J. The development of QUADAS: A tool for the quality assessment of studies of diagnostic accuracy included in systematic reviews. BMC Med Res Methodol. 2003;3(25) doi: 10.1186/1471-2288-3-25. [DOI] [PMC free article] [PubMed] [Google Scholar]
- 13.Whiting PF, Rutjes AW, Westwood ME, Mallett S, Deeks JJ, Reitsma JB, Leeflang MM, Sterne JA, Bossuyt PM. QUADAS-2: A revised tool for the quality assessment of diagnostic accuracy studies. Ann Intern Med. 2011;155:529–536. doi: 10.7326/0003-4819-155-8-201110180-00009. QUADAS-2 Group. [DOI] [PubMed] [Google Scholar]
- 14.DerSimonian R, Laird N. Meta-analysis in clinical trials revisited. Contemp Clin Trials. 2015;45:139–145. doi: 10.1016/j.cct.2015.09.002. [DOI] [PMC free article] [PubMed] [Google Scholar]
- 15.Spencer K, Cowans NJ, Chefetz I, Tal J, Meiri H. First-trimester maternal serum PP-13, PAPP-A and second-trimester uterine artery Doppler pulsatility index as markers of pre-eclampsia. Ultrasound Obstet Gynecol. 2007;29:128–134. doi: 10.1002/uog.3876. [DOI] [PubMed] [Google Scholar]
- 16.Chafetz I, Kuhnreich I, Sammar M, Tal Y, Gibor Y, Meiri H, Cuckle H, Wolf M. First-trimester placental protein 13 screening for preeclampsia and intrauterine growth restriction. Am J Obstet Gynecol. 2007;197:35.e1–e7. doi: 10.1016/j.ajog.2007.02.025. [DOI] [PubMed] [Google Scholar]
- 17.Gonen R, Shahar R, Grimpel YI, Chefetz I, Sammar M, Meiri H, Gibor Y. Placental protein 13 as an early marker for pre-eclampsia: A prospective longitudinal study. BJOG. 2008;115:1465–1472. doi: 10.1111/j.1471-0528.2008.01902.x. [DOI] [PubMed] [Google Scholar]
- 18.Khalil A, Cowans NJ, Spencer K, Goichman S, Meiri H, Harrington K. First trimester maternal serum placental protein 13 for the prediction of pre-eclampsia in women with a priori high risk. Prenat Diagn. 2009;29:781–789. doi: 10.1002/pd.2287. [DOI] [PubMed] [Google Scholar]
- 19.Akolekar R, Syngelaki A, Beta J, Kocylowski R, Nicolaides KH. Maternal serum placental protein 13 at 11-13 weeks of gestation in preeclampsia. Prenat Diagn. 2009;29:1103–1108. doi: 10.1002/pd.2375. [DOI] [PubMed] [Google Scholar]
- 20.Khalil A, Cowans NJ, Spencer K, Goichman S, Meiri H, Harrington K. First-trimester markers for the prediction of pre-eclampsia in women with a-priori high risk. Ultrasound Obstet Gynecol. 2010;35:671–679. doi: 10.1002/uog.7559. [DOI] [PubMed] [Google Scholar]
- 21.Wortelboer EJ, Koster MP, Cuckle HS, Stoutenbeek PH, Schielen PC, Visser GH. First-trimester placental protein 13 and placental growth factor: Markers for identification of women destined to develop early-onset pre-eclampsia. BJOG. 2010;117:1384–1389. doi: 10.1111/j.1471-0528.2010.02690.x. [DOI] [PubMed] [Google Scholar]
- 22.Odibo AO, Zhong Y, Goetzinger KR, Odibo L, Bick JL, Bower CR, Nelson DM. First-trimester placental protein 13, PAPP-A, uterine artery Doppler and maternal characteristics in the prediction of pre-eclampsia. Placenta. 2011;32:598–602. doi: 10.1016/j.placenta.2011.05.006. [DOI] [PMC free article] [PubMed] [Google Scholar]
- 23.Schneuer FJ, Nassar N, Khambalia AZ, Tasevski V, Guilbert C, Ashton AW, Morris JM, Roberts CL. First trimester screening of maternal placental protein 13 for predicting preeclampsia and small for gestational age: In-house study and systematic review. Placenta. 2012;33:735–740. doi: 10.1016/j.placenta.2012.05.012. [DOI] [PubMed] [Google Scholar]
- 24.Deurloo KL, Linskens IH, Heymans MW, Heijboer AC, Blankenstein MA, van Vugt JM. ADAM12s and PP13 as first trimester screening markers for adverse pregnancy outcome. Clin Chem Lab Med. 2013;51:1279–1284. doi: 10.1515/cclm-2012-0566. [DOI] [PubMed] [Google Scholar]
- 25.Meiri H, Sammar M, Herzog A, Grimpel YI, Fihaman G, Cohen A, Kivity V, Sharabi-Nov A, Gonnen R. Prediction of preeclampsia by placental protein 13 and background risk factors and its prevention by aspirin. J Perinat Med. 2014;42:591–601. doi: 10.1515/jpm-2013-0298. [DOI] [PubMed] [Google Scholar]
- 26.Luo Q, Han X. Second-trimester maternal serum markers in the prediction of preeclampsia. J Perinat Med. 2017;45:809–816. doi: 10.1515/jpm-2016-0249. [DOI] [PubMed] [Google Scholar]
- 27.Asiltas B, Surmen-Gur E, Uncu G. Prediction of first-trimester preeclampsia: Relevance of the oxidative stress marker MDA in a combination model with PP-13, PAPP-A and beta-HCG. Pathophysiology. 2018;25:131–135. doi: 10.1016/j.pathophys.2018.02.006. [DOI] [PubMed] [Google Scholar]
- 28.Soongsatitanon A, Phupong V. doi: 10.1080/14767058.2020.1849127. Prediction of preeclampsia using first trimester placental protein 13 and uterine artery Doppler. J Matern Fetal Neonatal Med: Nov 16, 2020 (Epub ahead of print). [DOI] [PubMed] [Google Scholar]
- 29.North RA, McCowan LM, Dekker GA, Poston L, Chan EH, Stewart AW, Black MA, Taylor RS, Walker JJ, Baker PN, Kenny LC. Clinical risk prediction for pre-eclampsia in nulliparous women: Development of model in international prospective cohort. BMJ. 2011;342(d1875) doi: 10.1136/bmj.d1875. [DOI] [PMC free article] [PubMed] [Google Scholar]
- 30.Kliman HJ, Sammar M, Grimpel YI, Lynch SK, Milano KM, Pick E, Bejar J, Arad A, Lee JJ, Meiri H, Gonen R. Placental protein 13 and decidual zones of necrosis: An immunologic diversion that may be linked to preeclampsia. Reprod Sci. 2012;19:16–30. doi: 10.1177/1933719111424445. [DOI] [PubMed] [Google Scholar]
- 31.Redman CW, Sargent IL, Staff AC. IFPA Senior award lecture: Making sense of pre-eclampsia-two placental causes of preeclampsia? Placenta. 2014;35 (Suppl 1):S20–S25. doi: 10.1016/j.placenta.2013.12.008. [DOI] [PubMed] [Google Scholar]
- 32.Monte S. Biochemical markers for prediction of preclampsia: Review of the literature. J Prenat Med. 2011;5:69–77. [PMC free article] [PubMed] [Google Scholar]
Associated Data
This section collects any data citations, data availability statements, or supplementary materials included in this article.
Data Availability Statement
The datasets used and/or analyzed during the current study are available from the corresponding author on reasonable request.


