Abstract
This study determined if sustained walking with body borne load increases tibial compression, and whether increases in tibial compression are related to vertical GRFs. Thirteen participants had tibial compression and vertical GRF measures quantified while walking at 1.3 m/s for 60 minutes with body borne load. Each tibial compression (maximum and impulse) and GRF measure (peak, impulse, impact peak and loading rate) were submitted to a RM ANOVA to test the main effect and interaction between load (0, 15, and 30 kg) and time (minute 0, 30 and 60), and correlation analyses determined the relation between tibial compression and vertical GRF measures for each load and time. Each tibial compression and GRF measure increased with the addition of body borne load (all: p<0.001). Time impacted impact peak (p=0.034) and loading rate (p=0.017), but no other GRF or tibial compression measure (p>0.05). Although both tibial compression and vertical GRFs increased with load, vertical GRF measures exhibited negligible to weak (r: −0.37 to 0.35), and weak to moderate (r: −0.62 to 0.59) relation with maximum and impulse of tibial compression with each body borne load. At each time point, GRF measures exhibited negligible to weak (r: −0.39 to 0.27), and weak to moderate (r: −0.53 to 0.65) relation with maximum and impulse of tibial compression, respectively. Walking with body borne load increased tibial compression, and may place compressive forces on the tibia that lead to stress fracture. But, increases in tibial compression may not stem from concurrent increases in vertical GRFs.
Keywords: Stress Fracture, Load Carriage, Musculoskeletal Injury, Military
INTRODUCTION
During military activities, particularly basic training, personnel routinely walk with body borne load in excess of 20 kg for sustained time periods (Orr et al., 2015). These body borne loads result in significant changes to lower limb biomechanics, particularly large increases in ground reaction forces (GRF), and are reportedly the strongest predictor of military personnel stress fracture development (Birrell et al., 2007). Considering treating bone injuries costs the armed services 390 million dollars annually, it is imperative to determine the specific lower limb biomechanics that lead to these injuries, particularly tibial stress fracture (US General Accounting Office, 1997).
Walking with heavy military-relevant body borne load increases GRFs and risk of lower limb musculoskeletal injury, such as tibial stress fracture. Specifically, peak vertical GRFs are reported to increase between 9% and 11% with each 8 kg addition of load (Birrell et al., 2007). Significant increases in vertical GRFs may transmit greater force to the lower limb musculoskeletal system in general and compress the tibia specifically (Hadid et al., 2018; Sasimontonkul et al., 2007). Although a substantial increase in tibial compression force may initiate as well as accelerate bone microdamage and remodeling that characterize stress fracture (Schaffler et al., 1989), it is unclear if weight-bearing activity with body borne load leads to greater tibial compression, as it is inconclusive if in vivo tibial compression is elevated during loaded walking (Burr et al., 1996; Lanyon et al., 1975). Walking with body borne load may also increase both the impact peak (the first, rapid vertical GRF peak) and loading rate (transmission speed of the vertical GRF following heel strike) of the vertical GRF (Lobb et al., 2019). Significant increases in both impact peak and loading rate may lead to larger, faster tibial compression, increasing bone microdamage and thereby elevate stress fracture risk (Schaffler et al., 1989). In fact, individuals with tibial stress fracture reportedly exhibit approximately 8% greater impact peak, and approximately 19% greater average and instantaneous vertical loading rates than healthy controls (Milner et al., 2006). As such, it is imperative to determine if individuals place a greater compressive force on the tibia with each step and exhibit similar increases in GRFs related to stress fracture when walking with heavy body borne load.
During sustained walking with heavy body borne load, peak and loading rate of vertical GRFs reportedly increase up to 3% every fifteen minutes (Lidstone et al., 2017). A continual increase in vertical GRF measures may steadily increase tibial compression during sustained locomotion, and elevate stress fracture risk throughout the task duration. For instance, runners that increased their mileage exhibited a substantial 4% to 10% increase in probability of sustaining a tibial stress fracture (Edwards et al., 2009). The continual rise in vertical GRF during sustained walking with heavy body borne load may also accelerate fatigue-related muscular weakness, and subsequently limit the musculature’s ability to attenuate elevated GRFs, leading to greater tibial compression. Although tibial compression is reported to increase with concurrent increases in vertical GRFs, it results from the combination of both internal (i.e., muscle) and external (i.e., GRF) forces (Matijevich et al., 2019). As such, fatigue-related weakness of the ankle musculature with sustained walking may not produce a continual rise in the internal forces that create tibial compression throughout the task duration. Milgrom et al., in fact, reported in vivo increases in tibial strain following fatiguing locomotor tasks was limited to tibial tension, and not observed for compression (2007). Matijevich et al. also reported the vertical GRFs recorded when running at different speeds and slopes did not exhibit a strong, linear relation with tibial compression, and thus, GRFs observed during locomotion may not translate to greater compressive forces placed on the tibia (2019). Yet, it is feasible that tibial compression may relate to changes in muscle forces, rather than the continual rise in vertical GRFs during sustained walking with body borne load.
Considering military personnel routinely walk with body borne load for sustained time periods, it is crucial to understand if concurrent increases in load and duration of walking elevate tibial compression and stress fracture risk. With that in mind, the purpose of this study was to determine if body borne load and duration of walking increase tibial bone load, and whether increases in vertical GRFs exhibited with sustained walking with body borne load exhibit a significant relation to tibial bone loads. It is hypothesized that both body borne load and duration of walking would lead to a significant increase in tibial bone load, but increases in vertical GRFs would not have a strong linear relation to increases in tibial bone loads.
METHODS
Participants
Preliminary vertical GRF data at minutes 0 and 30 of the sustained walk task indicated that 5 participants are required to achieve statistical significance (80% statistical power at alpha level 0.05) with the expected moderate to large effect size (0.75 or greater). To ensure sufficient sample, 13 participants (9 male/4 female: 23.8 ± 2.8 yrs, 1.8 ± 0.1 m, 72.0 ± 12.6 kg) were recruited. Each participant was between the ages of 18 and 40 years and self-reported the ability to safely walk with 75 pounds. Participants were excluded if they had: (1) a history of serious lower extremity and/or serious back injury or surgery; (2) a recent injury to the lower extremity and/or back in the 6 months prior to the commencement of testing; (3) previously diagnosed with any known neurological disorder; and/or (4) are currently pregnant. Research approval was obtained from the local Institutional Review Board, and all participants provided written informed consent prior to testing.
Experimental Design
Each participant completed three test sessions. During each test session, participants completed the sustained walk task with a different body borne load (0 kg, 15 kg and 30 kg). For testing, participants wore spandex shorts and shirt, and a weighted vest (V-MAX, WeightVest.com, Rexburg, ID, USA) (Figure 1). The weighted vest was systematically adjusted prior to testing to ensure it provided the necessary body borne load for each condition (± 2% of target). To reduce fatigue effects and limit injury risk, each test session was separated by a minimum of 24 hours. In order to avoid bias and confounding data, a 3 × 3 Latin square was used to randomly assign the test sequence of load configurations before testing.
Figure 1.
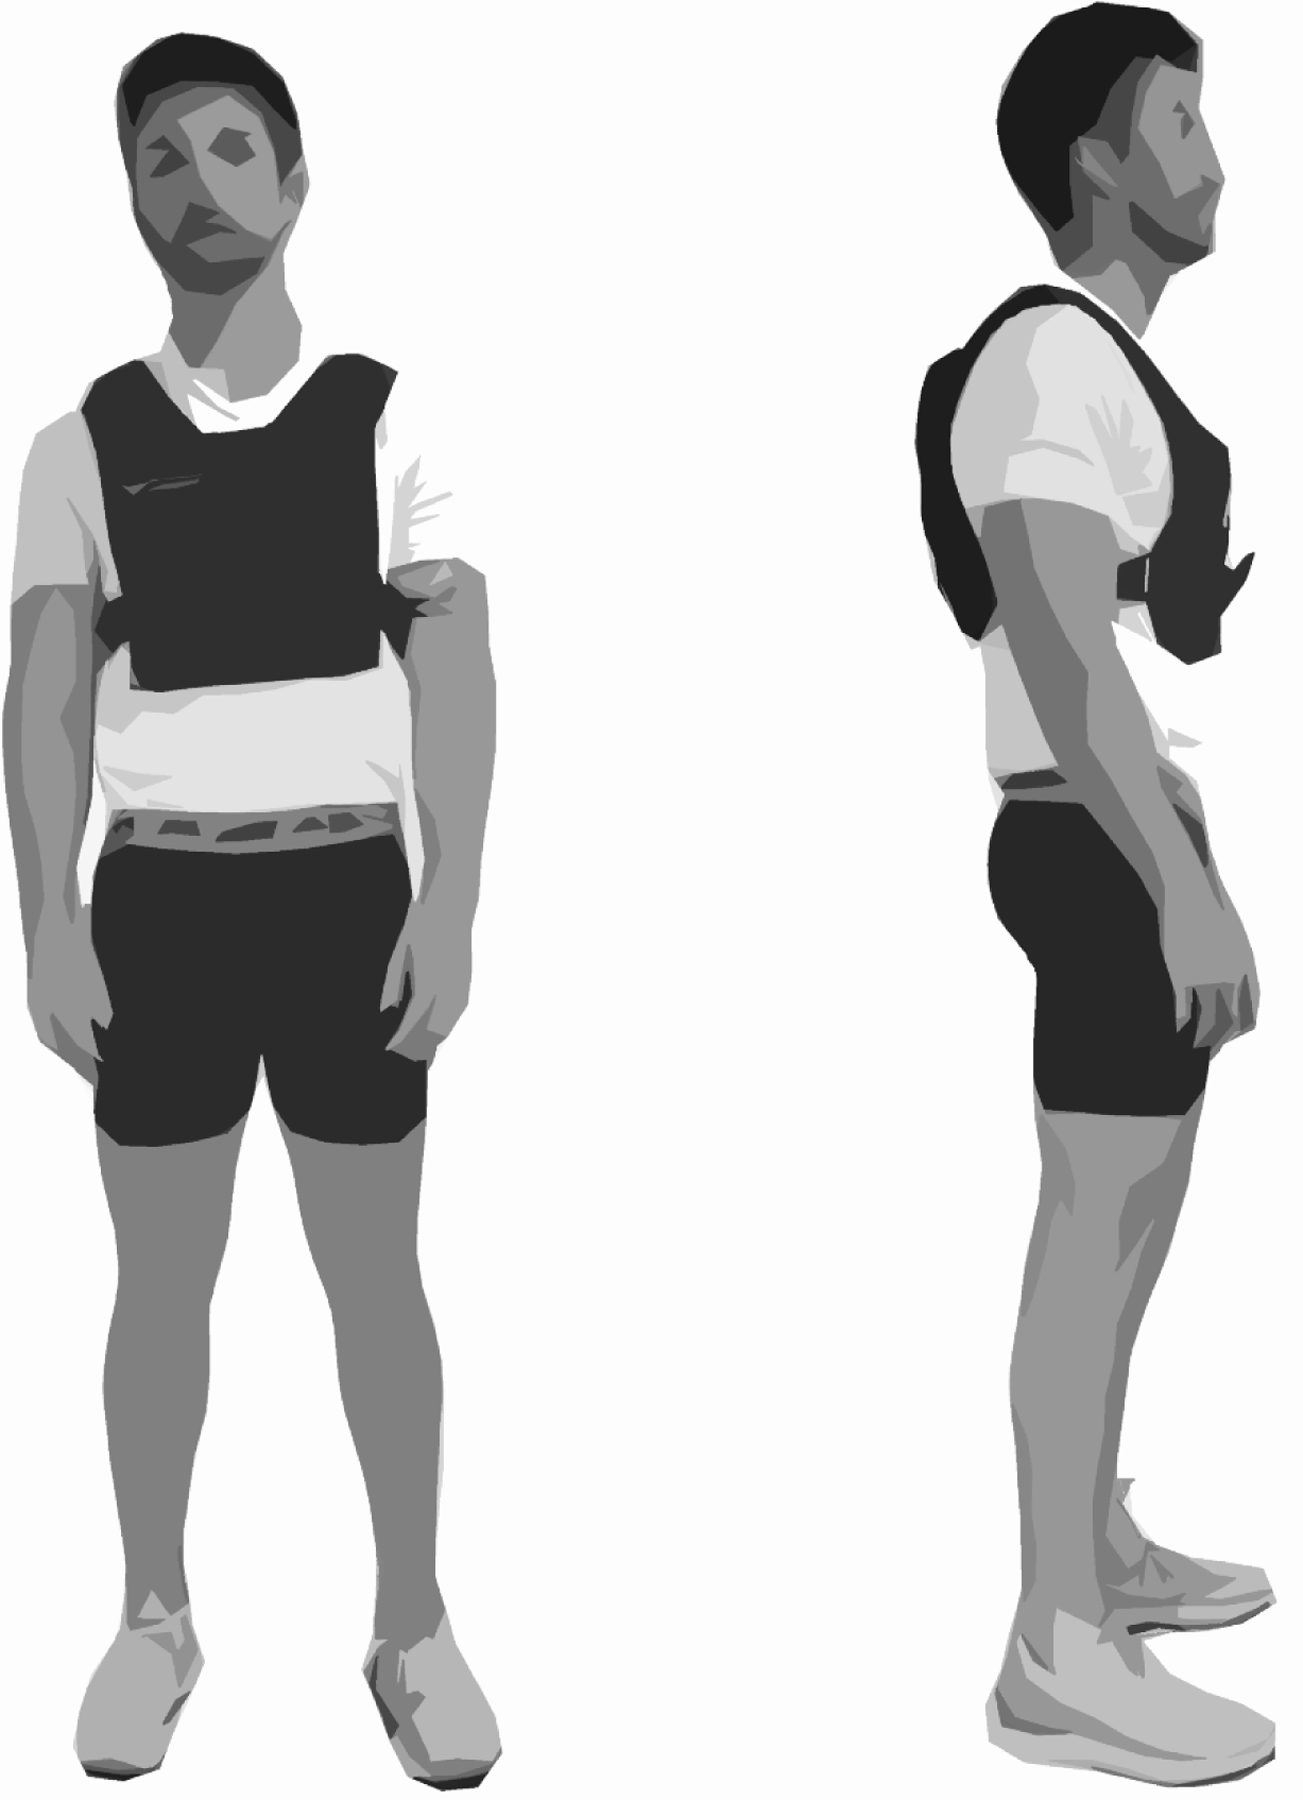
Depicts the equipment worn for the 15 kg and 30 kg load conditions. For the 15 kg and 30 kg load conditions, participants wore a weighted vests that was systematically adjusted to apply the necessary load.
The sustained walk task required each participant walk continuously over-ground at 1.3 m/s for 60 minutes. Specifically, the walk task required each participant complete one lap of the 390-meter walk course (included both indoor and outdoor portions) every 5 minutes (Appendix A). For the indoor portion, each participant walked at 1.3 m/s ± 5 % throughout the motion capture volume three times. During each trial, two sets of infrared timing gates (TracTronix TF100, TracTronix Wireless Timing Systems, Lenexa, KS) placed four meters apart in the motion capture volume recorded walk speed. Each trial was deemed either successful (if the participant walked the target speed and only contacted the force platform with their dominant limb) or unsuccessful. Immediately following the completion of the three walk trials, participants exited the lab to complete the outdoor portion, which required they walk over a small grassy area and footpath before reentering the lab. Throughout the walk task, participants walked to a metronome (Planet Waves PW-MT-01, D’Addario, Farmingdale, NY) set to a participant-dependent cadence to ensure correct walking speed.
Biomechanical Testing and Analysis
During each walk trial, participants had synchronous three-dimensional (3D) lower limb (hip, knee and ankle) biomechanical data recorded, with eight high-speed (240 Hz) optical cameras (MXF20, Vicon Motion Systems LTD, Oxford, UK) and a single in-ground force platform (2400 Hz, OR6, AMTI, Watertown, MA). For each successful walk trial, lower limb biomechanical data was calculated from the 3D coordinates of thirty-four retro-reflective markers. After marker placement, a participant-specific kinematic model (comprised of trunk, pelvis, and bilateral thigh, shank and foot segments with 27 degrees of freedom) was created from a static trial. Each segment of the kinematic models was designated a local coordinate system with three orthogonal axes (x, y and z), according to Seymore et al. (2019). After fitting the kinematic model to each successful trial, the marker and GRF data were run through a low pass fourth-order Butterworth filter with a cutoff of 12 Hz. Filtered marker trajectories were then processed in Visual 3D (v6.64, C-Motion, Inc, Germantown, MD, USA) to calculate ankle rotations, using a joint coordinate systems approach (Grood and Suntay, 1983). Standard inverse-dynamics analysis used the filtered kinematic and GRF data to obtain 3D ankle joint forces and moments, with segmental inertial properties defined according to Dempster et al. (1959).
Custom MATLAB code was used to quantify tibial compression and GRF metrics. Tibial compression was calculated as the longitudinal compressive force on the distal tibia, according to Matijevich et al. (2019). Specifically, the tibial compression force was the summation of the external net force on the ankle (estimated as the 3D GRF projected on the long tibia axis) and internal muscle force contributions (estimated as sagittal ankle moment divided by Achilles tendon moment arm). Then, maximum tibial compression force (Ftib,max), defined as the peak tibial compressive force over stance, and tibial compression force impulse (Jtib), defined as the time integral of the tibial compressive force over stance, were calculated. The GRF metrics calculated include peak (vGRFpeak) and impulse (JvGRF) of the vertical GRF, defined as peak and time integral of vertical GRF over stance, as well as impact peak (vGRFimpact) and vertical average loading rate (VALR). vGRFimpact and VALR were calculated at 13% of stance and the slope of the vertical GRF between 20% and 80% of stance, according to Willy et al. (2008) and Milner et al. (2006), respectively. All GRF variables were normalized to participant’s body weight (N) and all biomechanical data were normalized to stance and resampled at 1% increments (n = 101) for presentation. Stance phase (0% to 100%) was defined as heel strike to toe-off (the instance GRF exceeded and fell below 10 N).
Statistical Analysis
For statistical analysis, the dependent variables were tibial compression (Ftib,max and Jtib) and GRF (vGRFpeak, vGRFimpact, VALR and JvGRF) measures. Each dependent variable was averaged across the three successful trials to create a participant-based mean. Then, each participant-based mean was submitted to a 2-way repeated-measures analysis of variance to test the main effects of and interaction between load (0, 15, and 30 kg) and time (minutes 0, 30 and 60). Significant interactions were submitted to a simple effects analysis, and a modified Hommel correction was used for multiple comparisons (HOMMEL, 1988). Pearson correlation coefficients (r) were calculated to determine the relation between tibial compression and GRF measures for each load (0, 15, and 30 kg) and time point (minutes 0, 30 and 60). Each correlation coefficient was transformed using Fisher’s z and an average for each load and time were calculated. All statistical analysis was performed using SPSS (v26, IBM, Armonk, NY), with alpha level 0.05.
RESULTS
Body borne load increased each tibial compression and GRF measure (all: p<0.001) (Figures 2 and 3, and Table 1). Each tibial compression (Ftib,max and Jtib) and GRF measure (vGRFpeak, JvGRF, vGRFimpact and VALR) was greater with the 30 compared to the 15 and 0 kg loads (all: p<0.001), and with 15 compared to the 0 kg load (all: p<0.024, corrected p=0.05).
Figure 2.
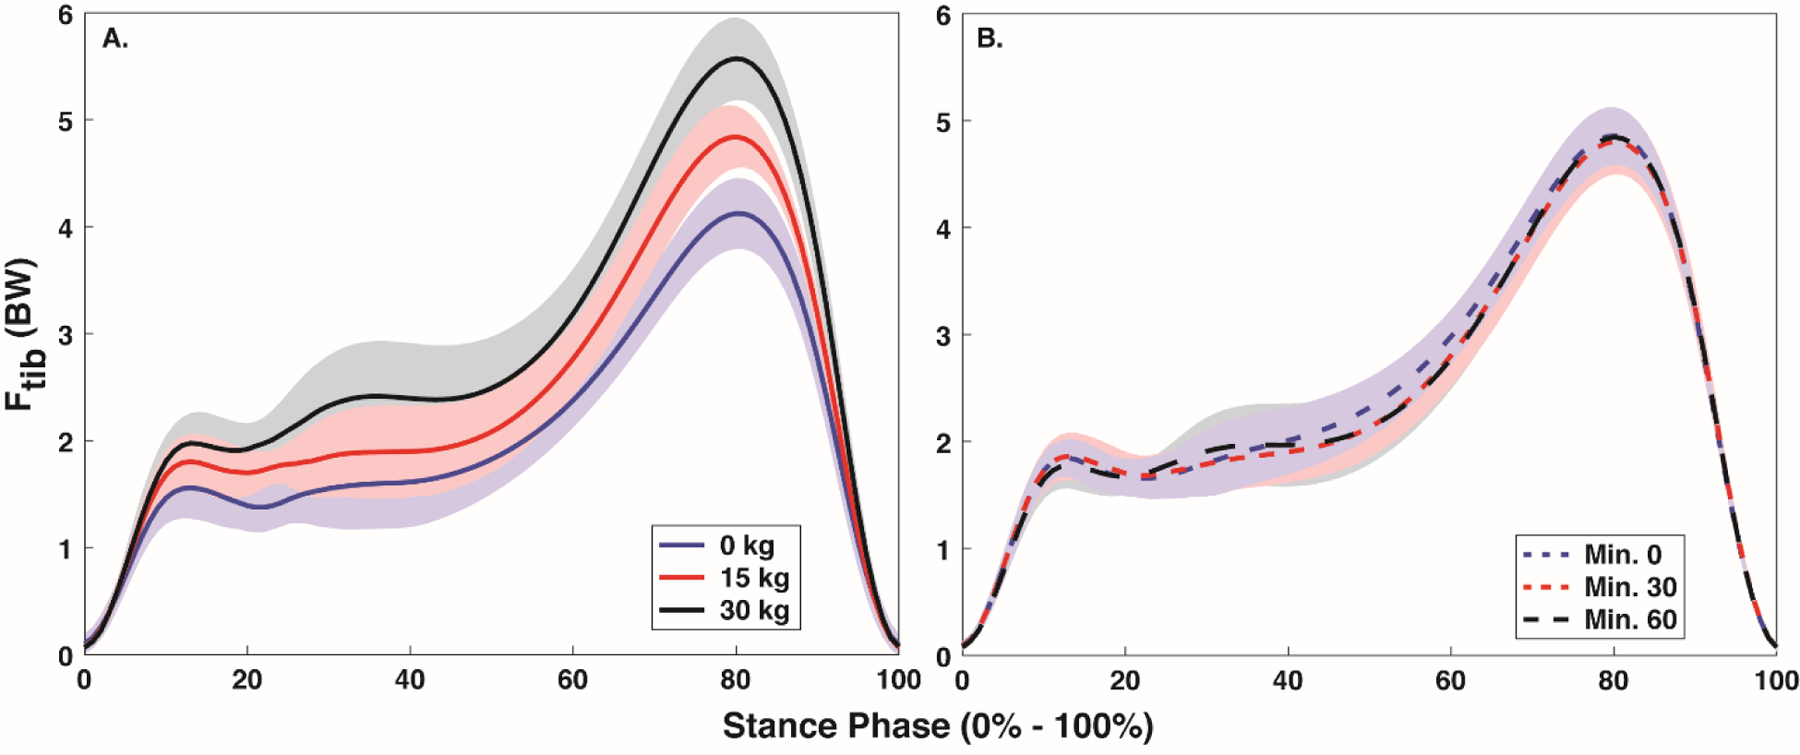
Mean ± SD stance phase (0% - 100%) tibial compression with each body borne load (0, 15, and 30 kg) (A) and at each time point (minute 0, 30 and 60) (B).
Figure 3.
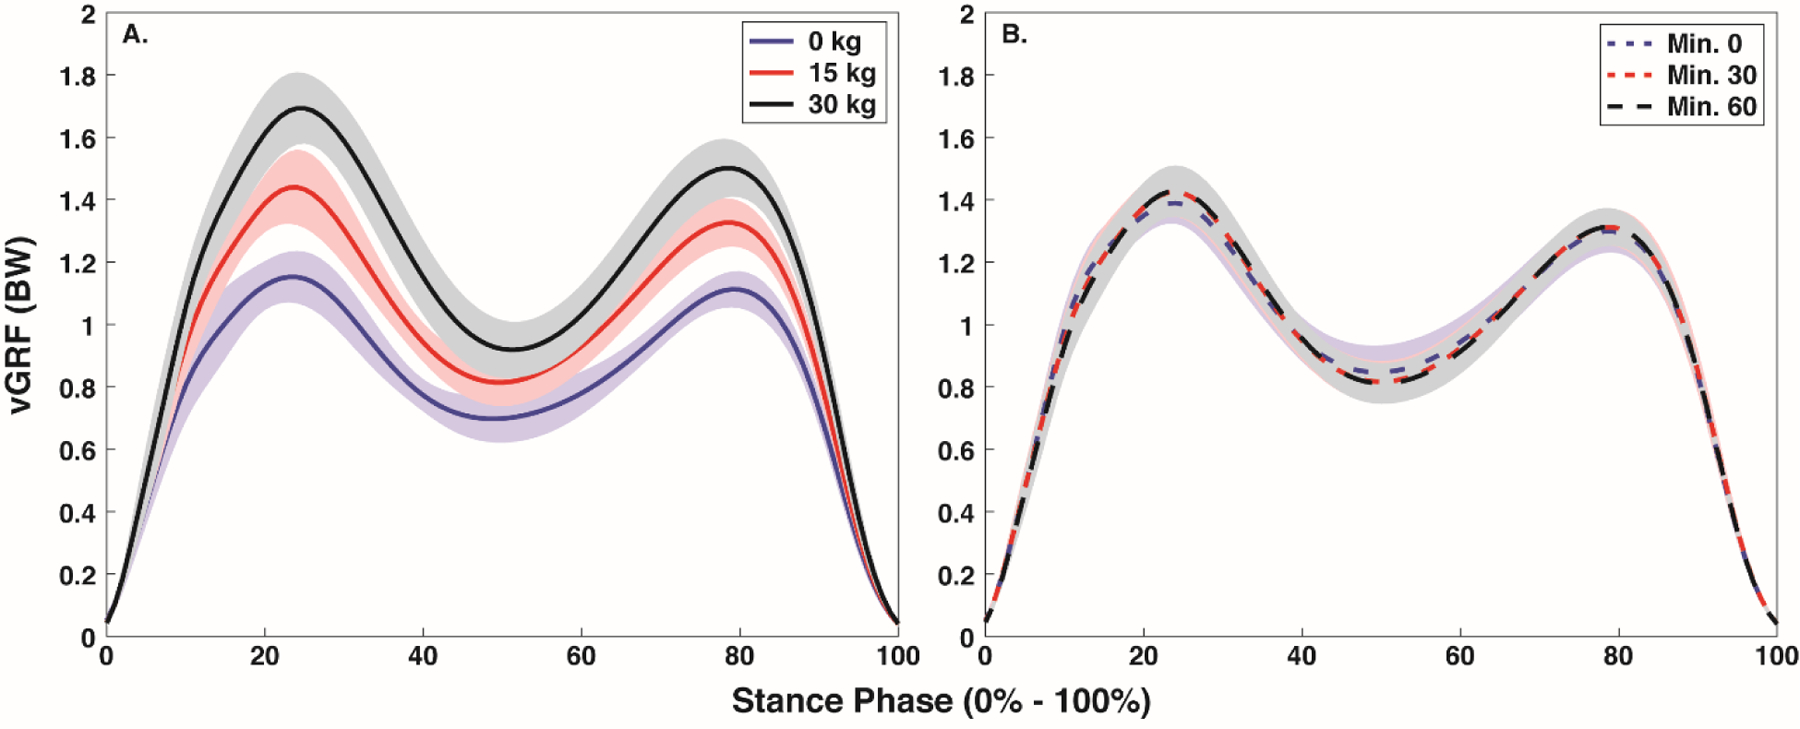
Mean ± SD stance phase (0% - 100%) vertical ground reaction force with each body borne load (0, 15, and 30 kg) (A) and at each time point (minute 0, 30 and 60) (B).
Table 1.
Mean (SD) for each tibial compression and ground reaction force measure with each body borne load (0, 15, and 30 kg).
| Ftib,max (BW) | Jtib (BW*s) | vGRFpeak (BW) | JvGRF (BW*s) | vGRFimpact (BW) | VALR (BW/s) | |
|---|---|---|---|---|---|---|
| 0 kg | 4.09 (0.06) | 1.35 (0.03) | 1.18 (0.01) | 0.53 (0.01) | 0.98 (0.02) | 13.05 (0.52) |
| 15 kg | 4.90 (0.08)# | 1.64 (0.04)# | 1.44 (0.02)# | 0.65 (0.01)# | 1.13 (0.03)# | 14.56 (0.76)# |
| 30 kg | 5.56 (0.12)#* | 1.88 (0.04)#* | 1.70 (0.03)#* | 0.76 (0.02)#* | 1.32 (0.03)#* | 17.20 (0.78)#* |
denotes a significant (p < 0.05) difference from 0 kg load.
denotes a significant (p < 0.05) difference from 15 kg load.
Time impacted GRF, but not tibial compression (Figure 2 and 3, Table 2). Specifically, time had a significant effect on vGRFimpact (p=0.034) and VALR (p=0.017), but not vGRFpeak (p=0.117) and JvGRF (p=0.126), or either Ftib,max (p=0.512) and Jtib (p=0.568). VALR decreased at minutes 30 and 60 compared to minute 0 (p=0.010 and p=0.023), but no difference was evident between minutes 30 and 60 (p=0.337, corrected p=0.025). After correcting for Type I error, no difference in vGRFimpact was evident between any time point (all: p>0.034, corrected p=0.0167).
Table 2.
Mean (SD) for each tibial compression and ground reaction force measure with at each time point (0, 30 and 60 minutes).
| Ftib,max (BW) | Jtib (BW*s) | vGRFpeak (BW) | JvGRF (BW*s) | vGRFimpact (BW) | VALR (BW/s) | |
|---|---|---|---|---|---|---|
| Min 0 | 4.87 (0.08) | 1.63 (0.04) | 1.42 (0.02) | 0.64 (0.01) | 1.17 (0.02) | 15.64 (0.59) |
| Min 30 | 4.82 (0.09) | 1.62 (0.04) | 1.45 (0.02) | 0.65 (0.01) | 1.14 (0.03)# | 14.69 (0.64) |
| Min 60 | 4.86 (0.07) | 1.62 (0.03) | 1.45 (0.02) | 0.65 (0.01) | 1.12 (0.03)# | 14.48 (0.68) |
denotes a significant (p < 0.05) difference from minute 0.
With each body borne load, GRF measures exhibited negligible to moderate relation with tibial compression (Figure 4 and Table 3). Specifically, vGRFpeak exhibited a negligible relation with Ftib,max (−0.19 to 0.01), vGRFimpact exhibited a weak, negative relation with Ftib,max (−0.30 to −0.35), VALR exhibited a weak, negative relation with Ftib,max (−0.32 to −0.37) and JvGRF exhibited a negligible to weak, positive relation with Ftib,max (0.11 to 0.35). While, on average, vGRFpeak exhibited a negligible to moderate, negative relation with Jtib (−0.04 to −0.51), vGRFimpact exhibited a weak to moderate, negative relation with Jtib (−0.28 to −0.57), VALR exhibited a weak to moderate, negative relation with Jtib (−0.44 to −0.62) and JvGRF a weak to moderate, positive relation with Jtib (0.45 to 0.59).
Figure 4.
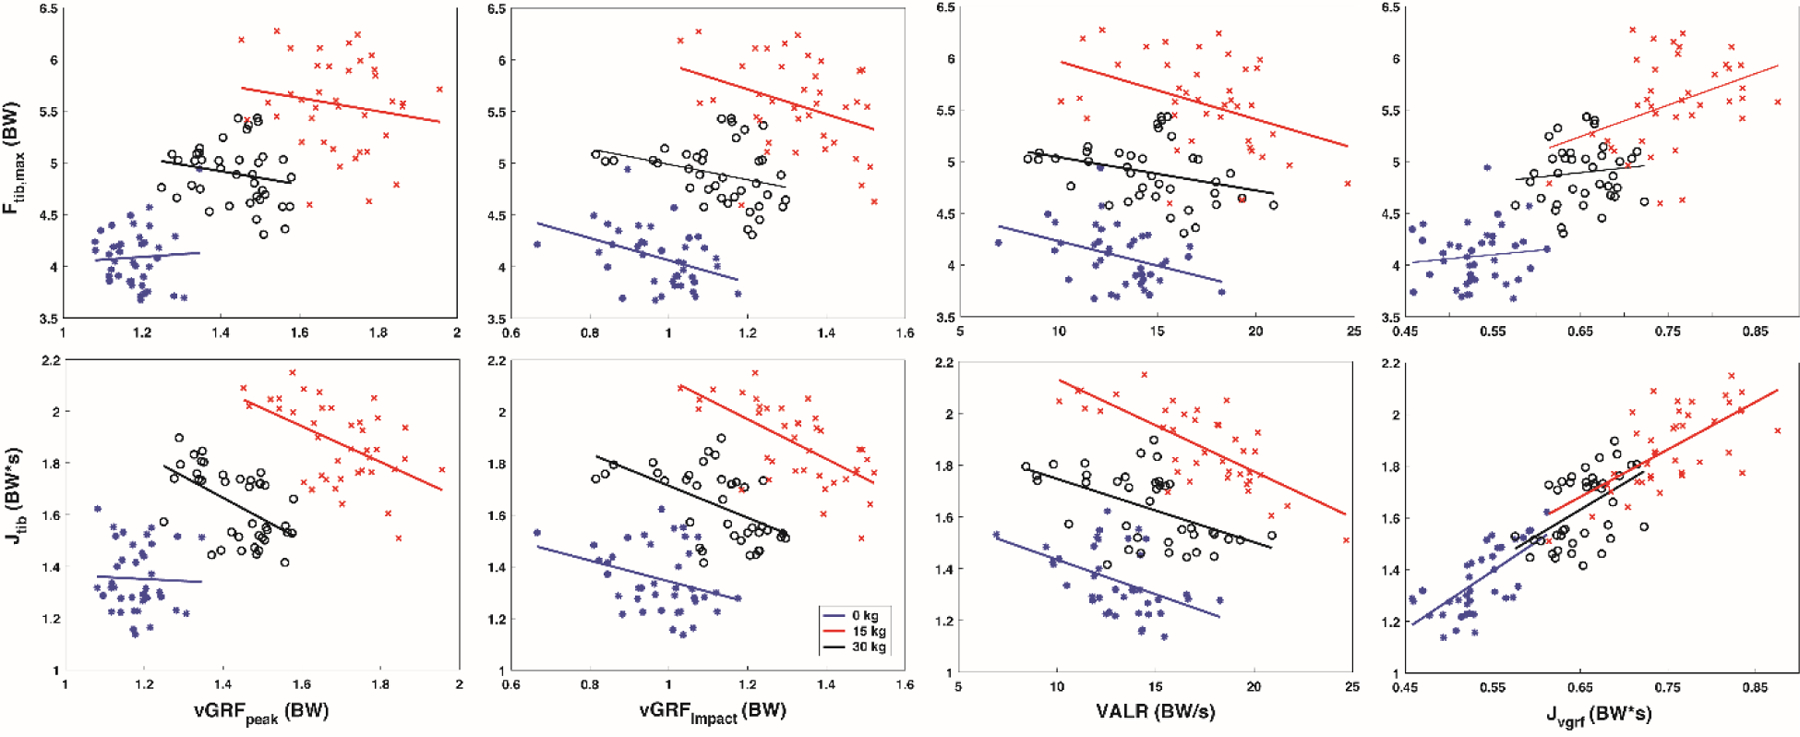
Correlation results for tibial compression vs vertical GRF metrics with each body borne load (0 kg (blue), 15 kg (black) and 30 kg (red)).
Table 3.
Mean ± SD for the correlation coefficient between each ground reaction force and tibial force measure with each body borne load (0, 15 and 30 kg).
| vGRFpeak | vGRFimpact | VALR | JvGRF | vGRFpeak | vGRFimpact | VALR | JvGRF | |
|---|---|---|---|---|---|---|---|---|
|
|
||||||||
| Ftib,max | Jtib | |||||||
| 0 kg | 0.01 ± 0.32 | −0.34 ± 0.28 | −0.37 ± 0.28 | 0.07 ± 0.31 | −0.04 ± 0.32 | −0.28 ± 0.29 | −0.44 ± 0.26 | 0.59 ± 0.21 |
| 15 kg | −0.19 ± 0.31 | −0.30 ± 0.29 | −0.32 ± 0.28 | 0.11 ± 0.31 | −0.51 ± 0.24 | −0.48 ± 0.25 | −0.47 ± 0.25 | 0.45 ± 0.26 |
| 30 kg | −0.15 ± 0.31 | −0.35 ± 0.28 | −0.37 ± 0.28 | 0.35 ± 0.28 | −0.48 ± 0.25 | −0.57 ± 0.22 | −0.62 ± 0.20 | 0.57 ± 0.22 |
At each time point, GRF measures had a negligible to moderate correlation with tibial compression (Figure 5 and Table 4). Specifically, vGRFpeak exhibited a negligible to weak relation with Ftib,max (−0.32 to 0.02), and JvGRF exhibited a negligible, positive relation with both Ftib,max (0.08 to 0.26) and a weak to moderate, positive relation with Jtib (0.42 to 0.65). Additionally, vGRFimpact exhibited a negligible to weak, negative relation with Ftib,max (−0.39 to −0.27) and VALR a negligible to weak, negative relation with Ftib,max (−0.43 to −0.28), while vGRFpeak exhibited a negligible to weak, negative relation with Jtib (−0.47 to −0.29), vGRFimpact exhibited a weak to moderate, negative relation with Jtib (−0.53 to −0.39), and VALR a moderate, negative relation with Jtib (−0.53 to −0.50).
Figure 5.
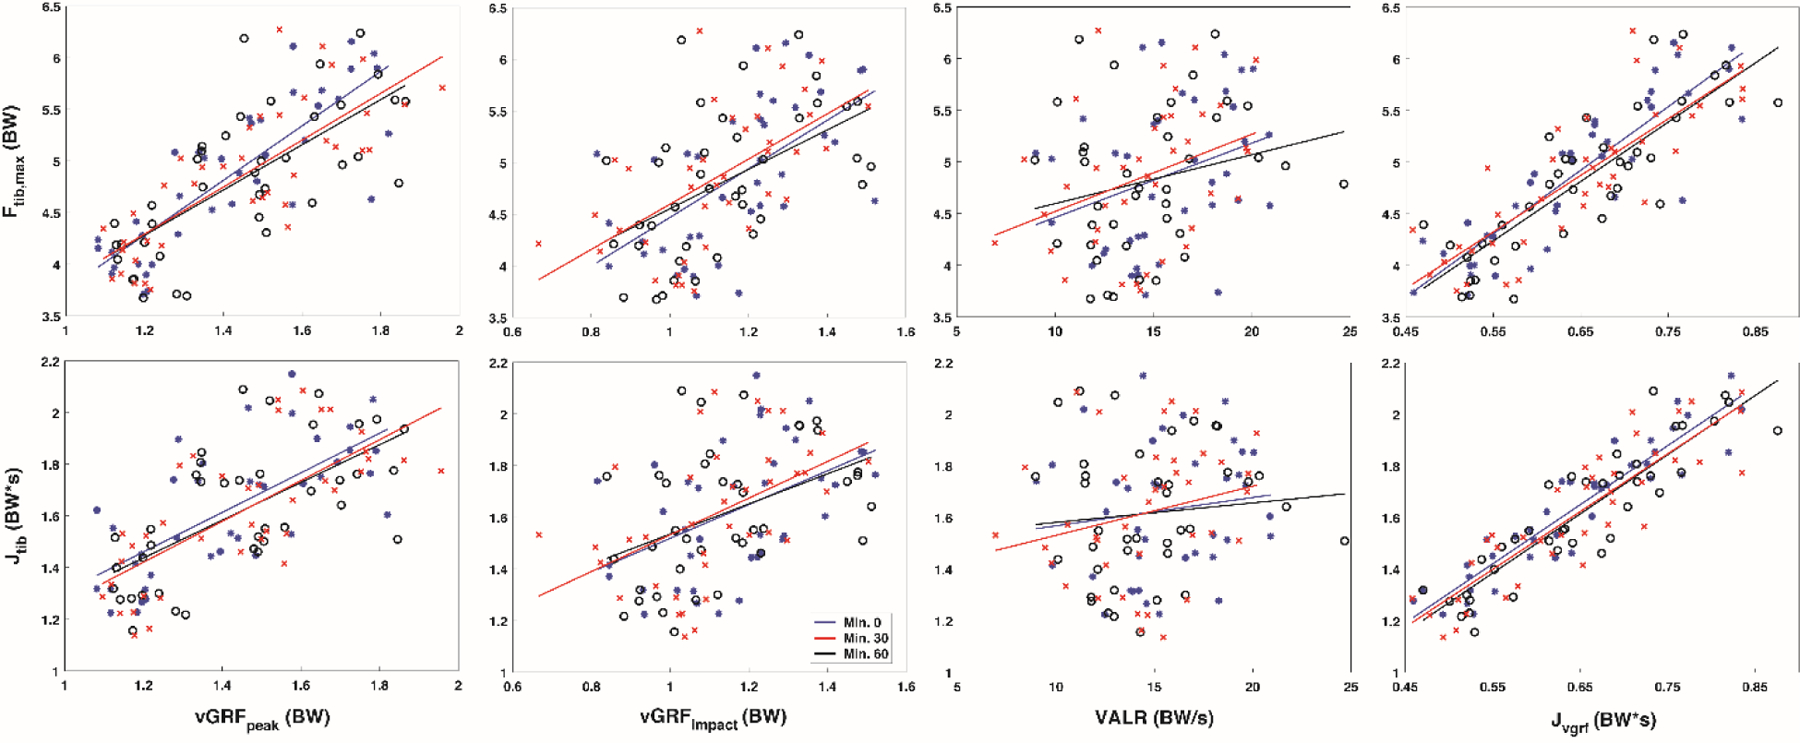
Correlation results for tibial compression vs vertical GRF metrics at each time point (minute 0 (blue), minute 30 (black) and minute 60 (red)).
Table 4.
Mean ± SD f for the correlation coefficient between each ground reaction force and tibial force measure at each time point ( minute 0, 30 and 60).
| vGRFpeak | vGRFimpact | VALR | JvGRF | vGRFpeak | vGRFimpact | VALR | JvGRF | |
|---|---|---|---|---|---|---|---|---|
|
|
||||||||
| Ftib,max | Jtib | |||||||
| Min 0 | −0.01 ± 0.32 | −0.39 ± 0.27 | −0.43 ± 0.26 | 0.26 ± 0.30 | −0.31 ± 0.29 | −0.43 ± 0.26 | −0.51 ± 0.24 | 0.65 ± 0.19 |
| Min 30 | −0.32 ± 0.29 | −0.27 ± 0.30 | −0.34 ± 0.28 | 0.21 ± 0.30 | −0.47 ± 0.25 | −0.39 ± 0.27 | −0.53 ± 0.24 | 0.54 ± 0.23 |
| Min 60 | 0.02 ± 0.32 | −0.33 ± 0.28 | −0.28 ± 0.29 | 0.08 ± 0.31 | −0.29 ± 0.29 | −0.53 ± 0.23 | −0.50 ± 0.24 | 0.42 ± 0.27 |
DISCUSSION
This study determined whether sustained walking with body borne load leads to greater tibial compression, and whether tibial compression related to concurrent increases in vertical GRFs common when walking with load. Our hypotheses were partially supported, as body borne load, but not time increased tibial compression, and vertical GRFs exhibited negligible to moderate linear relations to tibial compression at each body borne load and time point.
Large increases in tibial compression during sustained walking with body borne load may elevate tibial stress fracture risk. In agreement with our hypothesis, the 15 kg and 30 kg addition of body borne load lead to a significant, approximate 20% increase in both Ftib,max and Jtib. Although the observed Ftib,max and Jtib changes were below previous increases (between 30 to 39%) in tibial compression due to body borne load (Hadid et al., 2018; Lanyon et al., 1975; Xu et al., 2016), they may lead to maximal effective strain (i.e., > 2000 microstrain) on the tibia reported to decrease bone fatigue life, increasing likelihood of stress fracture with sustained load carriage (Schaffler et al., 1989). The elevated Ftib,max and Jtib also coincided with large concurrent increases in vertical GRFs common when walking with body borne load (Wang et al., 2013). Specifically, vGRFpeak and JvGRF increased between 17% and 23% with each incremental addition of load. The elevated vertical GRFs, as a result of adding body borne load, may increase risk of lower limb musculoskeletal injury by increasing the magnitude and speed of force transmission to the lower limb in general, and tibia specifically (Ramsay et al., 2016). The current participants, in fact, may have increased the rapid transmission of the GRFs to the lower limb through large, significant increases of vGRFimpact and VALR with each incremental addition of body borne load. Participants increased vGRFimpact and VALR approximately 15% and 18% between each incremental addition of body borne load (0 kg to 15 kg and 15 kg 30 kg), respectively. Considering individuals with a history of tibial stress fracture exhibit approximately 8% and 16% greater vGRFimpact and VALR than healthy controls (Milner et al., 2006), the addition of heavy 15 kg and 30 kg body borne load may lead to substantial increases in rate of tibial compression and greater bone microdamage, as faster tibial strains are reported to produce larger decreases in bone fatigue life (Schaffler et al., 1989).
The significant increases in tibial compression with the addition of body borne load may not be attributed to elevated vertical GRFs. In agreement with Matijevich et al., a strong, linear relation between tibial compression (Ftib,max and Jtib) and vertical GRFs (vGRFpeak, JvGRF, vGRFimpact, and VALR) were not observed with each body borne load (2019). In fact, each vertical GRF measure exhibited a negligible to weak correlation with Ftib,max (−0.37 to 0.35) and a negligible to moderate correlation with Jtib (−0.62 to 0.59) with each body borne load. Magnitudes of both Ftib,max and Jtib consistently exceeded vertical GRFs. Specifically, Ftib,max was consistently approximately 3.3 to 3.5 BW times greater than vGRFpeak, while Jtib was approximately 2.5 to 2.6 BW times greater than JvGRF, highlighting the large disparity between externally measured GRFs and those experienced by internal structures, such as muscles and bones, during locomotion (Scott and Winter, 1990). The discrepancy between vertical GRFs and tibial compression may stem from the muscle force necessary to walk with body borne load. To walk with body borne load, greater activation of lower limb musculature, in particular a significant increase in peak ankle joint moments, is required to properly attenuate impact forces as well as propel the center of mass forward with each step (Baggaley et al., 2020; Hamner et al., 2010). Considering the current tibial compression calculation determines internal muscle force from the sagittal plane ankle joint moment and Achilles tendon moment arm, significant increases in ankle joint moments would be accompanied by greater gastrocnemius force and tibial compression (Farris and Sawicki, 2012; Lidstone et al., 2017). The current participants, in fact, exhibited a large, significant increase (between 8% and 23%) in peak sagittal plane ankle joint moment with the 15 and 30 kg addition of body borne load (Appendix B). Yet, despite potential large increases in gastrocnemius force when walking with body borne load, future research is needed to determine if and how greater muscle force required to successfully walk with body borne load increases risk of tibial stress fracture.
Tibial compression did not significantly increase throughout the sustained walk task. Although sustained walking with body borne load may lead to fatigue-related muscular weakness of the lower limb musculature, limiting the muscle’s ability to adequately attenuate elevated GRFs (Wang et al., 2012), longer walk times did not lead to a significant increase in either Ftib,max or Jtib. In agreement with Milgrom et al. (2007), sustained bouts of load carriage may not further increase tibial compressive forces that elevate stress fracture risk. Throughout the sustained walk task, the current participants exhibited an insignificant reduction for both Ftib,max and Jtib. Specifically, participants decreased Ftib,max by 0.05 BW and 0.01 BW at minute 30 and 60, and Jtib by 0.01 BW*s at both time points. While the reason the current participants decreased tibial compression throughout the sustained walk task is not immediately evident, it may stem from the fact that they did not exhibit a concomitant increase in vGRFpeak and associated metrics. Considering moderate to strong positive, linear relations were observed between vertical GRFs (particularly vGRFpeak and JvGRF) and tibial compression (Ftib,max and Jtib) at each time point, the insignificant 0.03 BW increase in vGRFpeak and 0.01 BW*s increase in JvGRF at minutes 30 and 60 may contribute to the minimal change in tibial compression throughout the walk task. Yet, unlike with the addition of body borne load, participants exhibited no significant change in peak sagittal plane ankle joint moment throughout the sustained walk task, and further research is needed to determine whether vertical GRFs explained a greater percentage of tibial compression from a reduction in muscle force, rather than an increase of GRFs being transmitted to the tibia.
Risk of tibial stress fracture may not increase throughout the sustained walk task. Participants exhibited a significant reduction in both vGRFimpact and VALR during the sustained walk task. In particular, participants decreased VALR by 6% and 7% at minutes 30 and 60, and exhibited a 3% to 4%, albeit insignificant, reduction in vGRFimpact at minutes 30 and 60. Considering both vGRFimpact and VALR are greater for individuals with a history of tibial stress fracture and substantial increases in tibial strain rate are reported following similar fatiguing locomotor activities (Milgrom et al., 2007; Milner et al., 2006), future research is warranted to determine if load carriers can adopt lower limb biomechanics during sustained walking that decrease vGRFimpact and VALR, and modulate risk of tibial stress fracture.
The current tibial compression calculation may be a limitation. While this calculation has been used previously, it treats Achilles tendon length as a constant (5 cm) and may over or under estimate tendon length and subsequently tibial compression for certain individuals (Farris and Sawicki, 2012; Honert and Zelik, 2016). Additionally, the chosen participants may be a limitation. Although the inclusion criteria stipulated participants self-report the ability to safely carry 75 pounds, participants were not excluded if they lacked load carriage experience. We are currently unaware, however, of any experimental evidence that demonstrates experienced load carriers exhibit significantly different lower limb biomechanics, and thus different tibial bone loading measures, than inexperienced load carriers.
CONCLUSION
In conclusion, sustained walking with body borne load increased tibial compression and potential tibial stress fracture risk. During the sustained walk task, each incremental addition of body borne loads resulted in a 20% increase in Ftib,max and Jtib, and may place greater compressive forces on the distal tibia. Although vertical GRFs also increase with the addition of body borne load, these elevated GRFs did not exhibit a strong relation to the large increases in tibial compression with the addition of load. Similar increases in tibial compression were not evident throughout the sustained walk task. Participants reduced both Ftib,max and Jtib, and slowed the transmission of GRFs to the musculoskeletal system throughout the walk task.
Acknowledgements
Funding for this project was provided by MW CTR-IN /NIGMS (Award # 2U54GM104944) who had no direct involvement in the study. We would like to thank Kayla Seymore and Alexis Flock for their assistance with the project.
Appendix A
Video depicting one lap of the walk course, including both the indoor and outdoor portions.
Appendix B
Peak of stance (0% to 100%) sagittal plane ankle moment was quantified and submitted to a repeated measures ANOVA to test the main effects of and interaction between load (0 kg, 15 kg and 30 kg) and time (minute 0, minute 30 and minute 60).
Results
Peak sagittal plane ankle moment was −0.83, −0.99, and −1.13 Nm/kg with the 0, 15 and 30 kg loads, and −0.99, −0.96, and −0.99 Nm/kg at minute 0, 30 and 60, respectively (Fig. B).
Body borne load (p < 0.001), but not time (p = 0.244) impacted the peak sagittal ankle moment. Peak sagittal ankle moment was greater with the 30 compared to the 15 and 0 kg loads, and with 15 compared to the 0 kg load (all: p < 0.001).
Fig. B.
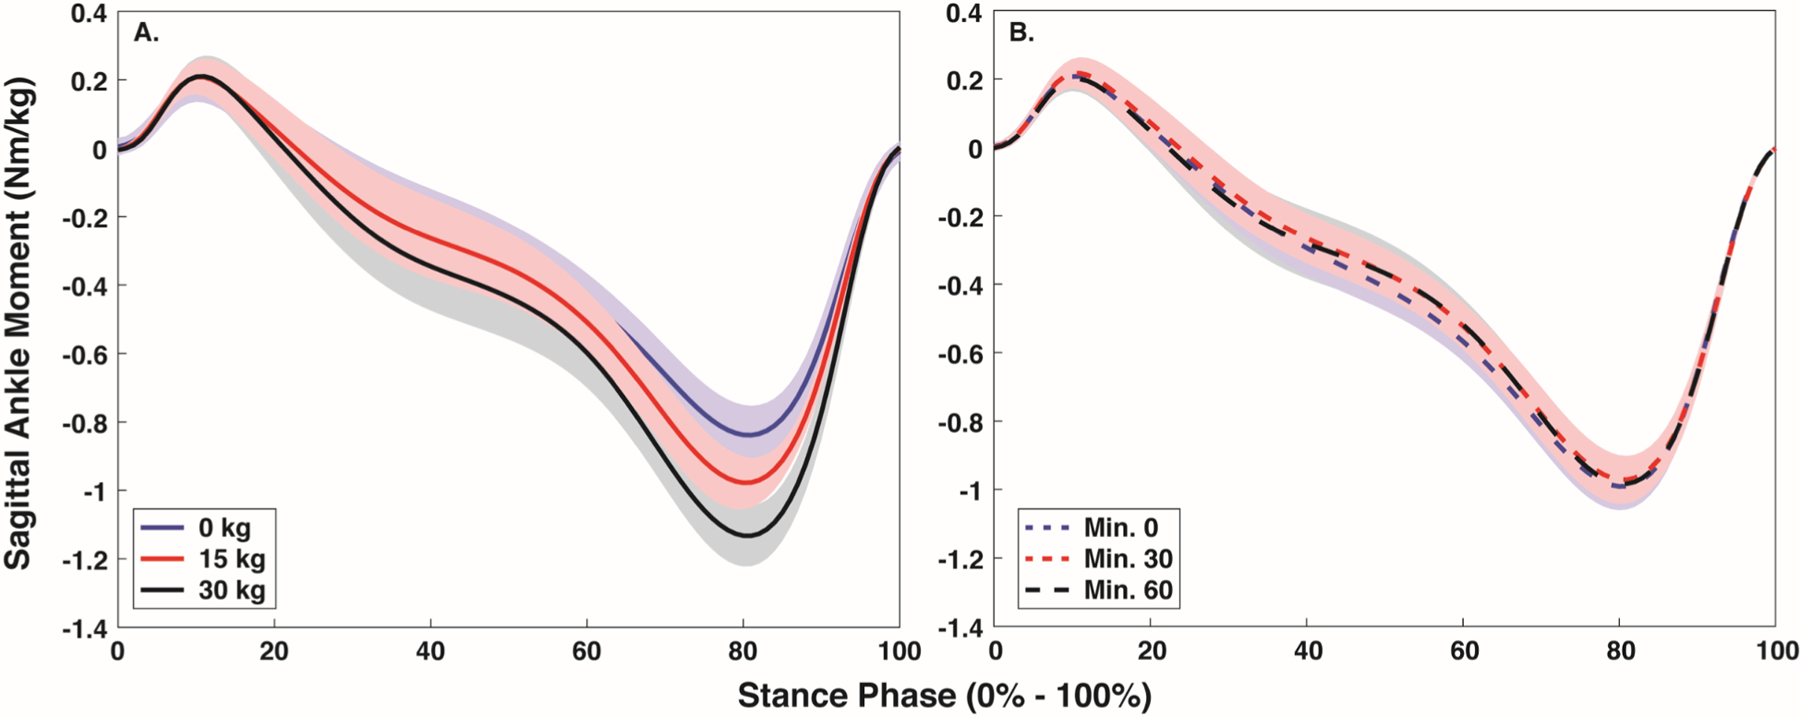
Mean (SD) stance phase (0% - 100%) sagittal plane ankle moment with each body borne load (0, 15, and 30 kg) (A) and at each time point (minute 0, 30, and 60) (B).
Footnotes
Publisher's Disclaimer: This is a PDF file of an unedited manuscript that has been accepted for publication. As a service to our customers we are providing this early version of the manuscript. The manuscript will undergo copyediting, typesetting, and review of the resulting proof before it is published in its final form. Please note that during the production process errors may be discovered which could affect the content, and all legal disclaimers that apply to the journal pertain.
Conflict of Interest Disclosure
None
REFERENCES
- Baggaley M, Esposito M, Xu C, Unnikrishnan G, Reifman J, Edwards WB, 2020. Effects of load carriage on biomechanical variables associated with tibial stress fractures in running. Gait Posture 77, 190–194. 10.1016/j.gaitpost.2020.01.009 [DOI] [PubMed] [Google Scholar]
- Birrell SA, Hooper RH, Haslam RA, 2007. The effect of military load carriage on ground reaction forces. Gait Posture 26, 611–614. [DOI] [PubMed] [Google Scholar]
- Burr DB, Milgrom C, Fyhrie D, Forwood M, Nyska M, Finestone A, Hoshaw S, Saiag E, Simkin A, 1996. In vivo measurement of human tibial strains during vigorous activity. Bone 18, 405–410. [DOI] [PubMed] [Google Scholar]
- Dempster WT, Gabel WC, Felts WJ, 1959. The anthropometry of the manual workspace for the seated subject. Am. J. Phys. Anthropol 17, 289–317. [DOI] [PubMed] [Google Scholar]
- Edwards WB, Taylor D, Rudolphi TJ, Gillette JC, Derrick TR, 2009. Effects of Stride Length and Running Mileage on a Probabilistic Stress Fracture Model. Med. Sci. Sport. Exerc 41, 2177–2184. 10.1249/MSS.0b013e3181a984c4 [DOI] [PubMed] [Google Scholar]
- Farris DJ, Sawicki GS, 2012. The mechanics and energetics of human walking and running: a joint level perspective. J. R. Soc. Interface 9, 110–118. 10.1098/rsif.2011.0182 [DOI] [PMC free article] [PubMed] [Google Scholar]
- Grood ES, Suntay WJ, 1983. A joint coordinate system for the clinical description of three-dimensional motions: application to the knee. J. Biomech. Eng 105, 136–144. [DOI] [PubMed] [Google Scholar]
- Hadid A, Epstein Y, Shabshin N, Gefen A, 2018. Biomechanical Model for Stress Fracture–related Factors in Athletes and Soldiers. Med. Sci. Sport. Exerc 50, 1827–1836. 10.1249/MSS.0000000000001628 [DOI] [PubMed] [Google Scholar]
- Hamner SR, Seth A, Delp SL, 2010. Muscle contributions to propulsion and support during running. J. Biomech 43, 2709–2716. 10.1016/j.jbiomech.2010.06.025 [DOI] [PMC free article] [PubMed] [Google Scholar]
- Hommel G, 1988. A stagewise rejective multiple test procedure based on a modified Bonferroni test. Biometrika 75, 383–386. 10.1093/biomet/75.2.383 [DOI] [Google Scholar]
- Honert EC, Zelik KE, 2016. Inferring Muscle-Tendon Unit Power from Ankle Joint Power during the Push-Off Phase of Human Walking: Insights from a Multiarticular EMG-Driven Model. PLoS One 11, e0163169. 10.1371/journal.pone.0163169 [DOI] [PMC free article] [PubMed] [Google Scholar]
- Lanyon LE, Hampson WGJ, Goodship AE, Shah JS, 1975. Bone deformation recorded in vivo from strain gauges attached to the human tibial shaft. Acta Orthop 46, 256–268. 10.3109/17453677508989216 [DOI] [PubMed] [Google Scholar]
- Lidstone DE, Stewart JA, Gurchiek R, Needle AR, Van Werkhoven H, McBride JM, 2017. Physiological and biomechanical responses to prolonged heavy load carriage during level treadmill walking in females. J. Appl. Biomech 33, 248–255. 10.1123/jab.2016-0185 [DOI] [PubMed] [Google Scholar]
- Lobb NJ, Fain ALC, Seymore KD, Brown TN, 2019. Sex and stride length impact leg stiffness and ground reaction forces when running with body borne load. J. Biomech 86, 96–101. 10.1016/j.jbiomech.2019.01.048 [DOI] [PubMed] [Google Scholar]
- Matijevich ES, Branscombe LM, Scott LR, Zelik KE, 2019. Ground reaction force metrics are not strongly correlated with tibial bone load when running across speeds and slopes: Implications for science, sport and wearable tech. PLoS One 14, e0210000. 10.1371/journal.pone.0210000 [DOI] [PMC free article] [PubMed] [Google Scholar]
- Milgrom C, Radeva-Petrova DR, Finestone A, Nyska M, Mendelson S, Benjuya N, Simkin A, Burr D, 2007. The effect of muscle fatigue on in vivo tibial strains. J. Biomech 40, 845–850. 10.1016/J.JBIOMECH.2006.03.006 [DOI] [PubMed] [Google Scholar]
- Milner CE, Ferber R, Pollard CD, Hamill J, Davis IS, 2006. Biomechanical factors associated with tibial stress fracture in female runners. Med. Sci. Sports Exerc 38, 323–328. 10.1249/01.mss.0000183477.75808.92 [DOI] [PubMed] [Google Scholar]
- Orr RM, Johnston V, Coyle J, Pope R, 2015. Reported load carriage injuries of the Australian army soldier. J. Occup. Rehabil 25, 316–322. 10.1007/s10926-014-9540-7 [DOI] [PubMed] [Google Scholar]
- Ramsay JW, Hancock CL, O’Donovan MP, Brown TN, 2016. Soldier-relevant body borne loads increase knee joint contact force during a run-to-stop maneuver. J. Biomech 49, 3868–3874. 10.1016/j.jbiomech.2016.10.022 [DOI] [PubMed] [Google Scholar]
- Sasimontonkul S, Bay BK, Pavol MJ, 2007. Bone contact forces on the distal tibia during the stance phase of running. J. Biomech 40, 3503–3509. 10.1016/j.jbiomech.2007.05.024 [DOI] [PubMed] [Google Scholar]
- Schaffler MB, Radin EL, Burr DB, 1989. Mechanical and morphological effects of strain rate on fatigue of compact bone. Bone 10, 207–214. 10.1016/8756-3282(89)90055-0 [DOI] [PubMed] [Google Scholar]
- Scott SH, Winter DA, 1990. Internal forces at chronic running injury sites. Med. Sci. Sport. Exerc 22, 357–39. [PubMed] [Google Scholar]
- Seymore KD, Fain ALC, Lobb NJ, Brown TN, 2019. Sex and limb impact biomechanics associated with risk of injury during drop landing with body borne load. PLoS One 14, e0211129. 10.1371/journal.pone.0211129 [DOI] [PMC free article] [PubMed] [Google Scholar]
- US General Accounting Office, 1997. Military Attrition: DOD Could Save Millions by Better Screening Enlisted Personnel Washington, DC. [Google Scholar]
- Wang H, Frame J, Ozimek E, Leib D, Dugan EL, 2013. The effects of load carriage and muscle fatigue on lower-extremity joint mechanics. Res. Q. Exerc. Sport 84, 305–312. 10.1080/02701367.2013.814097 [DOI] [PubMed] [Google Scholar]
- Wang H, Frame J, Ozimek E, Leib D, Dugan EL, 2012. Influence of fatigue and load carriage on mechanical loading during walking. Mil. Med 177, 152–156. [DOI] [PubMed] [Google Scholar]
- Willy R, Pohl MPTMB, Davis IS, 2008. Calculation of Vertical Load Rates in the Absence of Vertical Impact Peaks, in: American Society of Biomechanics Meeting. Ann Arbor, MI. [Google Scholar]
- Xu C, Silder A, Zhang J, Hughe J, Unnikrishnan G, Reifman J, Rakesh V, 2016. An Integrated Musculoskeletal-Finite-Element Model to Evaluate Effects of Load Carriage on the Tibia During Walking. J. Biomech. Eng 138. 10.1115/1.4034216 [DOI] [PubMed] [Google Scholar]


