

Abstract
Purpose:
To describe changes in bladder health, defined as “a complete state of physical, mental, and social well-being related to bladder function that permits daily activities, adapts to short-term stressors, and allows optimal well-being,” in women over time.
Materials and Methods:
We used data on 15 lower urinary tract symptoms (LUTS) and interference from urinary experiences assessed at the baseline and five-year follow-up interviews of the Boston Area Community Health (BACH) Survey to estimate changes in bladder health over time in women. Associations between baseline and follow-up bladder health (defined as the maximum frequency of LUTS or interference at each time point) were calculated by ordinal logistic regression and generalized linear models.
Results:
2,526 women provided complete information on bladder health at baseline and follow-up. Over the five-year follow-up, 6.5% of women maintained optimal bladder health (no LUTS or interference), 33.6% developed worse bladder health (including 10.4% who transitioned from optimal to less than optimal health), 31.4% maintained their less than optimal bladder health status, and 28.7% improved. Despite these changes, women with poorer bladder health at baseline were still more likely to have poorer bladder health five years later (e.g., multivariable-adjusted relative risk=3.27, 95% confidence interval: 2.49-4.29 for severe LUTS/interference at follow-up among those with severe LUTS/interference at baseline).
Conclusions:
Findings from our large secondary analysis of BACH Survey data suggest considerable variability in bladder health over time, and underscore the importance of bladder health promotion to prevent the initial onset and progression of poor bladder health in women.
Keywords: lower urinary tract symptoms, Urinary tract infections, Bladder, prevention, female, epidemiology, Urology, Urogynecology, longitudinal
INTRODUCTION
Health, as defined by the World Health Organization, is “a state of complete physical, mental, and social well-being and not merely the absence of disease and infirmity.”1 This definition has been extended to several individual organs, including the heart,2 brain,3 and, most recently, the bladder.4 Specifically, members of the Prevention of Lower Urinary Tract Symptom Research Consortium developed the following research bladder health definition: “A complete state of physical, mental, and social well-being related to bladder function and not merely the absence of lower urinary tract symptoms (LUTS).” This state “permits daily activities, adapts to short-term physical or environmental stressors, and allows optimal well-being (e.g., travel, exercise, social, occupational, or other activities).”4 The Consortium also applied this definition to the three main functions of the bladder (“storage,” “emptying,” and “bioregulatory”) and described unhealthy characteristics of each function.5
To begin to inform and quantify the spectrum of bladder health, we recently took advantage of data from the Boston Area Community Health (BACH) Survey to estimate a crude distribution of bladder health in community-based women. Using information on LUTS and bladder function-related well-being (measured by interference with activities from urinary experiences), we found that approximately one in five women might be considered to have optimal bladder health (no LUTS or interference), three in five to have intermediate health (intermediate frequencies of LUTS/interference), and one in five to have poor bladder health (LUTS/interference all the time).6 This distribution was essentially unchanged when we used number rather than frequency of LUTS and additional measures of bladder function-related well-being, including life impact, bladder-related thought, and perception of bladder condition.7
Together, these findings provide preliminary insight into the spectrum of bladder health and suggest wide variability across women. However, no studies, to our knowledge, have examined variability in bladder health over time. Therefore, we used data from the baseline and 5-year follow-up interviews of BACH to describe changes over time.
METHODS
Study population and design
The BACH Survey is a population-based, longitudinal study of Boston residents. Participants were sampled randomly using a two-stage cluster design, with stratification by sex, race/ethnicity (equally distributed across Black, Hispanic, and White), and age (30-39, 40-49, 50-59, and 60-79 years). 5,506 (3,205 female and 2,301 male) of 8,702 eligible participants completed the baseline visit from 2002-5. This visit included an in-home interview, self-administered questionnaire, and measurement of height, weight, and waist circumference.8 Visit procedures were repeated at the follow-up visit approximately five years later (2008-10).
We limited the present analysis to female participants who completed the baseline and follow-up interviews and provided information on at least one LUTS and one interference item at baseline and follow-up. BACH was approved by the New England Research Institutes Institutional Review Board and all participants provided written informed consent.
LUTS assessment
At baseline and follow-up, participants completed questions on several aspects of bladder dysfunction, including storage (e.g., urgency incontinence, nocturia, bladder-filling pain), emptying (e.g., hesitancy, incomplete emptying, and urination-related pain), and bioregulatory (e.g., urinary tract infections [UTIs]) dysfunction. As most of these aspects of bladder dysfunction are symptoms, we refer to them hereafter as “LUTS” for simplicity. LUTS were assessed using the American Urological Association Symptom Index,9 Sandvik Incontinence Severity Scale,10 Interstitial Cystitis Symptom Index,11 and items written specifically for BACH. Items with ≤20% disagreement across responses were combined to create 15 distinct LUTS, using the maximum response from any of the contributing items to capture LUTS frequency (Appendix Table 1).
Well-being assessment
Bladder function-related well-being was assessed in all women irrespective of whether or not they endorsed LUTS by the interference with activities domain of the Epstein Quality of Life Questionnaire for benign prostatic hyperplasia.12 This validated scale, which was administered at both baseline and follow-up, queries the frequency of interference from urinary problems in the past month with seven activities. It was modified for BACH to refer to urinary “problems” as “experiences” and to include interference due to pain or discomfort in the pubic area to increase its relevance for interstitial cystitis/bladder pain syndrome.13 The Epstein scale has been used extensively for participants of both sexes in BACH.13-16
Statistical analysis
For all analyses, we weighted observations inversely proportional to their probability of selection into BACH, with further post-stratification to the Boston population using the 2000 US Census.8
To investigate changes in bladder health between the baseline and follow-up interviews, we used data on the maximum frequency of LUTS (across 15 symptoms) and interference (across seven activities) to create five bladder health categories at baseline and follow-up: 1) no LUTS or interference (i.e., optimal bladder health); 2) mild LUTS (maximum of “rarely”) or interference (maximum of “a little”); 3) moderate LUTS (“a few times”) or interference (“some of the time”); 4) severe LUTS (“fairly often” or “usually”) or interference (“most of the time”); and 5) very severe LUTS (“almost always”) or interference (“all of the time”).6,7 Women who reported past or current bladder conditions/treatment were included in the highest category irrespective of their symptoms. We also explored changes in bladder health over time by calculating a continuous bladder health score at baseline and follow-up. This score was calculated as the sum of standardized scores for LUTS (sum of the frequency of 12 LUTS [scales from 0 to 4/5]) and interference (sum of the frequency of interference with seven activities [scales of 0-4]12), for a combined score ranging from 0 (best) to 56 (worst bladder health).6
To investigate whether baseline bladder health is associated with changes in bladder health over time, we used ordinal logistic regression and generalized linear models to calculate crude- and multivariable-adjusted odds ratios (ORs) and relative risks (RRs), respectively. We also performed stratified analyses by age group and sensitivity analyses excluding women with: 1) known past or current bladder conditions/treatment (current LUTS medications, previous incontinence or bladder surgery, chronic indwelling catheterization, and bladder cancer), as their exact position on the bladder health distribution was assumed, not known based on their untreated LUTS/well-being; and 2) non-bladder conditions that might contribute to LUTS or interference (genitourinary cancers besides bladder cancer, prolapse of the uterus, “bladder, or rectum”, congenital urinary tract abnormalities [many of which are renal17,18], endometriosis, pelvic inflammatory disease, chronic pelvic pain, vulvodynia, and diabetes). Analyses were performed using R v3.2.4 and SAS® 9.3.
RESULTS
Of the 3,205 female participants interviewed at baseline, 2,534 were interviewed approximately 5 years later, and 2,526 provided information on LUTS and interference at both time points. The majority of included participants were young to middle-aged, parous, former or current smokers, and overweight or obese (Appendix Table 2). Compared to excluded participants, included participants were more likely to be White, peri-menopausal, former or current smokers, and consumers of 1-2 alcoholic beverages/day, with greater health-related limitations in activities, and a lesser likelihood of comorbid conditions. They also reported a slightly higher prevalence of LUTS, but a lower prevalence of interference with activities.
At baseline, a similar distribution of bladder health was observed as in previous analyses: 16.8% reported optimal bladder health (no LUTS or interference), 61.0% reported intermediate health (15.3% mild LUTS/interference, 21.9% moderate LUTS/interference, and 23.8% severe LUTS/interference), and 22.3% reported poor bladder health (LUTS/interference all the time; Figure 1). When bladder health was examined as a continuous measure, the distribution was skewed to the right with a median value of 2.4 (interquartile range [IQR]=0.5-7.7 out of 0-56).
Figure 1:
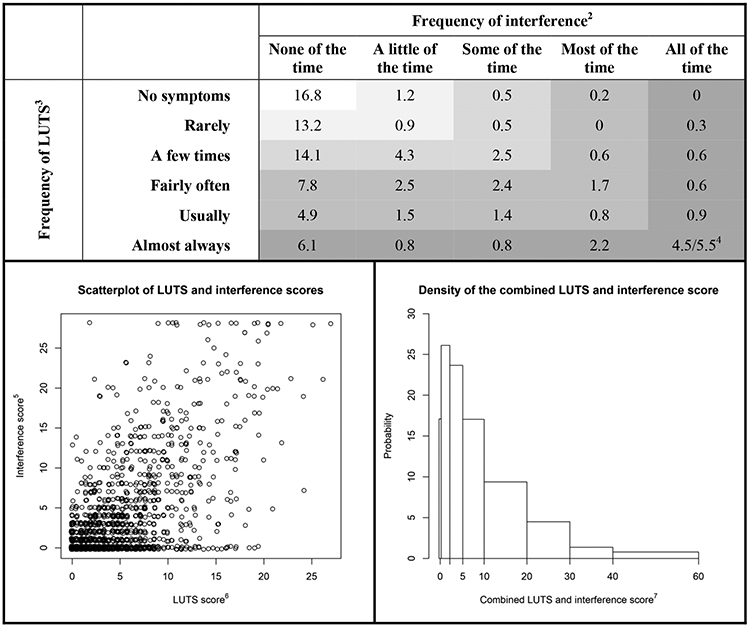
Joint distribution1 of LUTS and interference with activities from urinary experiences, pain, or discomfort in the pubic area in the past month in a community-based sample of 2,526 women; Boston Area Community Health Survey, 2002-2005.
LUTS=lower urinary tract symptom.
1 All values were weighted according to the sampling weights of the Boston Area Community Health Survey.
2 Maximum frequency of interference across seven activities.
3 Maximum frequency of LUTS across 12 LUTS (urinating again after <2 hours; perceived frequency; nocturia; any incontinence [in the past year]; dribbling/wet clothes after urination; urgency/difficulty postponing urination; pain, burning, discomfort in the pubic/bladder area; straining/difficult to begin voiding; weak stream; intermittency; incomplete emptying; and urinary tract infections [in the past year]).
4 Represents the percentage of women with self-reported current or past bladder conditions (i.e., use of current LUTS medications, previous incontinence or bladder surgery, chronic indwelling catheterization, or bladder cancer).
5 Calculated by summing the frequency of interference (0-4) with each of the seven activities (range: 0-28).
6 Calculated by summing the frequency of 12 LUTS (range: 0-56) and then standardizing to the same scale as interference. The correlation between LUTS and interference scores was 0.66.
7 Calculated as the sum of the LUTS and interference scores (range: 0-56).
Considering changes in bladder health over time, only a small percentage of women (6.5%) reported optimal bladder health at baseline and follow-up (Figure 2). Approximately one third (33.6%) developed worse bladder health, including 10.4% who transitioned from optimal to less than optimal bladder health. This reflects an incidence of 61.5% worsened bladder health among those with optimal bladder health at baseline (20.1% to mild LUTS/interference, 18.3% to moderate LUTS/interference, 13.0% to severe LUTS/interference, and 10.1% to very severe LUTS/interference). In contrast, 28.7% of participants improved in bladder health, including 11.0% who resolved their LUTS or interference completely; these values are 34.5% and 13.2%, respectively, when limited to women with LUTS/interference at baseline rather than all participants. A further 31.4% of participants maintained the same bladder health category as at baseline. Combining all women, approximately one third (37.9%) remained in the same bladder health category over time, one third (33.6%) worsened, and approximately one third improved (28.7%), resulting in generally similar distributions of bladder health at baseline and follow-up. These distributions shifted slightly more towards worsening with older age (Appendix Table 3) and slightly more towards changes in bladder health (improvement and worsening) when women with current or past bladder conditions and those that might influence LUTS or interference were excluded from the analyses (data not shown). When we modeled bladder health as a continuous measure, the mean change was 0.7 (standard deviation=8.0) over follow-up (Appendix Figure 1), with a correlation between baseline and follow-up bladder health of 0.50.
Figure 2:

Changes in the joint distribution1 of lower urinary tract symptoms2 (LUTS) and interference with activities from urinary experiences, pain, or discomfort in the pubic area3 at baseline and 5 years later in a community-based sample of 2,526 adult women; Boston Area Community Health Survey, 2002-10.
1 All values were weighted according to the sampling weights of the Boston Area Community Health Survey.
2 Maximum frequency of LUTS across 12 LUTS (urinating again after <2 hours; perceived frequency; nocturia; any incontinence [in the past year]; dribbling/wet clothes after urination; urgency/difficulty postponing urination; pain, burning, discomfort in the pubic/bladder area; straining/difficult to begin voiding; weak stream; intermittency; incomplete emptying; and urinary tract infections [in the past year]).
3 Maximum frequency of interference across seven activities.
4 Defined as a maximum frequency of LUTS of “rarely” or a maximum frequency of interference of “a little of the time”.
5 Defined as a maximum frequency of LUTS of “a few times” or a maximum frequency of interference of “some of the time”.
6 Defined as a maximum frequency of LUTS of “fairly often” or “usually,” or a maximum frequency of interference of “most of the time”.
7 Defined as a maximum frequency of LUTS of “almost always,” a maximum frequency of interference of “all of the time,” or a self-reported current or past bladder condition or treatment (i.e., use of current LUTS medications, previous incontinence or bladder surgery, chronic indwelling catheterization, or bladder cancer).
8 Represents the percentage of women based on self-reported LUTS and interference.
9 Represents the percentage of women based on self-reported current or past bladder conditions or treatment.
Changes in bladder health, including worsening, maintenance, and improvement, were observed in almost all categories of bladder health (Figure 2). However, women with better bladder health at baseline were more likely to worsen (the only direction of change possible for many of them) and women with poorer bladder health at baseline were more likely to improve. Overall, these patterns resulted in inverse associations between poorer baseline bladder health categories and risks of worsening or worsening and maintained bladder health over time (e.g., multivariable-adjusted RR=0.55, 95% confidence interval [CI]: 0.49-0.63 for worsening or maintained LUTS/interference in women with very severe LUTS/interference at baseline, Table 1). Nevertheless, women in a poorer bladder health category at baseline were still more likely to be in a poorer bladder health category at follow-up than women in better categories (e.g., multivariable-adjusted OR=15.2, 95% CI: 9.55-24.3 per higher LUTS/interference category at follow-up in women with very severe LUTS/interference at baseline). They were also more likely to have severe or very severe LUTS or interference at follow-up (e.g., RR=3.27, 95% CI: 2.49-4.29 in women with very severe LUTS/interference at baseline). Similar patterns of associations were observed when LUTS and interference were examined separately, and when women with a history of bladder conditions or treatment were excluded from the analyses (data not shown).
Table 1:
Associations1 between LUTS and interference with activities from urinary experiences, pain, or discomfort in the pubic area at baseline and 5 years later in 2,269 adult women; Boston Area Community Health Survey, 2002-10.
| Baseline category of LUTS2 and interference3 | Unadjusted RR (95% CI) | Adjusted RR4 (95% CI) |
|---|---|---|
| Relative risks of worsening LUTS or interference at follow-up | ||
| No LUTS or interference | 1.00 | 1.00 |
| Mild LUTS or interference5 | 0.83 (0.69-1.00) | 0.84 (0.71-0.99) |
| Moderate LUTS or interference6 | 0.61 (0.47-0.79) | 0.59 (0.47-0.74) |
| Severe LUTS or interference7 | 0.47 (0.36-0.61) | 0.48 (0.37-0.61) |
| Very severe LUTS or interference8 | N/A | N/A |
| Relative risks of worsening or maintained LUTS or interference at follow-up | ||
| No LUTS or interference | 1.00 | 1.00 |
| Mild LUTS or interference5 | 0.75 (0.68-0.83) | 0.75 (0.68-0.83) |
| Moderate LUTS or interference6 | 0.69 (0.62-0.77) | 0.68 (0.61-0.76) |
| Severe LUTS or interference7 | 0.57 (0.50-0.64) | 0.55 (0.49-0.63) |
| Very severe LUTS or interference8 | N/A | N/A |
|
Odds ratios of being in a higher LUTS/interference category at follow-up
(per category at follow-up, e.g., moderate versus mild) | ||
| No LUTS or interference | 1.00 | 1.00 |
| Mild LUTS or interference5 | 1.57 (1.08- 2.29) | 1.49 (1.02- 2.19) |
| Moderate LUTS or interference6 | 2.76 (1.83- 4.15) | 2.63 (1.74- 3.96) |
| Severe LUTS or interference7 | 5.47 (3.52- 8.49) | 4.97 (3.15- 7.84) |
| Very severe LUTS or interference8 | 19.8 (12.4-31.8) | 15.2 (9.55-24.3) |
| Relative risks of being in the highest LUTS/interference categories (severe or very severe) at follow-up | ||
| No LUTS or interference | 1.00 | 1.00 |
| Mild LUTS or interference5 | 1.15 (0.79-1.66) | 1.16 (0.82-1.64) |
| Moderate LUTS or interference6 | 1.67 (1.17-2.37) | 1.62 (1.15-2.28) |
| Severe LUTS or interference7 | 2.55 (1.87-3.48) | 2.49 (1.86-3.34) |
| Very severe LUTS or interference8 | 3.63 (2.75-4.79) | 3.27 (2.49-4.29) |
CI=confidence interval; LUTS=lower urinary tract symptoms; OR=odds ratio; RR=relative risk.
All values were weighted according to the sampling weights of the Boston Area Community Health Survey.
Maximum frequency of LUTS across 12 LUTS (urinating again after <2 hours; perceived frequency; nocturia; any incontinence [in the past year]; dribbling/wet clothes after urination; urgency/difficulty postponing urination; pain, burning, discomfort in the pubic/bladder area; straining/difficult to begin voiding; weak stream; intermittency; incomplete emptying; and urinary tract infections [in the past year]).
Maximum frequency of interference across seven activities.
Adjusted for age (26-44, 45-64, or ≥65 years); race/ethnicity (Black, Hispanic, or White); menopausal status (pre-menopausal/undetermined, peri-menopausal, post-menopausal, or surgical); parity (0, 1-3, or ≥4 pregnancies); smoking status (current, former, or never smoker); alcohol intake (<1, 1-2, or ≥3 drinks); body mass index (<25, 25-29, or ≥30 kg/m2); waist circumference (<65, 65-89, 90-114, or ≥115 cm); health-related limitations in activities (not at all, a little, or a lot); self-reported physician diagnoses of high blood pressure, types I or II diabetes, cardiovascular disease, and arthritis; and depressive symptoms (yes or no) at follow-up.
Defined as a maximum frequency of LUTS of “rarely” or a maximum frequency of interference of “a little of the time”.
Defined as a maximum frequency of LUTS of “a few times” or a maximum frequency of interference of “some of the time”.
Defined as a maximum frequency of LUTS of “fairly often” or “usually,” or a maximum frequency of interference of “most of the time”.
Defined as a maximum frequency of LUTS of “almost always,” a maximum frequency of interference of “all of the time,” or a self-reported current or past bladder condition or treatment (i.e., use of current LUTS medications, previous incontinence or bladder surgery, chronic indwelling catheterization, or bladder cancer).
DISCUSSION
In this large, regionally-representative analysis of bladder health in American women, we observed considerable variability in bladder health over time. Only a small percentage of women (6.5%) had optimal bladder health over five years, although a considerable percentage improved over time (28.7%). The remaining women either maintained their bladder health status (31.4%), or worsened (33.6%), including 10.4% who transitioned from optimal to less than optimal health. Worsening, maintenance, and improvement were observed in almost all categories of bladder health, although women with LUTS/interference at baseline were more likely to have LUTS/interference at the 5-year follow-up interview and to be in a higher LUTS/interference category, including severe or very severe LUTS/interference, than women without LUTS/interference at baseline.
To our knowledge, our study is one of the first to examine the incidence of worsening bladder health and changes in bladder health over time (assessed by both LUTS and interference), precluding direct comparisons to findings from previous studies. However, several prior studies have examined LUTS incidence or changes in LUTS over time,19-27 allowing us to make, at least, partial comparisons. Despite differences in LUTS examined, definitions of LUTS and LUTS change used, frequency of LUTS assessment, and length of follow-up time, our findings of considerable variability over time are similar to those from previous studies, most of which observed LUTS incidence and/or progression over time (0.4-37.5%), as well as some degree of regression or resolution (7.8-56.0% improved among those with LUTS at baseline).19-27 Notably, many of these studies also observed changes in LUTS in almost all baseline LUTS categories.19-22,24
While the development or progression of LUTS has been studied extensively, remission or resolution of LUTS or, in our case, improvement in bladder health, is much less well-studied. Several potential factors may explain this phenomenon. The first of these is treatment. Although we grouped women who underwent LUTS surgery or used LUTS medications in the highest bladder health category and did not allow them to change categories over time, it is possible that other therapies or management strategies not captured on BACH questionnaires (e.g., vaginal estrogen, biofeedback, and medications for diabetes, anxiety, and depression) may have contributed to improvement in bladder health over time. Changes in some conditions or states (e.g., pregnancy, menopausal transition) may have also resulted in remission of LUTS and/or interference. A second possible explanation is adaptation to LUTS, leading to reduced interference. Possible adaptations include avoiding factors that trigger LUTS, using absorptive incontinence products, modifying fluid intake and type, discontinuing certain activities, and accepting LUTS as a “normal” part of aging. A third possibility is natural regression or resolution of LUTS and/or interference and regression to the mean, and a fourth is behavioral modification to reduce LUTS and interference. Currently, only a few such options are known (e.g., weight loss and pelvic floor muscle exercises), but this possibility is encouraging and should be explored further to inform secondary prevention strategies.
Although we observed that some women in all categories of baseline bladder health improved over time, women in poorer categories of bladder health at baseline were significantly more likely to be in poorer categories of bladder health five years later than women in initially better categories. This same association has also been observed for LUTS in previous studies. Specifically, women with a greater frequency of urinary incontinence at baseline were more likely to have persistent or worsening urinary incontinence over time than women with lower frequencies of or without urinary incontinence in the few previous studies that have examined this association to date.21,25,28 Together, these findings underscore the importance of maintaining good bladder health and support the need for early interventions to promote good bladder health and prevent bladder health deterioration over time (i.e., primary prevention strategies).
Our analysis takes advantage of several strengths of the BACH Survey to investigate changes in bladder health over time. These include its large sample size; representative sampling of community-dwelling women; racial/ethnic diversity; extensive collection of information on LUTS and bladder conditions/therapies; rare collection of bladder function-related well-being on all women irrespective of LUTS; and five-year follow-up. Limitations of our analysis include its use of a crude measure of bladder health that does not take into account other elements of bladder health, such as emotional aspects of bladder function-related well-being and ability to adapt to short-term stressors; reliance on self-reported LUTS and interference data; and lack of information on LUTS, interference, and factors that influence these two variables in the five years between interviews.
In summary, our findings demonstrate considerable variability in bladder health over time, with the potential for worsening, maintenance, and improvement, even in the absence of LUTS therapy. Together with our observed positive associations between poorer bladder health categories at baseline and follow-up, these findings suggest the need for additional primary and secondary prevention efforts to promote good bladder health and prevent the initial onset and progression of poor bladder health.
Supplementary Material
ACKNOWLEDGMENTS
This work was supported by the National Institute of Diabetes and Digestive and Kidney Diseases (NIDDK) at the National Institutes of Health (NIH) by cooperative agreements [grants U24DK106786, U01 DK106853, U01 DK106858, U01 DK106898, U01 DK106893, U01 DK106827, U01 DK106908, U01 DK106892, U01 DK126045]. Additional funding from: National Institute on Aging, NIH Office of Research on Women’s Health.
The BACH Survey was conducted by the BACH Survey Investigators and supported by the NIDDK. The data from the BACH Survey reported here were supplied by the NIDDK Central Repository. This manuscript was not prepared in collaboration with Investigators of the BACH Survey and does not necessarily reflect the opinions or views of the BACH Survey, the NIDDK Central Repository, or the NIDDK. The content of this article is solely the responsibility of the authors.
We thank Sarah Lindberg for assisting with data management and cleaning. We also thank the Prevention of Lower Urinary Tract Symptoms (PLUS) Research Consortium Investigators:
Glossary
- LUTS
lower urinary tract symptoms
- BACH
Boston Area Community Health
- UTIs
urinary tract infections
- IQR
interquartile range
- CI
Confidence Interval
- OR
Odds Ratio
- RR
Risk Ratio
Appendix
Loyola University Chicago - Maywood, IL (U01DK106898)
Multi-Principal Investigators: Linda Brubaker, MD; Elizabeth R. Mueller, MD, MSME
Investigators: Marian Acevedo-Alvarez, MD; Colleen M. Fitzgerald, MD, MS; Cecilia T. Hardacker, MSN, RN, CNL; Jeni Hebert-Beirne, PhD, MPH; Missy Lavender, MBA; David A. Shoham, PhD, MSPH.
Northwestern University - Chicago IL (U01DK126045)
Multi-Principal Investigators: Kimberly Sue Kenton, MD; James W. Griffith, PhD; Melissa Simon, MD, MPH
Investigator: Patricia I Moreno, PhD.
University of Alabama at Birmingham - Birmingham, AL (U01DK106858)
Principal Investigator: Alayne D. Markland, DO, MSc
Investigators: Tamera Coyne-Beasley, MD, MPH, FAAP, FSAHM; Kathryn L. Burgio, PhD; Cora E. Lewis, MD, MSPH; Gerald McGwin, Jr., MS, PhD; Camille P. Vaughan, MD, MS; Beverly Rosa Williams, PhD.
University of California San Diego - La Jolla, CA (U01DK106827)
Principal Investigator: Emily S. Lukacz, MD
Investigators: Sheila Gahagan, MD, MPH; D. Yvette LaCoursiere, MD, MPH; Jesse Nodora, DrPH.
University of Michigan - Ann Arbor, MI (U01DK106893)
Principal Investigator: Janis M. Miller, PhD, APRN, FAAN
Investigators: Lawrence Chin-I An, MD; Lisa Kane Low, PhD, CNM, FACNM, FAAN.
University of Minnesota (Scientific and Data Coordinating Center) - Minneapolis MN (U24DK106786)
Multi-Principal Investigators: Bernard L. Harlow, PhD; Kyle D. Rudser, PhD
Investigators: Sonya S. Brady, PhD; Haitao Chu, MD, PhD; Melissa L. Constantine, PhD, MPAff; Cynthia S. Fok, MD, MPH; Peter Scal, PhD; Todd Rockwood, PhD.
University of Pennsylvania – Philadelphia, PA (U01DK106892)
Principal Investigator: Multi-Principal Investigators: Diane K. Newman, DNP FAAN; Ariana L. Smith, MD
Investigators: Amanda Berry, MSN, CRNP; C. Neill Epperson, MD; Heather Klusaritz, PhD, MSW; Kathryn H. Schmitz, PhD, MPH, FACSM, FTOS; Ann E. Stapleton, MD; Jean F. Wyman, PhD.
Washington University in St. Louis - Saint Louis, MO (U01DK106853)
Principal Investigator: Siobhan Sutcliffe, PhD, ScM, MHS
Investigators: Aimee S. James, PhD, MPH; Jerry L. Lowder, MD, MSc; Melanie R. Meister, MD, MSCI.
Yale University - New Haven, CT (U01DK106908)
Principal Investigator: Leslie M. Rickey, MD, MPH
Investigators: Marie A. Brault, PhD (Dec. 2020-); Deepa R. Camenga, MD, MHS; Shayna D. Cunningham, PhD.
Steering Committee Chair: Linda Brubaker, MD. UCSD, San Diego. (January 2021-)
NIH Program Office: National Institute of Diabetes and Digestive and Kidney Diseases, Division of Kidney, Urologic, and Hematologic Diseases, Bethesda, MD.
NIH Project Scientist: Julia Barthold, MD; Past project scientist: Tamara Bavendam MD, MS (July 2015- Dec 2020)
Appendix
Appendix Table 1:
Lower urinary tract symptoms assessed in the Boston Area Community Health Survey at baseline and 5 years later at follow-up, 2002-2010.
| Items collected in the BACH Survey | Collapsed items |
|---|---|
| Urinate again less than two hours after you finished urinating in the past month1 | Urinating again after <2 hours in the past month (frequency) |
| Frequent urination during the day in the past month1 | Perceived frequency in the past month |
| Get up to urinate more than once during the night in the past month | Nocturia in the past month |
| Number of times you accidentally leaked urine when you were performing some physical activity such as coughing, sneezing, lifting, or exercise, in the past 7 days | Stress incontinence in the past week |
| Number of times you accidentally leaked urine when you had the strong feeling that you needed to empty your bladder but you couldn’t get to the toilet fast enough in the past 7 days | Urgency incontinence in the past week |
| Number of times you accidentally leaked urine without any particular physical activity or warning in the past 7 days | Non-stress, non-urgency incontinence in the past week |
| Leaked even a small amount of urine in the past 12 months, including frequency and amount | Any incontinence in the past year |
| Baseline: Dribbling after urination in the past month2 Follow-up: Urine leakage almost immediately after you have finished urinating and walked away from the toilet in the past month?3 Follow-up: A prolonged trickle or dribble at the end of your urine flow in the past month?3 Baseline: Wet clothes because of dribbling after urination in the past month2 |
Dribbling/wet clothes after urination in the past month |
| Difficulty postponing urination in the past month4 | Urgency/difficulty postponing urination in the past month |
| Strong urge or pressure to urinate immediately, with no, or little warning in the past month4 | |
| Strong urge or pressure that signaled the need to urinate immediately, whether or not you urinated or leaked urine in the past 7 days | ------------------------------------5 |
| Pain or burning during urination in the past month6 | Pain, burning, discomfort in the pubic/bladder area in the past month |
| Pain, burning, discomfort, or pressure in your pubic or bladder area in the past month6 | |
| Pain or discomfort in your urethra in the past month6 | |
| Pain increasing when your bladder fills in the past month6 | |
| Pain relieved by urination in the past month6 | |
| Push or strain to begin urination in the past month7 | Straining/difficult to begin voiding |
| Difficulty starting to urinate in the past month7 | |
| Weak urinary stream in the past month | Weak stream in the past month |
| Stop and start again several times while you urinate in the past month | Intermittency in the past month |
| Sensation of not emptying your bladder completely after you have finished urinating in the past month | Incomplete emptying in the past month |
| Number of bladder infections in the past year8 | Urinary tract infection in the past year |
| Number of kidney infections in the past year8 |
BACH=Boston Area Community Health Survey; LUTS=lower urinary tract symptom
% disagreement at baseline (comparing those without a particular LUTS to those who reported experiencing it at least rarely)=25.8%
% disagreement at baseline=5.8%
% disagreement at follow-up=14.7%
% disagreement at baseline=18.9%
Not included in the analysis
% disagreement at baseline=4.3-7.9%
% disagreement at baseline=6.2%
% disagreement at baseline=7.2%
Appendix Table 2.
Baseline characteristics1 of female participants included and excluded from the analysis of changes in the joint distribution of lower urinary tract symptoms (LUTS) and interference with activities from urinary experiences, pain, or discomfort in the pubic area over time; Boston Area Community Health Survey, 2002-10.
| Included participants (N=2,526) |
Excluded participants (n=679) |
|
|---|---|---|
| Age (years, %) | ||
| 26-44 | 46.8 | 47.9 |
| 45-64 | 35.5 | 32.9 |
| ≥65 | 17.6 | 19.2 |
| Race (%) | ||
| Black | 29.0 | 32.9 |
| Hispanic | 12.5 | 18.1 |
| White | 58.5 | 49.0 |
| Menopausal status (%) | ||
| Pre-menopausal/ undetermined | 34.1 | 41.0 |
| Peri-menopausal | 25.1 | 15.7 |
| Post-menopausal | 23.3 | 25.5 |
| Surgical | 17.6 | 17.9 |
| Parity (%) 2 | ||
| 0 pregnancies | 21.9 | 19.8 |
| 1-3 pregnancies | 47.1 | 43.0 |
| ≥4 pregnancies | 30.9 | 36.7 |
| Cigarette Smoking Status (%) 2 | ||
| Never smoker | 20.0 | 31.9 |
| Former smoker | 27.5 | 21.1 |
| Current smoker | 52.5 | 46.6 |
| Alcohol use (average drinks/day, %) 2 | ||
| <1 drinks | 26.8 | 32.7 |
| 1-2 drinks | 54.3 | 43.3 |
| ≥3 drinks | 18.7 | 23.5 |
| Body mass index (kg/m2, %) 2 | ||
| <25 | 33.6 | 33.9 |
| 25-29 | 28.0 | 29.6 |
| ≥30 | 38.0 | 36.4 |
| Waist Circumference (cm, %) | ||
| <65 | 2.8 | 5.0 |
| 65-89 | 52.6 | 48.4 |
| 90-114 | 35.4 | 36.8 |
| 115+ | 8.9 | 8.4 |
| Health-related limitations in activities 3 | ||
| Not limited at all | 43.7 | 52.9 |
| Limited a little | 23.9 | 24.5 |
| Limited a lot | 32.3 | 22.5 |
| Self-reported physician diagnosis of (%): | ||
| High blood pressure | 26.5 | 33.7 |
| Type I diabetes | 2.5 | 3.8 |
| Type II diabetes | 6.6 | 9.9 |
| Cardiovascular disease4 | 18.3 | 24.1 |
| Depression symptoms5 | 17.9 | 27.9 |
| Arthritis or rheumatism | 27.7 | 28.7 |
| Self-reported LUTS in the past month (%): | ||
| Urinating again after <2 hours | 57.1 | 50.9 |
| Perceived frequency | 43.0 | 42.5 |
| Nocturia | 38.7 | 38.1 |
| Stress incontinence6 | 17.1 | 12.3 |
| Urgency incontinence6 | 16.0 | 10.2 |
| Non-stress, non-urgency incontinence6 | 7.8 | 7.8 |
| Any incontinence7 | 32.3 | 23.0 |
| Dribbling/wet clothes after urination | 17.1 | 11.4 |
| Urgency/difficulty postponing urination | 35.3 | 27.5 |
| Pain, burning, discomfort in pubic/bladder area | 11.9 | 11.7 |
| Straining/difficult to begin voiding | 9.9 | 11.6 |
| Weak stream | 12.9 | 12.7 |
| Intermittency | 16.5 | 15.1 |
| Incomplete emptying | 26.4 | 28.7 |
| Urinary tract infection8 | 9.7 | 10.2 |
| Any LUTS | 80.0 | 77.1 |
| Self-reported interference with activities (%): | ||
| Drinking fluids before travel | 14.2 | 20.7 |
| Driving for two hours without stopping | 15.6 | 17.4 |
| Going to places that may not have a toilet | 21.6 | 22.4 |
| Playing sports outdoors such as golf | 9.9 | 9.5 |
| Going to movies, shows, church, etc. | 10.5 | 9.5 |
| Drinking fluids before bed | 16.8 | 23.0 |
| Getting enough sleep at night | 17.5 | 18.9 |
| Interference with any activity | 33.6 | 39.2 |
All values were weighted according to the sampling weights of the Boston Area Community Health Survey.
Percentages may not sum to 100% because of missing values.
Maximum value of responses for health-related limitations in moderate activities (moving a table, pushing a vacuum cleaner, softball, or playing golf) and climbing several flights of stairs.
Includes coronary artery bypass, myocardial infarction, arrhythmia, congestive heart failure, transient ischemic attack, stroke, carotid artery surgery, intermittent claudication, pulmonary embolus, aortic aneurysm, heart rhythm disturbance, Raynaud’s disease, and peripheral vascular disease.
Defined as an affirmative response to at least 5 of 8 items on a revised version of the Center for Epidemiologic Studies of Depression Scale.29
Assessed in the past week.
Assessed in the past year.30
Assessed in the past year.
Appendix Table 3:
Changes in the joint distribution1 of lower urinary tract symptoms2 (LUTS) and interference with activities from urinary experiences, pain, or discomfort in the pubic area3 at baseline and 5 years later by age in 2,526 adult women; Boston Area Community Health Survey, 2002-10.
| 26 to 44 years of age | Baseline (%) | |||||
|---|---|---|---|---|---|---|
| No LUTS and interference |
Mild LUTS or interference4 |
Moderate LUTS or interference5 |
Severe LUTS or interference6 |
Very severe LUTS or interference7 |
||
| Follow-up (%) | No LUTS and interference | 9.6 | 4.8 | 2.9 | 4.8 | 1.5 |
| Mild LUTS or interference4 | 4.4 | 3.8 | 2.6 | 2.5 | 2.8 | |
| Moderate LUTS or interference5 | 2.6 | 2.3 | 8.2 | 7.6 | 1.5 | |
| Severe LUTS or interference6 | 3.9 | 1.9 | 3.4 | 8.1 | 3.0 | |
| Very severe LUTS or interference7 | 2.08/0.29 | 0.68/0.19 | 2.28/0.49 | 4.28/0.29 | 4.98/2.89 | |
| 45 to 64 years of age | ||||||
| No LUTS and interference | 5.4 | 4.3 | 4.3 | 2.3 | 0.9 | |
| Mild LUTS or interference4 | 3.2 | 4.0 | 3.9 | 2.0 | 0.9 | |
| Moderate LUTS or interference5 | 2.9 | 4.8 | 5.7 | 4.0 | 1.5 | |
| Severe LUTS or interference6 | 1.4 | 2.7 | 6.4 | 6.5 | 3.7 | |
| Very severe LUTS or interference7 | 1.08/0.19 | 3.28/0.39 | 2.28/0.09 | 6.68/0.39 | 9.98/5.79 | |
| ≥65 years of age | ||||||
| No LUTS and interference | 4.4 | 1.9 | 2.0 | 1.1 | 0.4 | |
| Mild LUTS or interference4 | 2.3 | 2.6 | 3.3 | 0.4 | 0.8 | |
| Moderate LUTS or interference5 | 4.2 | 3.6 | 8.0 | 5.7 | 2.6 | |
| Severe LUTS or interference6 | 1.4 | 1.6 | 5.3 | 4.6 | 4.7 | |
| Very severe LUTS or interference7 | 1.68/0.39 | 1.48/0.09 | 4.88/0.39 | 9.38/1.29 | 12.98/7.39 | |
All values were weighted according to the sampling weights of the Boston Area Community Health Survey.
Maximum frequency of LUTS across 12 LUTS (urinating again after <2 hours; perceived frequency; nocturia; any incontinence [in the past year]; dribbling/wet clothes after urination; urgency/difficulty postponing urination; pain, burning, discomfort in the pubic/bladder area; straining/difficult to begin voiding; weak stream; intermittency; incomplete emptying; and urinary tract infections [in the past year]).
Maximum frequency of interference across seven activities.
Defined as a maximum frequency of LUTS of “rarely” or a maximum frequency of interference of “a little of the time”.
Defined as a maximum frequency of LUTS of “a few times” or a maximum frequency of interference of “some of the time”.
Defined as a maximum frequency of LUTS of “fairly often” or “usually,” or a maximum frequency of interference of “most of the time”.
Defined as a maximum frequency of LUTS of “almost always,” a maximum frequency of interference of “all of the time,” or a self-reported current or past bladder condition or treatment (i.e., use of current LUTS medications, previous incontinence or bladder surgery, chronic indwelling catheterization, or bladder cancer).
Represents the percentage of women based on self-reported LUTS and interference.
Represents the percentage of women based on self-reported current or past bladder conditions or treatment.
Appendix Figure 1:

Changes in the joint distribution1 of lower urinary tract symptoms (LUTS) and interference with activities from urinary experiences, pain, or discomfort in the pubic area at baseline and 5 years later in a community-based sample of 2,526 adult women; Boston Area Community Health Survey, 2002-10.
1 Weighted according to the sampling weights of the Boston Area Community Health Survey and calculated as the sum of standardized scores for LUTS (sum of the frequency of 12 LUTS: urinating again after <2 hours; perceived frequency; nocturia; any incontinence [in the past year]; dribbling/wet clothes after urination; urgency/difficulty postponing urination; pain, burning, discomfort in the pubic/bladder area; straining/difficult to begin voiding; weak stream; intermittency; incomplete emptying; and urinary tract infections [in the past year]) and interference with activities (sum of the frequency of interference with each of 7 activities). The correlation between the LUTS and interference scores at follow-up was 0.71.
REFERENCES
- 1.World Health Organization. Constitution of The World Health Organization. Basic Doc. Forty-fifth Ed. 2006. [Google Scholar]
- 2.Lloyd-Jones DM, Hong Y, Labarthe D, et al. Defining and setting national goals for cardiovascular health promotion and disease reduction: the American Heart Association's strategic Impact Goal through 2020 and beyond. Circulation. 2010;121(4):586–613. [DOI] [PubMed] [Google Scholar]
- 3.Gorelick PB, Furie KL, Iadecola C, et al. Defining Optimal Brain Health in Adults: A Presidential Advisory From the American Heart Association/American Stroke Association. Stroke. 2017;48(10):e284–e303. [DOI] [PMC free article] [PubMed] [Google Scholar]
- 4.Lukacz ES, Bavendam TG, Berry A, et al. A Novel Research Definition of Bladder Health in Women and Girls: Implications for Research and Public Health Promotion. J Womens Health (Larchmt). 2018;27(8):974–981. [DOI] [PMC free article] [PubMed] [Google Scholar]
- 5.Lowder JL, Bavendam TG, Berry A, et al. Terminology for bladder health research in women and girls: Prevention of Lower Urinary Tract Symptoms transdisciplinary consortium definitions. Neurourol Urodyn. 2019;38(5):1339–1352. [DOI] [PMC free article] [PubMed] [Google Scholar]
- 6.Sutcliffe S, Bavendam T, Cain C, et al. The Spectrum of Bladder Health: The Relationship Between Lower Urinary Tract Symptoms and Interference with Activities. J Womens Health (Larchmt). 2019;28(6):827–841. [DOI] [PMC free article] [PubMed] [Google Scholar]
- 7.Sutcliffe S, Cain C, Bavendam T, et al. Revisiting the Spectrum of Bladder Health: Relationships Between Lower Urinary Tract Symptoms and Multiple Measures of Well-Being. J Womens Health (Larchmt). 2020;29(8):1077–1090. [DOI] [PMC free article] [PubMed] [Google Scholar]
- 8.McKinlay JB, Link CL. Measuring the urologic iceberg: design and implementation of the Boston Area Community Health (BACH) Survey. Eur Urol. 2007;52(2):389–396. [DOI] [PMC free article] [PubMed] [Google Scholar]
- 9.Barry MJ, Fowler FJ Jr., O'Leary MP, et al. The American Urological Association symptom index for benign prostatic hyperplasia. The Measurement Committee of the American Urological Association. J Urol. 1992;148(5):1549–1557; discussion 1564. [DOI] [PubMed] [Google Scholar]
- 10.Sandvik H, Seim A, Vanvik A, Hunskaar S. A severity index for epidemiological surveys of female urinary incontinence: comparison with 48-hour pad-weighing tests. Neurourol Urodyn. 2000;19(2):137–145. [DOI] [PubMed] [Google Scholar]
- 11.O'Leary MP, Sant GR, Fowler FJ Jr., Whitmore KE, Spolarich-Kroll J. The interstitial cystitis symptom index and problem index. Urology. 1997;49(5A Suppl):58–63. [DOI] [PubMed] [Google Scholar]
- 12.Epstein RS, Deverka PA, Chute CG, et al. Validation of a new quality of life questionnaire for benign prostatic hyperplasia. Journal of clinical epidemiology. 1992;45(12):1431–1445. [DOI] [PubMed] [Google Scholar]
- 13.Clemens JQ, Link CL, Eggers PW, et al. Prevalence of painful bladder symptoms and effect on quality of life in black, Hispanic and white men and women. J Urol. 2007;177(4):1390–1394. [DOI] [PubMed] [Google Scholar]
- 14.Kupelian V, Wei JT, O'Leary MP, et al. Prevalence of lower urinary tract symptoms and effect on quality of life in a racially and ethnically diverse random sample: the Boston Area Community Health (BACH) Survey. Arch Intern Med. 2006;166(21):2381–2387. [DOI] [PubMed] [Google Scholar]
- 15.Hall SA, Cinar A, Link CL, et al. Do urological symptoms cluster among women? Results from the Boston Area Community Health Survey. BJU Int. 2008;101(10):1257–1266. [DOI] [PubMed] [Google Scholar]
- 16.Maserejian NN, Kupelian V, McVary KT, Doshi M, Link CL, McKinlay JB. Prevalence of post-micturition symptoms in association with lower urinary tract symptoms and health-related quality of life in men and women. BJU Int. 2011;108(9):1452–1458. [DOI] [PMC free article] [PubMed] [Google Scholar]
- 17.Wiesel A, Queisser-Luft A, Clementi M, Bianca S, Stoll C, Group ES. Prenatal detection of congenital renal malformations by fetal ultrasonographic examination: an analysis of 709,030 births in 12 European countries. Eur J Med Genet. 2005;48(2):131–144. [DOI] [PubMed] [Google Scholar]
- 18.Postoev VA, Grjibovski AM, Kovalenko AA, Anda EE, Nieboer E, Odland JO. Congenital anomalies of the kidney and the urinary tract: A murmansk county birth registry study. Birth Defects Res A Clin Mol Teratol. 2016;106(3):185–193. [DOI] [PubMed] [Google Scholar]
- 19.Irwin DE, Milsom I, Chancellor MB, Kopp Z, Guan Z. Dynamic progression of overactive bladder and urinary incontinence symptoms: a systematic review. Eur Urol. 2010;58(4):532–543. [DOI] [PubMed] [Google Scholar]
- 20.Pesonen JS, Cartwright R, Mangera A, et al. Incidence and Remission of Nocturia: A Systematic Review and Meta-analysis. Eur Urol. 2016;70(2):372–381. [DOI] [PubMed] [Google Scholar]
- 21.Hagan KA, Erekson E, Austin A, et al. A prospective study of the natural history of urinary incontinence in women. Am J Obstet Gynecol. 2018;218(5):502 e501–502 e508. [DOI] [PMC free article] [PubMed] [Google Scholar]
- 22.Heidler S, Mert C, Temml C, Madersbacher S. The natural history of the overactive bladder syndrome in females: a long-term analysis of a health screening project. Neurourol Urodyn. 2011;30(8):1437–1441. [DOI] [PubMed] [Google Scholar]
- 23.Heidler S, Deveza C, Temml C, et al. The natural history of lower urinary tract symptoms in females: analysis of a health screening project. Eur Urol. 2007;52(6):1744–1750. [DOI] [PubMed] [Google Scholar]
- 24.Thom DH, Brown JS, Schembri M, Ragins AI, Subak LL, Van Den Eeden SK. Incidence of and risk factors for change in urinary incontinence status in a prospective cohort of middle-aged and older women: the reproductive risk of incontinence study in Kaiser. J Urol. 2010;184(4):1394–1401. [DOI] [PMC free article] [PubMed] [Google Scholar]
- 25.Komesu YM, Schrader RM, Ketai LH, Rogers RG, Dunivan GC. Epidemiology of mixed, stress, and urgency urinary incontinence in middle-aged/older women: the importance of incontinence history. Int Urogynecol J. 2016;27(5):763–772. [DOI] [PMC free article] [PubMed] [Google Scholar]
- 26.Suskind AM, Berry SH, Suttorp MJ, Elliott MN, Clemens JQ. Symptom persistence in a community cohort of women with interstitial cystitis/bladder pain syndrome (IC/BPS): 3-, 6-, 9-, and 12-month follow-up from the RICE cohort. Int Urogynecol J. 2014;25(12):1639–1643. [DOI] [PMC free article] [PubMed] [Google Scholar]
- 27.Erekson EA, Cong X, Townsend MK, Ciarleglio MM. Ten-Year Prevalence and Incidence of Urinary Incontinence in Older Women: A Longitudinal Analysis of the Health and Retirement Study. J Am Geriatr Soc. 2016;64(6):1274–1280. [DOI] [PMC free article] [PubMed] [Google Scholar]
- 28.Goode PS, Burgio KL, Redden DT, et al. Population based study of incidence and predictors of urinary incontinence in black and white older adults. J Urol. 2008;179(4):1449–1453; discussion 1453-1444. [DOI] [PMC free article] [PubMed] [Google Scholar]
Associated Data
This section collects any data citations, data availability statements, or supplementary materials included in this article.