Abstract
In vertebrates, stimulus-independent activity accompanies neural circuit maturation throughout the developing brain1,2. The recent discovery of comparable activity in the developing Drosophila central nervous system (CNS) suggests that developmental activity is fundamental to the assembly of complex brains3. How such activity is coordinated across disparate brain regions to influence synaptic development at the level of defined cell types is not well understood. Here we show that neurons expressing the cation channel Trpγ relay and pattern developmental activity throughout the Drosophila brain. In trpγ mutants, activity is attenuated globally, and both patterns of activity and synapse structure are altered in a cell-type-specific fashion. Less than 2% of the neurons in the brain express Trpγ. These neurons arborize throughout the brain, and silencing or activating them leads to loss or gain of brain-wide activity. Together, these results indicate that this small population of neurons coordinates brain-wide developmental activity. We propose that stereotyped patterns of developmental activity are driven by a discrete, genetically specified network to instruct neural circuit assembly at the level of individual cells and synapses. This work establishes the fly brain as an experimentally tractable system for studying how activity contributes to synapse and circuit formation.
Understanding how specific synaptic connections are established during development is a fundamental challenge in neurobiology. During circuit formation, stimulus-independent neural activity is known to contribute to synapse development. Such developmental activity has been observed throughout the developing CNS1,2. For example, retinal waves initiate in the eye, propagate to higher-order visual centers4–6, and contribute to eye-specific segregation and refinement of retinotopy7–9.
The integration of different visual centers with activity raises the possibility of broader coordination of circuit assembly across other interconnected regions of the brain through developmental activity. The size and complexity of vertebrate models pose challenges to exploring this question of scale. Notably, the same challenges have also checked progress at the cellular level, where our understanding of the role of activity on cell-type-specific synaptic development remains limited.
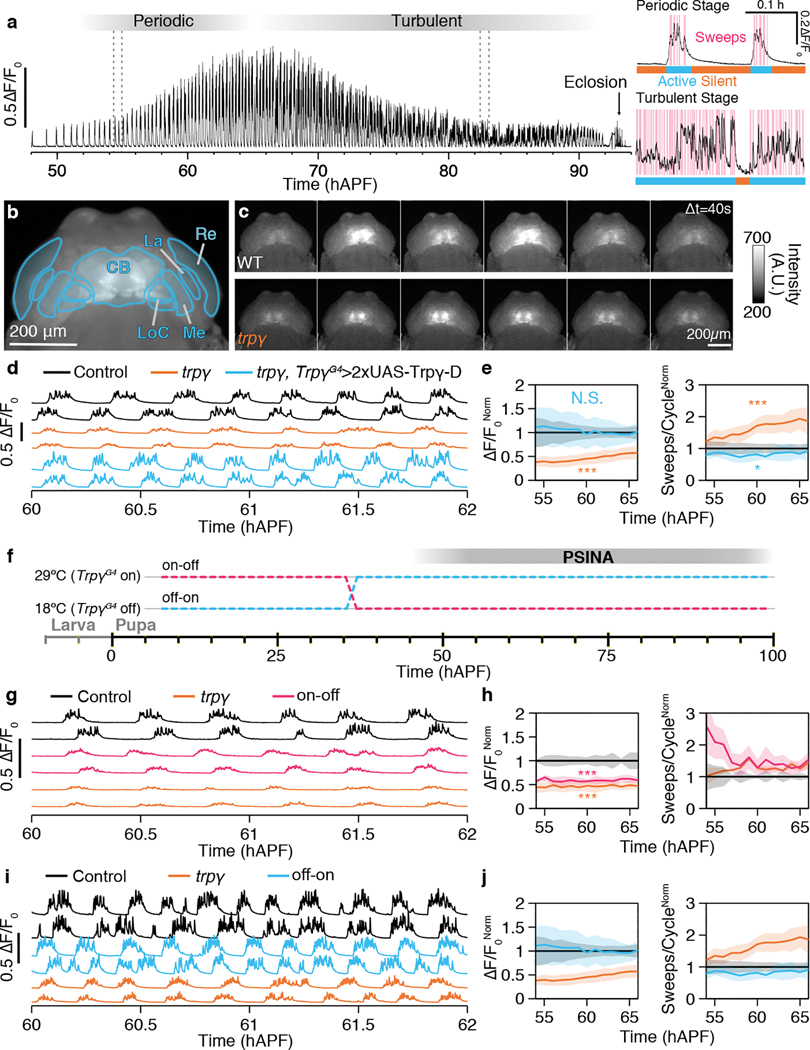
We recently showed that activity accompanies the development of the adult nervous system in Drosophila melanogaster3, challenging the view that neural circuit assembly in invertebrates occurs independently of activity10,11. The adult CNS of the fly is built during the 100 hours of pupal development; synapse formation takes place in the latter half of this period12,13. Patterned, stimulus-independent neuronal activity (PSINA, ‘see-nah’) coincides with synaptogenesis, starting at ~50 hours after puparium formation (hAPF)3. The entire CNS participates in PSINA, which is characterized by periodic active and silent phases coordinated throughout the brain (Fig. 1a). Each active phase consists of multiple bouts of neural activity, termed sweeps. PSINA evolves from a periodic stage with regular active phases to a more irregular turbulent stage at ~70 hAPF. The brain-wide coordination of PSINA suggests a global mechanism that contrasts with existing models of local activity initiation1.
Figure 1. Trpγ is necessary for wild-type PSINA.
A. Representative trace of PSINA, recorded with wide-field fluorescence imaging from pupa expressing pan-neuronal GCaMP6s. This animal eclosed at ~93 hAPF. Dotted lines mark limits of inset traces (right) from periodic (top) and turbulent (bottom) stages. Highlights (magenta) mark individual sweeps; bars mark active (cyan) and silent (orange) phases. B. Average intensity projection (AIP) from wide-field fluorescence series of a pupa expressing pan-neuronal GCaMP6s. CB, central brain. La, lamina. Re, retina. LoC, lobula complex. Me, medulla. Scale bar, 200μm. C. Panels span one active phase at 60 hAPF in control (top), and trpγ mutant pupae (bottom). Frames ~40 seconds apart. Scale bar, 200μm. D,E. PSINA traces (D) and (E) active phase average amplitude (left) and sweeps/cycle (right) binned by hour and normalized to control in control (black, n=19 animals), trpγ (orange, n=31 animals), and trpγ, TrpγG4> 2xUAS-Trpγ-D (cyan, n=4 animals) animals. Shaded areas (E), standard deviation (SD). F. Expression control of UAS-Trpγ-D with TARGET (i.e. GAL80ts); temperature shift at 36 hAPF. G. PSINA traces in control (black, n=8 animals), trpγ (orange, 8 animals), and ‘on-off’ pupae (magenta, n=5 animals). H. Same as E. Genotypes color-matched to G. I. PSINA traces in control (black, n=3 animals), trpγ (orange, n=3 animals), and ‘off-on’ pupae (cyan, n=3 animals). J. Same as E. Genotypes color-matched to I. Throughout figure, *, p<0.05; **, p<0.01; ***, p<0.001 by Welch’s t-test following Shapiro-Wilk test, tested against control at 60 hAPF. Detailed genotypes in this and other figures listed in Supplementary Table 1.
We have previously characterized PSINA in the visual system3, which contains three neuropils: the lamina, medulla, and lobula complex. The optic neuropils are organized by columns, which are repetitive, retinotopic relays that map the input from the compound eye, and by distinct layers where different visual circuits make connections. The synaptic connectivity of the >100 cell types populating these neuropils has been determined by dense electron microscopic (EM) reconstruction14. Visual system neurons participate in PSINA with individualized activity patterns that reflect adult connectivity, suggesting that PSINA may play a role in synapse formation in a cell-type-specific manner.
Here we report that a population of neurons that express the cation channel transient receptor potential gamma (Trpγ) is necessary for the patterning and propagation of PSINA throughout the brain. Disruption of PSINA in trpγ mutants leads to altered synapse counts in visual processing neurons, indicating that activity contributes to synaptogenesis in a cell-type-specific manner. These results provide insight into the coordination of developmental activity across the CNS and establish a role for stimulus-independent activity in synapse development.
Results
Trpγ necessary and sufficient for PSINA
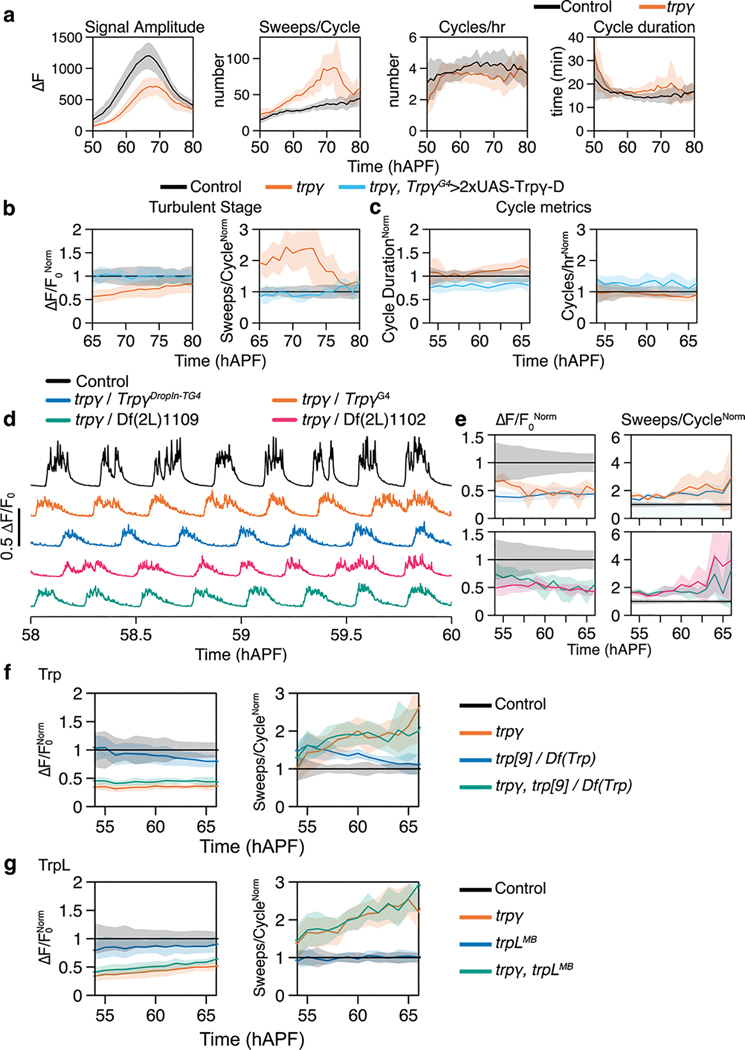
Through a targeted screen of 7 transient receptor potential (TRP) channels with viable null mutants (7/13 TRPs in Drosophila15), we found that PSINA is attenuated in mutants of trpγ. In mutant pupae expressing GCaMP6s16 in pan-neuronal fashion (Fig. 1b,c, Extended Data Fig. 1a), PSINA amplitude is reduced during the periodic stage (55–65 hAPF, 45±12% at 60 hAPF) and the turbulent stage (70 hAPF through eclosion, 73±20% at 75 hAPF) relative to heterozygous controls (Fig 1b–e, Extended Data Fig. 1a,b, Supplementary Video 1). By contrast, the number of sweeps per active phase increases by up to two-fold (Fig 1e, Extended Data Fig. 1a,b). The duration or frequency of cycles does not change significantly (Extended Data Fig. 1c). Genetic complementation analysis carried out with a Trpγ gene trap (TrpγG4)17, a Drop-In allele (TrpγDropIn-TG4)18, and two deficiencies confirmed that the described PSINA phenotype is monogenic (Extended Data Fig. 1d,e). The PSINA phenotype does not affect eclosion: trpγ mutants eclose at the same rate as wildtype (>98%), and their lifespan is largely unaffected (50% survival at ~70 days for wildtype and trpγ null females, ~60 and ~50 days for wildtype and trpγ null males, respectively). Trpγ has been reported to interact with Trp and TrpL19. Trp and trpL mutants did not have altered PSINA, and trp+trpγ or trpL+trpγ double mutants did not further attenuate PSINA (Extended Data Fig. 1f,g). These results indicate that Trpγ is necessary for wild-type PSINA.
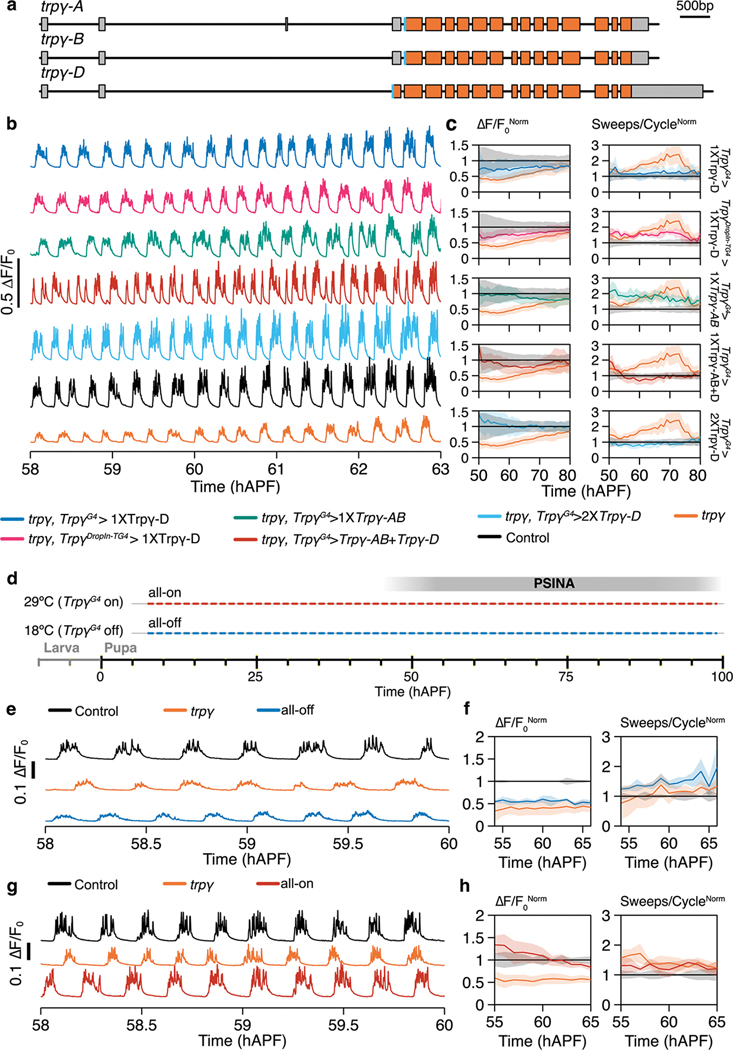
The Trpγ gene produces three isoforms: -A, -B19, and -D20 (Extended Data Fig. 2a). When expressed under TrpγG4, the common coding sequence of Trpγ-A/B rescues fine motor defects of otherwise viable and fertile trpγ mutant animals in the adult17. Trpγ-D was identified more recently in a high-throughput study of development-specific promoter use20. Compared to -A/B, Trpγ-D has an extra 60 aa N-terminal leader sequence and has not been previously studied. TrpγG4-driven expression of Trpγ-D results in complete rescue of PSINA in a dose-dependent manner (Fig. 1d, Extended Data Fig. 2b,c). Driving Trpγ-D with the independently generated TrpγDropIn-TG4 allele produces similar results (Extended Data Fig. 2b,c), confirming the efficacy of these transgenic reagents in capturing the Trpγ expression domain (i.e. Trpγ+ cells). By contrast to Trpγ-D, Trpγ-A/B does not rescue sweep dynamics, and combined expression of Trpγ-A/B and -D rescues amplitude but produces an altered rhythm (Extended Data Fig. 2b,c). These results indicate that the Trpγ-D isoform, expressed in Trpγ+ cells, is sufficient for wild-type PSINA.
To establish when Trpγ-D is required, we used the TARGET system21 to control the timing of Trpγ-D expression (Fig. 1f, Extended Data Fig. 2d–h). Expression of Trpγ-D throughout development up to the onset of PSINA does not rescue the mutant phenotype (Fig. 1g,h). By contrast, the reciprocal expression control scheme leads to rescue that is comparable to constitutive Trpγ-D expression (Fig. 1i,j).
We conclude that Trpγ-D expression in Trpγ+ cells during the second half of pupal development is necessary and sufficient for wild-type PSINA.
PSINA dynamics are Trpγ-dependent
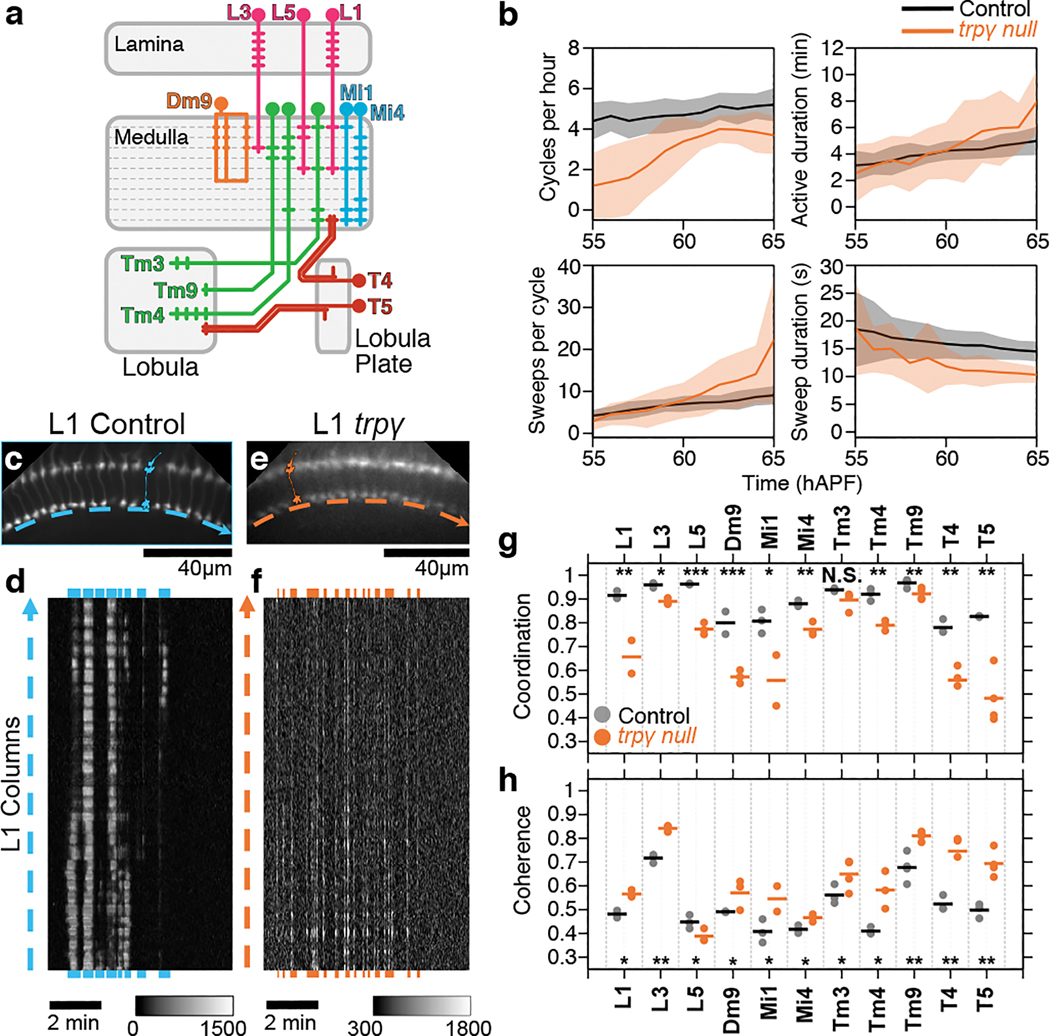
To characterize the trpγ phenotype at the level of cell types, we followed PSINA in the visual system of developing pupae using two-photon microscopy (2PM)22. We focused on 10 cell types (Fig. 2a), representing major classes of visual processing neurons, including lamina monopolar neurons (L1, L3, L5), medulla intrinsic neurons (Mi1, Mi4), transmedullary neurons (Tm3, Tm4, Tm9), and T4/5 neurons. At the population level, cells of a type begin the periodic stage of PSINA (55–65 hAPF) with fewer cycles per hour in the mutant; the cycle frequency gradually becomes comparable to wild-type (Fig. 2b). While active phase duration of these cycles are similar across wild-type and mutant flies, the sweep count per cycle is higher in the trpγ background (Fig. 2b), consistent with pan-neuronal trends (Extended Data Fig. 1a).
Figure 2. Activity patterns in visual processing neurons are altered in trpγ mutants.
A. Schematic of visual system cell types studied. B. Average metrics pooled from 2PM imaging of all cell types in control (black, n=31 animals) and trpγ (orange, n=33 animals) pupae. Shaded areas, SD. C, E. AIP of L1 medulla projections in control (C) and trpγ pupae (E). Cartoons illustrate single L1s in each array. Dashed arrows sit below thin profiles used to generate the kymographs in (D) and (F); arrow direction matches layout of kymographs (D,F). D, F. Kymographs of net fluorescence from profiles in C, E, showing one active phase (~60 hAPF) with sweeps highlighted in blue (D) or orange (F). G, H. Coordination (G) and coherence (H) values over 55–65 hAPF calculated for different cell types in control (black) or trpγ (orange) pupae. Round markers are values from individual time series, bars are averages for each cell type. n=2–3 time series for each cell type. *, p<0.05; **, p<0.01; ***, p<0.001 by Welch’s t-test following Shapiro-Wilk test.
At the cellular level, visual system neurons display cell-type-specific PSINA dynamics ranging from synchronous bursts of activity to wave-like patterns3. To compare activity across cell types and genotypes, we previously developed two scalar metrics: Coordination is the average fraction of cells that participate in each sweep. Coherence is the largest fraction of cells that peak within the same time point, averaged over all sweeps3. In the trpγ background, all cell types have lower coordination and nearly all cell types have higher coherence (Fig. 2c–h, Supplementary Video 2). Lower coordination indicates that fewer cells of a type participate in each sweep, suggesting that the pan-neuronal loss of PSINA amplitude in mutant animals is due to reduced overall neuronal participation (Fig. 1D, E). The opposite trend in coherence reports a shift away from wave-like activity propagation in favor of more synchronous populations. L5 is the lone exception to this trend in coherence. Taken together, these results indicate that Trpγ is necessary for wild-type, cell-type-specific PSINA dynamics in visual processing neurons.
Synaptogenesis depends on PSINA
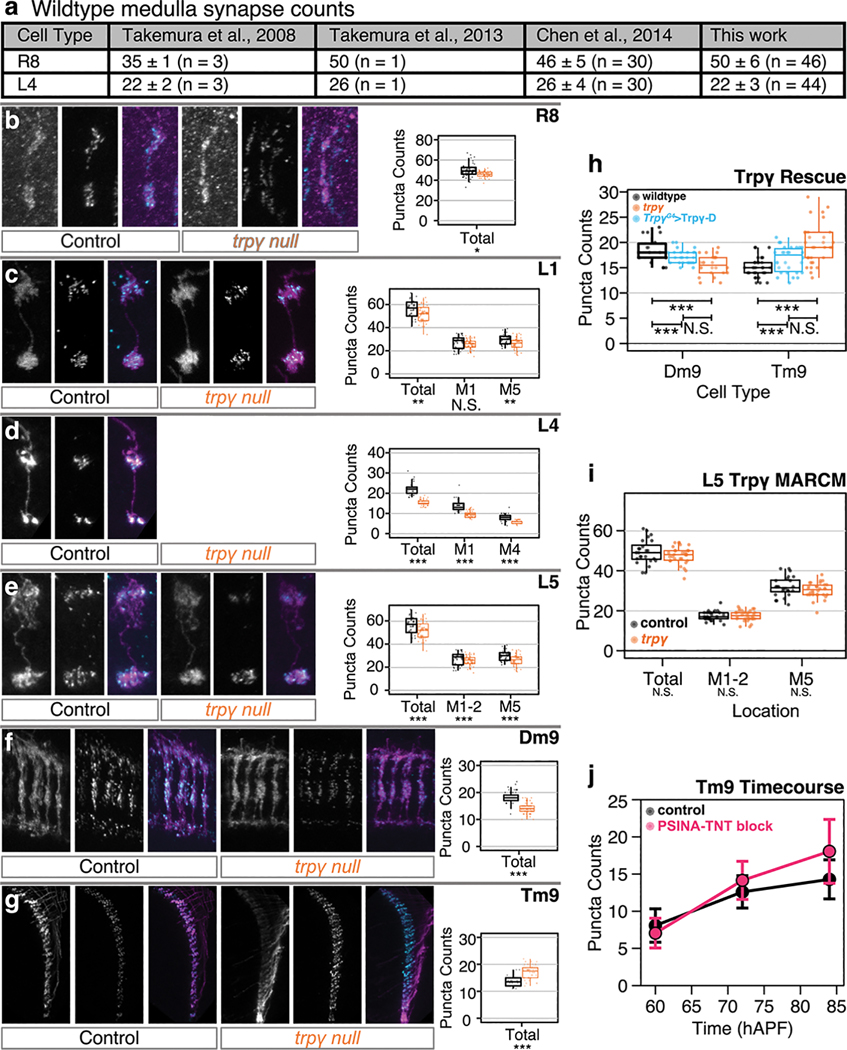
To assess whether loss of Trpγ affects synapse formation, we used the synaptic tagging with recombination (STaR) technique, which enables cell-specific labeling of the active zone structural protein Bruchpilot (Brp)12. As the labeled Brp is expressed at physiological levels with STaR, wild-type synapse counts track closely with those reported in EM reconstructions, particularly for cells with sparser active zones such as R8 and L414,23 (Extended Data Fig. 3a). There are other neurons, such as Mi1, where STaR under-reports the actual synapse count due to resolution constraints. While we refer to STaR-derived data as synapse count, reported changes may reflect any combination of altered synapse count, structure, or density.
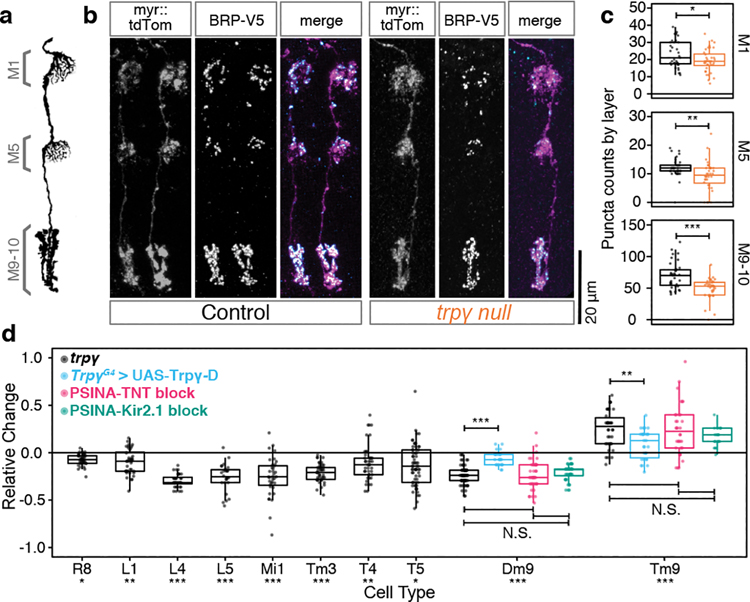
All 10 visual processing neurons we studied have significantly altered synapse counts in trpγ mutants (Fig. 3). Notably, these changes are cell-type and domain specific. For example, the synaptic output domains of Mi1—in medulla layers M1, M5, and M9–10—are differentially affected, with the largest decrease in synapse counts occurring in M9–10 (Fig. 3a–c). By contrast, in L4 and L5, the relative synapse count drops are comparable in each layer (Extended Data Fig. 3d,e). And, in one cell type, Tm9, synapse counts increase in the mutant (Fig. 3d, Extended Data Fig. 3g). We conclude that Trpγ is necessary for establishing the stereotyped, cell-type-specific synaptic structure of the Drosophila visual system.
Figure 3. Synapse formation in the visual system depends on PSINA.
A. Schematic of Mi1, with processes in medulla layers M1, M5, and M9–10 (adapted from Ref. 41). B. Micrographs of Mi1 neurons in control (left set) and trpγ (right set) animals with cell membranes (myr::tdTOM, magenta in merged) and presynaptic sites (BRP-V5, cyan in merged) labeled. Scale bar 20μm. C. Mi1 Brp puncta counts by layer in heterozygous control (black, n=35 cells) and trpγ (orange, n=36 cells) animals. Each data point is the number of Brp puncta counted in the arborization of one Mi1 neuron in one of three medulla layers. Box-and-whiskers mark 5th, 25th, 50th, 75th, and 95th percentiles. *, p<0.05; **, p<0.01; ***, p<0.001 by Welch’s t-test following Shapiro-Wilk test. D. Cell-type-specific Brp puncta counts in trpγ mutants (black, n=26–65 cells per cell type), in the trpγ, TrpγG4> UAS-Trpγ-D rescue condition (cyan, n=24 cells for Dm9, n=30 cells for Tm9), in animals expressing TNT (magenta, n=43 cells for Dm9, n=35 cells for Tm9) or Kir2.1 (green, n=40 for Dm9, n=25 for Tm9) pan-neuronally displayed as change relative to control averages (n=18–61 cells per cell type), calculated by dividing raw Brp counts in the mutant set by the average of the corresponding control set and subtracting ‘1’ from each new ratio value. Data display as in C. Asterisks below cell type names report tests of trpγ mutants against control. *, p<0.05; **, p<0.01; ***, p<0.001 by Welch’s t-test following Shapiro-Wilk test or Tukey’s post-hoc test following ANOVA for multiple groups.
For two cell types, Dm9 and Tm9, we combined STaR analysis with TrpγG4-driven Trpγ-D and found that expression of a single copy of this transgene in Trpγ+ cells significantly rescues the synaptic phenotypes (Fig. 3d, Extended Data Fig. 3h). Our genetic scheme included GAL80 expression specifically in Dm9 or Tm9, so that GAL4-driven Trpγ-D expression would be inhibited in these cell types. Thus, these results are also consistent with a non-cell-autonomous requirement for Trpγ.
To follow up on cell autonomy, we performed mosaic analysis with a repressible cell marker (MARCM)24 in combination with STaR to label pre-synaptic sites of trpγ mutant clones in a wild-type background. We focused on L5, which expresses Trpγ during development25. There is no significant difference in synapse counts between mutant and wild-type clones (Extended Data Fig. 3i), indicating that the L5 trpγ synaptic phenotype is not due to a cell autonomous requirement for this gene.
If the trpγ synaptic phenotypes are due to attenuation of PSINA, then a more severe perturbation of developmental activity should also affect synapse formation. To this end, we expressed either the inward rectifying potassium channel and neuronal inhibitor Kir2.126 or tetanus-toxin (TNT) pan-neuronally during the second half of pupal development and assessed synaptic structure with STaR in Dm9 and Tm9 cells. Pan-neuronal Kir2.1 or TNT expression effectively suppresses PSINA (Fig. 5a–c, Extended Data Fig. 9d,e), and, remarkably, the resulting changes in synapse counts are indistinguishable from the trpγ phenotypes (Fig. 3d). These results indicate that the synaptic defects are caused by the attenuation of PSINA in trpγ mutants. Additionally, the alteration of cell-type-specific PSINA dynamics is as severe a perturbation to synaptic development as the loss of nearly all developmental activity.
The specificity of the Tm9 driver27 made it possible to compare the time-course of synaptic development with and without PSINA. Synapse counts under these two conditions are comparable at 60 hAPF, begin diverging at 72 hAPF, and reach their respective adult complements at 84 hAPF (Extended Data Fig. 3g,j). The wild-type trend is consistent with previous studies12,13, and the similarly monotonic increase in the absence of PSINA suggests that developmental activity acts to influence a default synaptogenesis program.
Trpγ+ activity is the template for PSINA
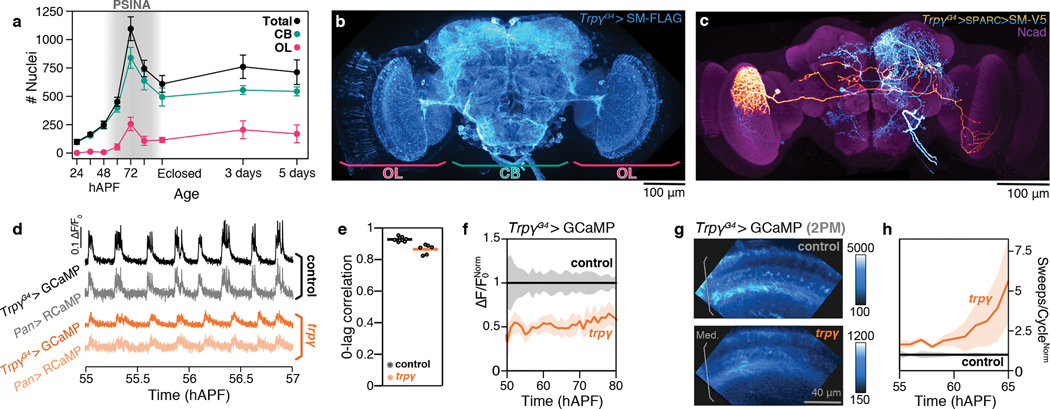
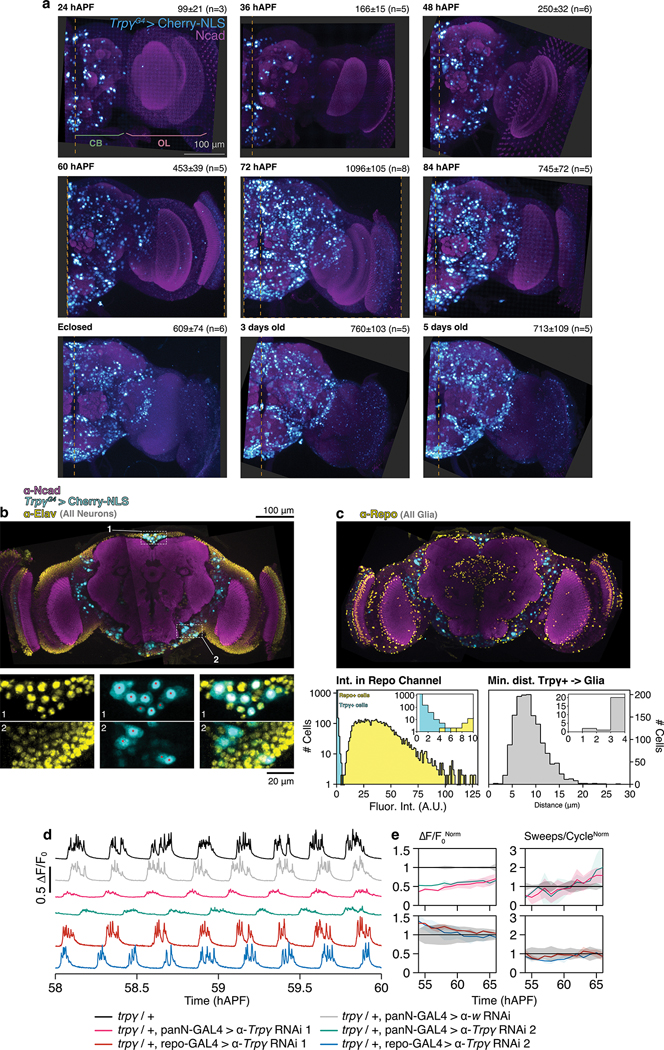
The correspondence of synaptic defects seen with pan-neuronal inhibition and the trpγ mutation as well as the non-autonomous origin of the mutant phenotypes shifted our attention from the gene to the expression domain. From 24 to 72 hAPF, TrpγG4 labels an increasing number of cells in the brain (Fig. 4A, Extended Data Fig. 4a). The half-brain count peaks at 1095±105 at 72 hAPF; by eclosion this figure is reduced by 40%. Throughout pupal development, the majority of Trpγ+ cells are found in the central brain with optic lobes accounting for at most 25% of all and 8% of the strongly labeled Trpγ+ cells (Fig. 4A, Extended Data Fig. 4a).
Figure 4. Trpγ+ neurons are the template for brain-wide PSINA.
A. Half-brain Trpγ+ nuclei counts over time. CB, central brain. OL, optic lobe. Error bars, SD. n=3–8 brains per time point. B. Coverage of the 72 hAPF brain by Trpγ+ neurons expressing myr::SM-FLAG. Most Trpγ+ neurons are labeled; some sparseness was introduced using FLP-Out to improve staining. Image maximum intensity projection (MIP) of confocal stack. Scale bar, 100μm. C. Single Trpγ+ neuron (orange, manually segmented) in the context of others (cyan) labeled using SPARC. Neurons expressing myr::SM-V5. Reference marker (magenta), Ncad. Image MIP of three stitched confocal stacks of 72 hAPF brain. Scale bar, 100μm. D. PSINA traces in control (top two, grayscale) and trpγ (bottom two, orange) pupae, recorded from co-expressed GCaMP6s in Trpγ+ neurons (darker hues) and pan-neuronal RCaMP1b (lighter hues). Acquired with wide-field imaging. E. 0-lag correlation of PSINA in Trpγ+ and pan-neuronal expression domains. Round markers, single time series. Bars, genotype average. n=9 animals, control. n=6 animals, trpγ. F. Active phase average amplitude recorded in Trpγ+ neurons binned by hour and normalized to control. Shaded areas, SD. n=9 animals, control. n=6 animals, trpγ. G. 2PM AIP of GCaMP6s expressing Trpγ+ processes in the visual system of control (top) and trpγ (bottom) pupae at ~62 hAPF. Med., Medulla. Scale bar, 40μm. H. Sweeps/cycle measured in 2PM time series binned by hour and normalized to control. Shaded areas, SD. (n=3 animals for both genotypes).
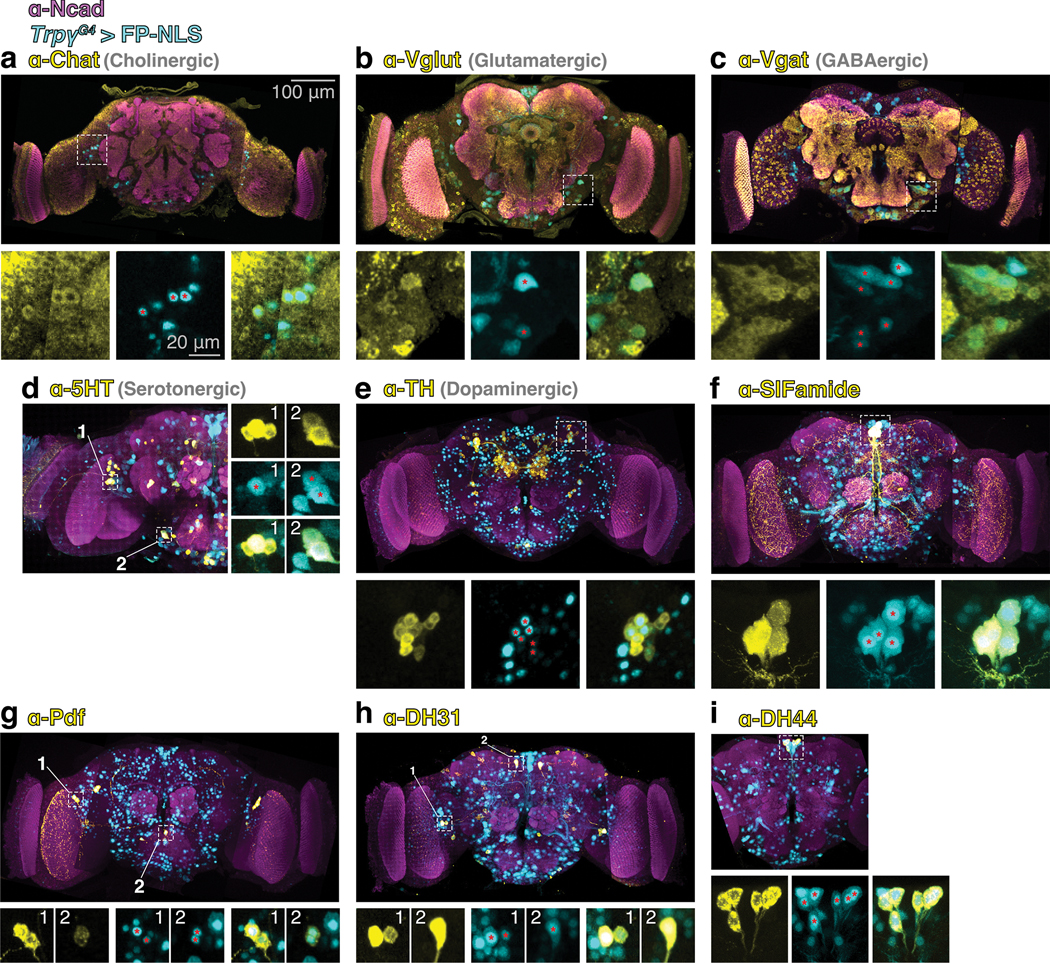
We characterized the Trpγ expression domain at 72 hAPF with immunofluorescence. A comparison of the neuronal anti-elav and glial anti-repo co-stainings revealed that Trpγ+ cells are neurons (Extended Data Fig. 4b,c). Consistent with this, we found that RNAi-mediated Trpγ knockdown in neurons produces to a PSINA phenotype comparable to the whole animal mutant while the knock down in glia has no effect (Extended Data Fig. 4d,e). Trpγ+ neurons are a diverse group that includes cholinergic, glutamatergic, GABAergic, serotonergic, and dopaminergic cells (Extended Data Fig. 5a–e). The expression domain also contains DH31, DH44, Pdf, and SIFamide producing neuropeptide cells (Extended Data Fig. 5f–i).
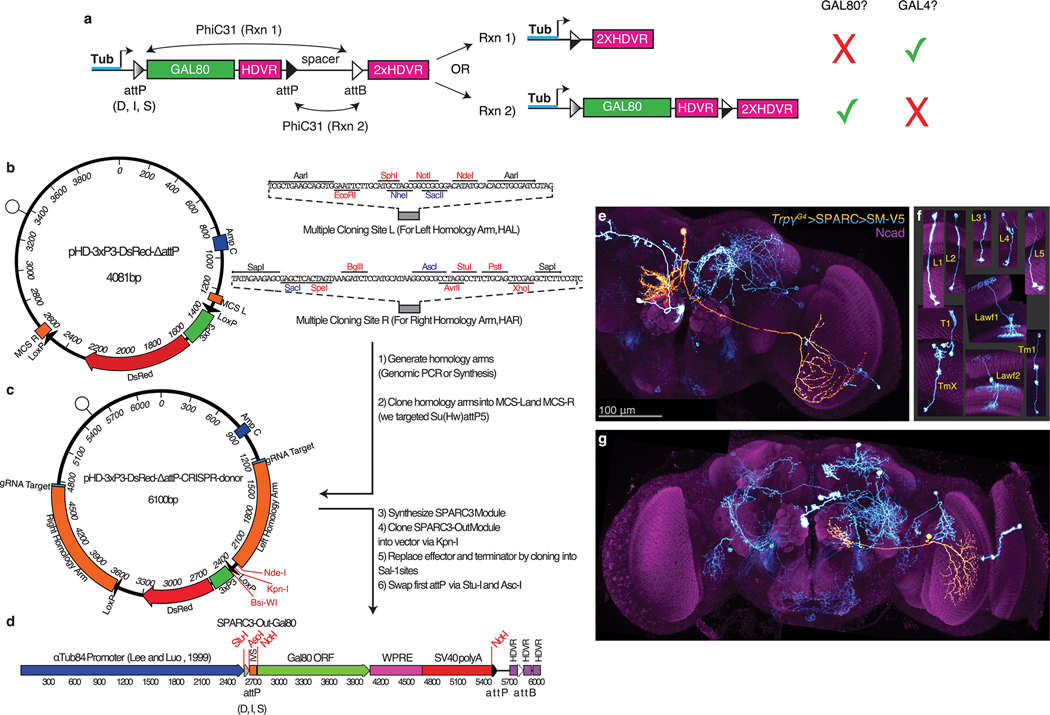
Trpγ+ neuronal processes cover all regions of the developing brain in apparent space-filling fashion (Fig. 4b). We aimed to visualize individual neuronal morphologies. FLP recombinase-mediated approaches resulted in high density labeling independent of imposed controls on recombinase activity. Thus, we generated a new series of reagents, SPARC3-Out-GAL80, based on the recent Sparse Predictive Activity through Recombinase Competition (SPARC) approach to sparse labeling28 (Extended Data Fig. 6a–d, Supp. Discussion). Using SPARC3-Out-GAL80 in series with UAS-SPARC2-LexA to control TrpγG4 output, we reduced the labeling density from ~2,000 to ~5–10 neurons per brain, making it possible to discern morphologies of individual Trpγ+ cells. This effort revealed a number of visual processing neurons, including ones (e.g. lamina neurons) that have been reported to express Trpγ during development (Extended Data Fig. 6f)25. We also observed a number of less familiar neurons that innervate the visual system from the central brain (Fig. 4c, Extended Data Fig. 6e,g), suggesting possible structural origins to the non-autonomous trpγ phenotypes.
The fly brain comprises some 150,000 neurons29; Trpγ is expressed in <2% of this complement. To compare pan-neuronal PSINA to the activity in Trpγ+ neurons, we performed two-color calcium imaging (Fig. 4d)30. In both wild-type and trpγ mutants, PSINA is highly correlated between Trpγ+ neurons and neurons labeled by the nSyb-derived 57C10 enhancer fragment (Fig. 4e). Additionally, the mutation causes the same loss of amplitude in Trpγ+ neurons as it does for all neurons (Fig. 4f, compare Fig. 1E). With the greater sensitivity of 2PM, we found that the trpγ mutation also leads to an increased sweep count in Trpγ+ neurons (Fig. 4g–h, Supplementary Video 3). Notably, Trpγ+ morphologies visible by 2PM were dominated by wide-field processes reminiscent of innervating neurons observed with sparse labeling (Fig. 4g). Taken together, these results suggest that the ~2,000 Trpγ+ neurons provide the immediate template for pan-neuronal PSINA.
PSINA requires Trpγ+ neuron activity
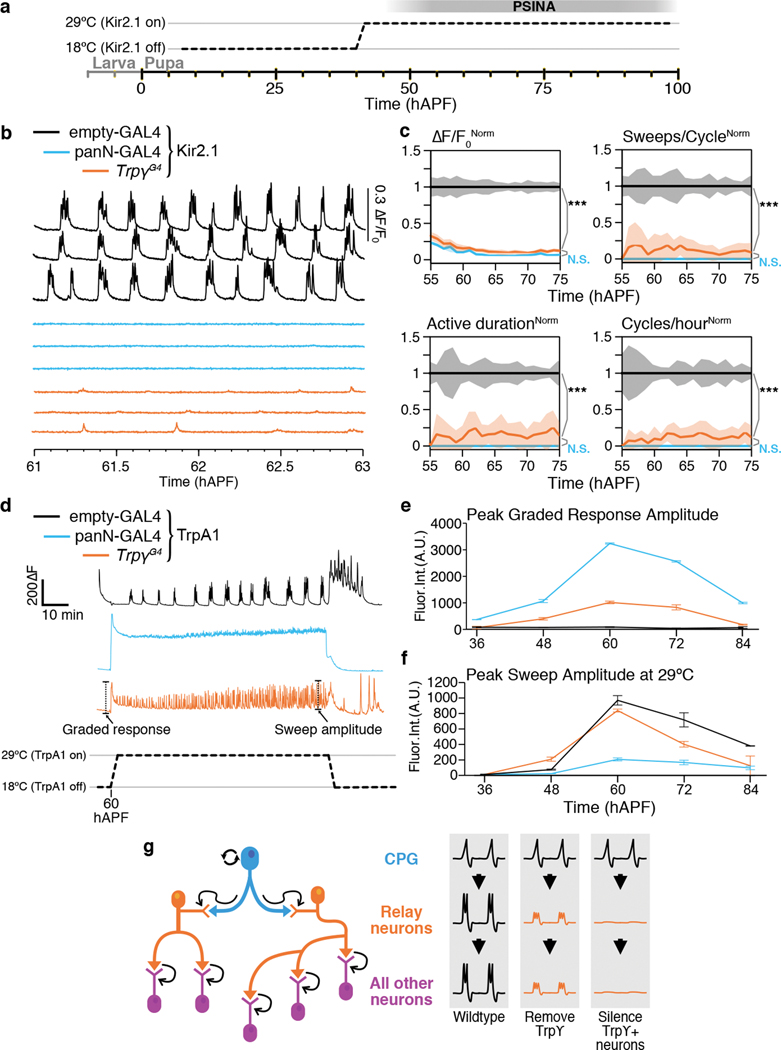
To directly test the contribution of activity in Trpγ+ cells to PSINA, we expressed Kir2.126 from 40–100 hAPF (i.e. during pupal development) and carried out pan-neuronal calcium imaging (Fig. 5a–c, Extended Data Fig. 7a–d).
Figure 5. PSINA requires Trpγ+ neuron activity.
A. Expression control of UAS-Kir2.1 with TARGET; animals shifted from 18°C to 29°C at 40 hAPF. B. PSINA traces from pan-neuronal GCaMP6s in control (empty-GAL4, black, n=7 animals), panN-GAL4>Kir2.1 (blue, n=7 animals), and TrpγG4>Kir2.1 (orange, n=9 animals) pupae. C. Active phase average amplitude (top-left), sweeps/cycle (top-right), active phase duration (bottom-left), and cycles per hour (bottom-right), binned by hour and normalized to control. Shaded areas, SD. Genotypes color-matched to B. ***, p<0.001 by Welch’s t-test following Shapiro-Wilk test, compared to TrpγG4>Kir2.1 activity at 60 hAPF. D. Activity from pan-neuronal GCaMP6s in control (empty-GAL4, black), panN-GAL4>TrpA1 (blue), and TrpγG4>TrpA1 (orange) pupae at 60 hAPF. Pupae reared at 18°C and shifted to 29°C. Initial graded response to temperature shift and maximum sweep amplitude are marked. E,F. Peak graded response to temperature shift (E) and peak sweep amplitude at 29°C (F). Error bars, SD. n=2–4 animals per timepoint and condition. Genotypes color-matched to D. G. Intrinsically active CPG neurons (cyan) activate Trpγ+ relay neurons (orange), which, in turn, activate all other neurons (magenta) in specific spatio-temporal patterns. When relay activity is attenuated or silenced, all downstream neurons are similarly affected.
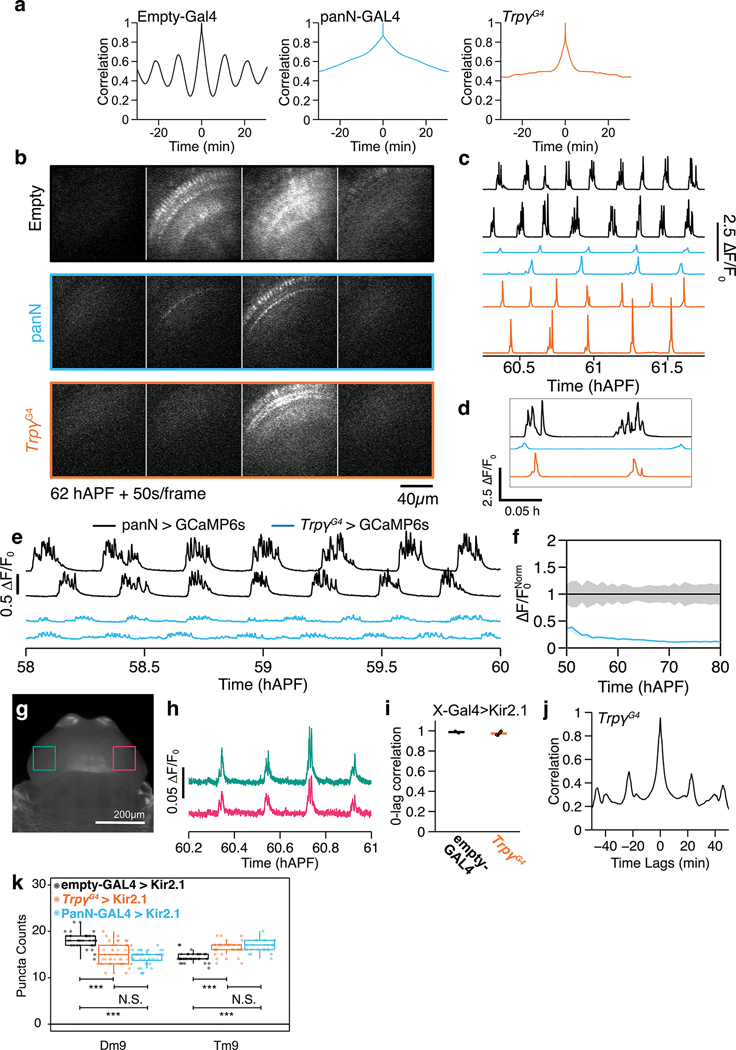
Silencing Trpγ+ neurons severely attenuates PSINA at a level comparable to pan-neuronal expression of Kir2.1 (Fig. 5b,c, Supplementary Video 4). The extent of attenuation cannot be explained by simply a loss of Trpγ+ neuron activity, which contributes ~15% of the total PSINA signal amplitude (Extended Data Fig. 7e,f). Wide-field imaging reveals residual cycles with fewer sweeps, shorter active phases, and perturbed periodicity (Fig. 5c, Extended Data Fig. 7a). This residual activity remains coordinated throughout the brain (Extended Data Fig. 7g–j). With 2PM in the visual system, the reduced cycles are evident with both Trpγ+ and pan-neuronal silencing, and, in both cases, only distinct layers in the distal medulla become active (Extended Data Fig. 7b–d). The profound impact of driving Kir2.1 with TrpγG4 indicates that the neurons that shape the spatiotemporal structure of PSINA reside in the Trpγ expression domain.
To ask whether targeted silencing of Trpγ+ neurons also affects synaptic development, we expressed Kir2.1 in the Trpγ+ domain during the second half of pupal development and assessed synaptic structure with STaR in Dm9 and Tm9 cells. Both cell types show altered Brp counts that are indistinguishable from what we observe with pan-neuronal silencing using Kir2.1 (Extended Data Fig. 7k), indicating that pan-neuronal activity driven by Trpγ+ neurons influences synaptogenesis.
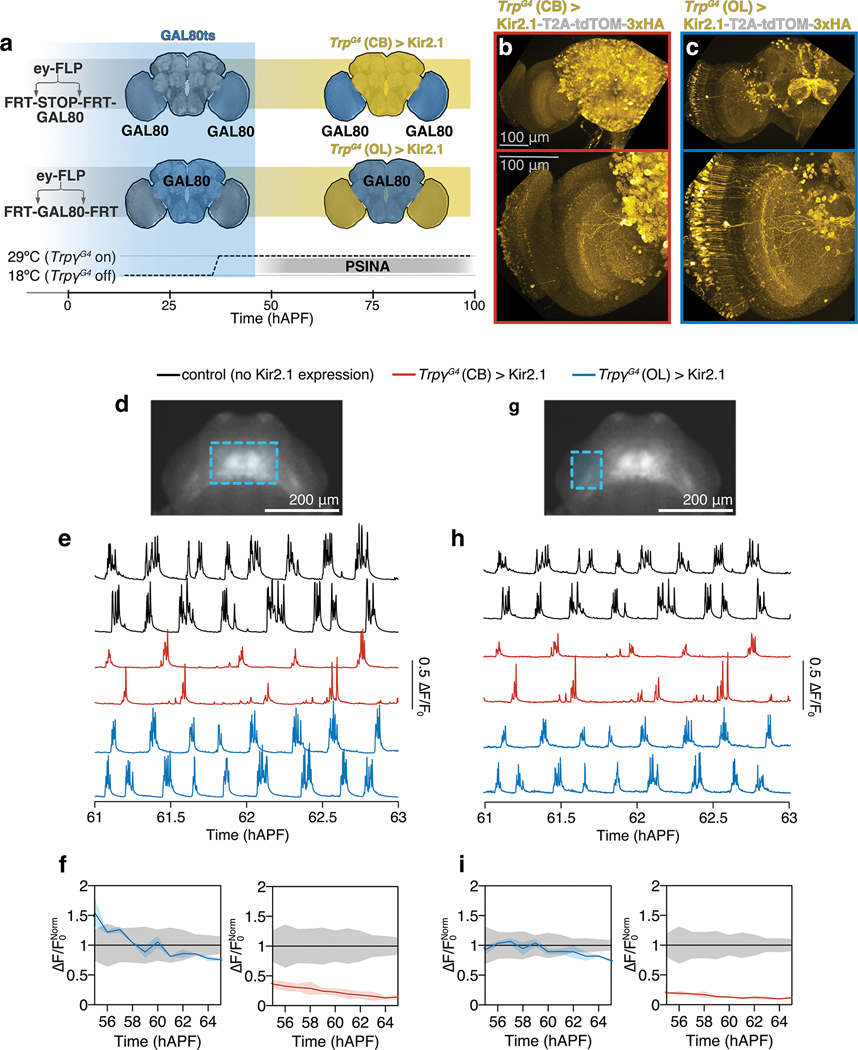
Specifically silencing Trpγ+ neurons in the central brain, but not in the optic lobes, attenuates PSINA across the brain (Extended Data Fig. 8). Notably, the converse experiment has no significant effect, even in the optic lobes where Trpγ+ neurons are made to express Kir2.1 (Extended Data Fig. 8). These results are consistent with the non cell-autonomous origin of the visual system trpγ synaptic phenotypes, and, together with the Trpγ+ neurons that bridge the central brain and the optic lobes, suggest that Trpγ+ neurons carry, or relay, PSINA into the visual system.
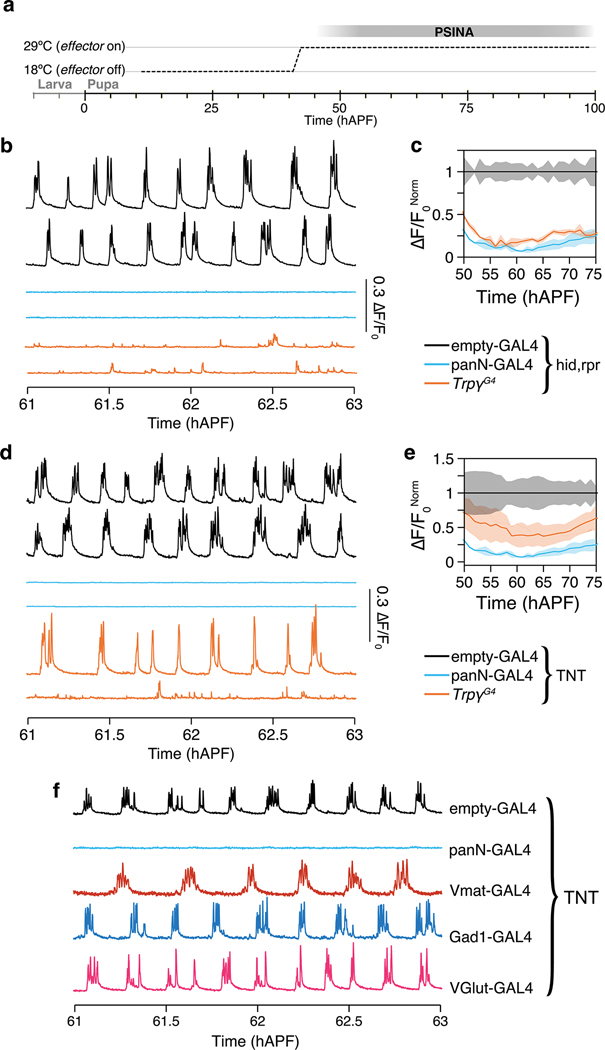
Additional perturbations of the Trpγ+ domain also lead to PSINA attenuation. Ablating Trpγ+ neurons during PSINA results in loss of PSINA comparable to Kir2.1 silencing (Extended Data Fig. 9b,c). TNT expression in Trpγ+ neurons attenuates PSINA as well (Extended Data Fig. 9d,e). While the least potent of the three perturbations, TNT is still much more effective at inhibiting PSINA when expressed in the ~2,000 Trpγ+ neurons than in other neuronal populations: expressing tetanus toxin in aminergic, glutamatergic, or GABAergic neurons has no significant effect on PSINA (Extended Data Fig. 9f). We conclude that the Trpγ+ silencing results cannot be explained by the silencing of an arbitrary subpopulation of neurons.
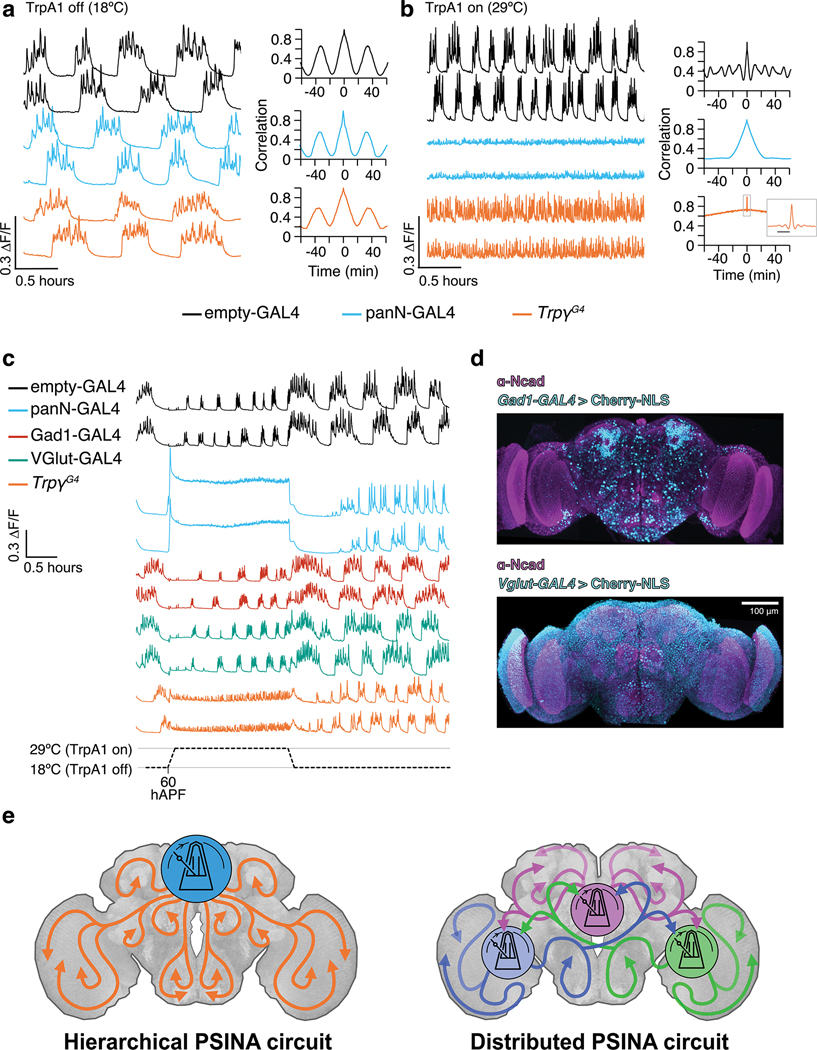
For a complementary gain-of-function approach, we used the thermogenetic neuronal activator TrpA131. Activating TrpA1 pan-neuronally leads to sustained high frequency, low amplitude events that sit on an elevated plateau of GCaMP fluorescence, consistent with constitutive contributions from spiking and non-spiking neurons (Fig. 5d–f, Extended Data Fig. 10a,b). TrpA1-mediated activation of Trpγ+ neurons produces an uninterrupted train of sweeps comparable in amplitude to controls, but which lack the periodic structure of wild-type PSINA (Fig. 5d–f, Extended Data Fig. 10a,b). By contrast, TrpA1-mediated activation of GABAergic or glutamatergic neurons does not alter the temporal structure of wild-type PSINA (Extended Data Fig. 10c,d). Notably, while pan-neuronal activation stimulates brain-wide responses as early as 36 hAPF, Trpγ+ neurons become effective drivers of stimulated activity starting at 48 hAPF, co-incident with the onset of PSINA (Fig. 5e). These results are consistent with the notion that Trpγ+ neurons can trigger brain-wide spiking activity during PSINA.
Discussion
We report that perturbing PSINA leads to cell-type-specific changes to synaptic structure in the fly visual system (Fig. 3d). We see the same changes with both the near-complete block of PSINA with pan-neuronal TNT or Kir2.1 and the attenuated and altered activity due loss of Trpγ, suggesting that wild-type synaptic development requires the stereotyped activity patterns of PSINA. This, together with the observations that synapses still form without activity (Fig. 3d) and that activity across the brain is templated by a discrete population of neurons (Fig. 4d–f), is consistent with an instructive role for PSINA. The genetic access offered by the Trpγ+ domain to the origins of the patterns, i.e. the information content, of PSINA promises a more rigorous test of this putative instructive role 32 in the future.
The synaptic changes due to altered PSINA are comparable to recent findings that used EM reconstructions to compare the effects of cell-type-specific perturbations to wiring in the developing larval nervous system33. This study found that silencing a mechanosensory neuron during development reduced the number of pre-synaptic sites and changed the relative strength of connections to post-synaptic partners. These changes produced altered behavioral responses, indicating that quantitatively modest perturbations of synaptic structure can significantly alter circuit function and output.
Trpγ is a non-selective cation channel in the classical TRP (TRPC) sub-family of TRP channel super-family19. It can interact with the other two fly TRPCs19, TrpL and the eponymous Trp. Constitutive loss of Trpγ results in coordination and fine motor control deficits due to a requirement for the channel in proprioceptive organs of the adult17. Here, we show that expression of Trpγ in ~2,000 neurons in the developing brain is necessary and sufficient for wild-type PSINA (Fig. 1). Future studies will be required to characterize the behavioral consequences of developmental loss of Trpγ from the brain, or of other disruptions to PSINA.
The significance of the Trpγ expression domain to PSINA is underscored by two results: (1) Silencing Trpγ+ neurons results in activity inhibition comparable to pan-neuronal silencing (Fig. 5b–c); and (2) pan-neuronal activity phenocopies the cell-autonomous trpγ phenotype; that is, loss of trpγ has the same effect on activity across the whole brain as it does in Trpγ+ neurons (Fig. 4d–f). Together, these indicate that Trpγ+ neurons both relay PSINA across the brain and form an activity scaffold that templates the spatiotemporal patterns of PSINA (Fig. 5g, Extended Data Fig. 10e). We hypothesize that cell-type-specific PSINA dynamics are shaped by the activity patterns of upstream Trpγ+ relay neurons.
Residual rhythmic activity persists with both pan-neuronal and Trpγ+ silencing (Fig. 5b, Extended Data Fig. 7b–d), revealing the presence of a PSINA central pattern generator (CPG) that is outside the reach of these manipulations (Supp. Discussion). Consistent with previously described CPGs34, PSINA arises independent of sensory input3 and its temporal patterns are temperature sensitive (Extended Data Fig. 10a,b). While some Trpγ+ neurons may contribute to this CPG, the overall picture that emerges for PSINA is that of a hierarchical cascade, with a CPG triggering a small set of Trpγ+ relay neurons, which subsequently activate the rest of the brain in specific spatiotemporal patterns (Fig. 5g, Extended Data Fig. 10e). A more derived mechanism could involve a network of distinct CPGs synchronized via feedback, with Trpγ+ neurons acting downstream of each CPG to propagate activity throughout the brain (Extended Data Fig. 10e).
The dynamic expression domain of Trpγ, peaking at a cell count of ~2,000 at 72 hAPF and contracting thereafter, suggests that the PSINA relay may be a functionally or structurally transient feature. Transient populations have been documented in mammalian models of developmental activity, including the Kölliker’s organ in the cochlea and sub-plate and Cajal-Retzius neurons in the neocortex35–37. The existence of temporally dedicated neurons supports the notion that developmental activity is a hardwired phase of nervous system development. Evidence for transient neuronal populations in the developing fly brain38, including PDF-TRI cells39 which are Trpγ+ neurons (Extended Data Fig. 5g), raises the possibility of a population of neurons that exist only during pupal development to coordinate PSINA.
Consistent with their role as a relay system, the processes of Trpγ+ neurons occupy every region of the fly brain (Fig. 4b). In the optic lobes, the Trpγ+ domain is represented by both resident visual processing neurons and by expansive processes originating from the central brain (Fig. 4c, Extended Data Fig. 6e–g). The trpγ synapse and activity phenotypes are due to loss of function outside the visual system (Fig. 3d, Extended Data Fig. 8), suggesting that the subset of Trpγ+ neurons with long range projections are responsible for relaying PSINA across the brain.
In many mammalian models of developmental activity, local circuitry initiates activity1. While initiation and patterning of activity may be local, the high degree of inter-connectivity in the adult brain does suggest the feasibility of coordination at a larger scale. Indeed, activity in the retina is relayed out to higher visual centers by retinal ganglion cells6. Here, the more approachable scale of the fly nervous system reveals that it is possible to coordinate developmental activity across the whole brain. Studies of brain-wide, low frequency activity in the adult40 suggest that the neuronal infrastructure for such long-range coordination exists in mammals; it remains to be seen if similar infrastructure is used during development.
In summary, here we identify a brain-wide relay system to produce PSINA, which, in turn, influences synaptogenesis. The structure and connectivity of this relay circuit will be critical for understanding how brain-wide developmental activity is generated. A mechanistic description of developmental activity will be necessary to address how and to what extent such activity represents a fundamental ingredient in the recipe for building a brain.
Materials and Methods
Experimental Model and Subject Details
Flies were reared at 18°C, 25°C, or 29°C on standard cornmeal/molasses medium; developmental time was matched to the 25°C standard (1x) using relative rates of 0.5x and 1.25x for 18°C and 29°C, respectively42. Pupal development was staged with respect to white pre-pupa formation (w.p.p., 0 hAPF) or head eversion (h.e., 12 hAPF). GAL4/UAS and LexA/LexAop expression systems43,44 were used to drive cell-type-specific transgene expression. Complete genotypes used in each experiment can be found in Table S1.
Lifespan Assay
Protocol was adapted from Ref. 45. In brief, 1-day-old flies from a 24 hr egg-lay were flipped into fresh bottles and allowed to mate for 2 days. 50 males and females of each genotype (WT and trpγ nulls) were moved to vials at a density of 10 flies per vial. Vials were stored horizontally at 25°C and 75%RH with 12:12 hr light:dark cycles. Flies were flipped into fresh (<wk old) vials every 2–3 days; deaths and censors (i.e. lost during transfer) were scored during each transfer until there were no survivors. Assay was carried out in 2 technical replicates, separated by a day in their start-time.
Generation of UAS-Trpγ-A/B and UAS-Trpγ-D transgenic lines.
See Supplementary Table 2 for primers used to PCR amplify the Trpγ coding sequence from pcDNA3-Trpγ17. We subcloned the fragments between the NotI and the XbaI sites of pJFRC165. Note that in our Trpγ-D ORF, the non-canonical start codon CTG is converted to ATG to ensure robust GAL4-driven expression. After sequence-verifying the new plasmids, we introduced UAS-Trpγ-A/B or -D DNA into y[1] w[*]; P{y[+t7.7]=CaryIP}su(Hw)attP1 embryos via phiC31 integrase-mediated germline transformation (BestGene Inc., CA, USA).
Generation SPARC3-Out-GAL80 flies
All plasmids were generated through synthesis and molecular cloning by Genscript (NJ, USA); see Supplementary Table 3 for details.
gRNA-targeting vector:
See Supplementary Table 4 for the gRNA sequences used in the design of pCFD5-U6–3-t-Su(Hw)attP528.
αTub84B-SPARC3 CRISPR donor synthesis:
To generate CRISPR donor plasmids targeting sequences near Su(Hw)attP5, we defined homology arms directly adjacent to the gRNA targets defined above. For the region near Su(Hw)attP5, we defined a 1044bp left homology arm (2R: 14304046..14305089) and a 1044bp right homology arm (2R:14305090..14306133). We designed these homology arms to fully recapitulate genomic DNA after CRISPR-HDR by overlapping the gRNA target sites and mutating the Proximal Adjacent Motifs (PAMs) of gRNA targets. Genscript synthesized these homology arms and cloned them into pHD-3xP3-dsRed-ΔattP28 using AarI for left homology arms and Sap-I for right homology arms to generate pHD-3XP3-dsRed-ΔattP-CRISPR-donor-Su(Hw)attP5.
Next, the SPARC3-OUT-D-GAL80 module was synthesized by Genscript (NJ, USA) and cloned into the unique Kpn-I site of either pHD-3XP3-dsRed-ΔattP-CRISPR-donor-Su(Hw)attP5 to generate pHD-SPARC3-OUT-D-GAL80-Su(Hw)attP5. Then Genscript PCR amplified the αTub84B promoter24 from pJFRC-αTub84B-IVS-PhiC3128 and cloned it into pHD-SPARC3-OUT-D-GAL80-Su(Hw)attP5 to generate pHD-αTub84B-SPARC3-OUT-D-GAL80-Su(Hw)attP5. Genscript next synthesized attP38 and attP34 fragments28 and cloned them into pHD-αTub84B-SPARC3-OUT-D-GAL80-Su(Hw)attP5 via Stu-I and Asc-I sites to generate pHD-αTub84B-SPARC3-OUT-I-GAL80-Su(Hw)attP5 and pHD-αTub84B-SPARC3-OUT-S-GAL80-Su(Hw)attP5 respectively.
For detailed construct maps of αTub84B-SPARC3-OUT, see Extended Data Fig. 6a–d.
Generation of transgenic flies:
αTub84B-SPARC3-OUT-GAL80 transgenic flies were generated by Bestgene (CA, USA) via standard construct injections and CRISPR-HDR. Transformants were identified by the marker 3xP3-DsRed. The three fly lines (i.e. D, I, and S variants) are available upon request.
Wide-field imaging
Pupae were staged for w.p.p formation or h.e. and reared at 25°C unless otherwise noted. The cuticle around the heads were removed with fine forceps and the animals were affixed to a metal plate (McMaster-Carr, CA, USA) with double-stick adhesive tape (3M, MN, USA). The metal plate was placed in a custom environmental chamber to maintain temperature and humidity. This chamber comprised: a PTC1 temperature-controlled breadboard (Thorlabs, NJ, USA) to maintain sample temperature at 18°C, 25°C, or 29°C; a set of four 35mm dishes filled with deionized water to maintain humidity; and a 150mm petri-dish lid to provide enclosure. To improve imaging quality, a large format coverslip was fitted into a rectangular opening made in the lid. This coverslip sat in the optical path, between the pupae and the objective lens, and was treated with Barbasol shaving cream (Perio, OH, USA) to prevent condensation during temperature shifts.
Images were captured using an Axio Zoom.V16 epifluorescence microscope (Zeiss, Germany) equipped with a Retiga R1 CCD Camera (QImaging, Canada) and X-Cite TURBO LED 6-Channel Light Source (Excelitas Technologies, MA, USA). Images were acquired at 0.4 Hz with a PlanNeoFluar Z 1X objective (Zeiss, Germany) with 100ms exposure time for green fluorophores and 500ms exposure time for red fluorophores. Acquisition was controlled by Slidebook 6 software (Intelligent Imaging, CO, USA). Time series were processed with Fiji46 and analyzed using MATLAB (Mathworks, MA, USA).
Two-photon imaging of the developing visual system
Pupae were prepared for imaging as previously described22. Briefly, the cuticle around the heads were removed with fine forceps and the animals were attached eye-down on a coverslip coated with a thin layer of embryo glue. A water reservoir on the objective side of the coverglass provided sufficient immersion medium to last through the hours-long imaging sessions; another reservoir below the pupae kept the animals from dehydrating.
Time-lapse imaging of the visual system was performed on a custom-built two-photon microscope22 with a 20x water immersion objective (Zeiss, W Plan-Apochromat 10x/1.0 DIC) and 2 GaAsP detectors (Hamamatsu, Japan). The pupae were kept at 25°C using an objective heater system (Bioptechs, PA, USA). A tunable Ti:Sapphire pulsed laser (Chameleon Ultra II, Coherent) was used as the light source. GCaMP6s was excited at 940 nm with ~30 mW under-the-objective power. Animals imaged under these conditions developed normally and eclosed on schedule. To observe a thicker cross-section of the visual system than possible with a single optical slice, we used the maximum intensity projection of three successive images taken 2μm apart in the z-axis as the frame for an individual time point. The effective sampling rate of these time series was 0.38 Hz (2.6s per frame).
Immunofluorescence and confocal microscopy
Brains were dissected in cold Schneider Medium (SM, Gibco #21720–024) and fixed with 3% v/v glyoxal solution (Electron Microscopy Sciences #16525) for 30 minutes at room temperature (RT) or with 4% v/v PFA (Electron Microscopy Sciences #15710) in SM for 20 minutes at RT. Brains were then washed out of fixative into PBS (Quality Biological), solubilized in PBST (0.5% Triton-X100 (Sigma #T9284) in PBS) for 1 h, and blocked in PBTN (5% Normal Donkey Serum (Jackson ImmunoResearch #017–000-121) in PBST) for 1–2 h, all at RT. Brains were sequentially incubated in primary and secondary antibodies diluted in PBTN for 24–48h at 4°C, with at least 3 washes through PBST over 2 h at RT in between and afterwards. Brains were post-fixed with 3% v/v glyoxal for 30 minutes at RT or with 4% v/v PFA in SM for 20 minutes at RT, followed by multiple washes into PBST over 10 minutes. Brains were finally transferred to Everbrite mounting medium (Biotium #23001) and mounted on to slides for imaging.
Primary antibodies and dilutions used in this study were as follows: Mouse monoclonal anti-V5 (Novus Biologicals #NBP2–52703-0.2mg, 1:150), rat monoclonal anti-FLAG (DYKDDDDK) (Novus Biologicals #NBP1–06712, 1:100), mouse monoclonal anti-c-MYC (Developmental Studies Hybridoma Bank (DSHB) #9E10-concentrate, 1:100), rabbit polyclonal anti-dsRed (Clontech #632496, 1:125), chicken anti-GFP (Abcam #ab13970, 1:1000), rabbit monoclonal anti-HA (Cell Signaling Technology #3724, 1:300), rat monoclonal anti-Ncad (DSHB #DN-Ex #8-c, 1:100), mouse monoclonal anti-Elav (DHSB #Elav-9F8A9, 1:100), mouse monoclonal anti-Repo (DHSB #8D12 anti-Repo, 1:100), mouse monoclonal anti-Chat (DHSB #ChAT4B1, 1:20), mouse monoclonal anti-Pdf (DHSB #PDF C7, 1:1000), rabbit polyclonal anti-DVGLUT47 (1:1000), rabbit polyclonal anti-DVGAT48 (1:200), mouse monoclonal anti-TH (Immunostar #22941, 1:200), rabbit polyclonal anti-5-HT (Immunostar #20080, 1:1000), rabbit polyclonal anti-DH3149 (1:1000), rabbit polyclonal anti-DH4450 (1:1000), rabbit polyclonal anti-SIFamide51 (1:1000).
Secondary antibodies and dilutions used in this study were as follows: Alexa 488 donkey polyclonal anti-chicken (Jackson ImmunoResearch # 703–545-155, 1:400), Alexa 488 donkey polyclonal anti-mouse (Jackson ImmunoResearch #715–545-151, 1:400), Alexa 568 donkey polyclonal anti-rabbit (Invitrogen #A10042, 1:400), Alexa 647 donkey polyclonal anti-rat (Jackson ImmunoResearch #712–605-153, 1:400).
Immunofluorescence images were acquired using Zeiss LSM 780 confocal microscope with 20x/0.8 air, 40x/1.4 oil immersion, or 40x/1.2 glycerol immersion objectives (Zeiss).
Analysis of two-photon imaging data
Analysis was carried out as described previously in Ref. 3.
Analysis of pupal wide-field imaging data
Preparation of time lapse imaging data was performed in Fiji (ImageJ). Per frame pixel averages of user-defined ROIs were used to define raw signal (F) traces from the image time series. The raw signal was baseline subtracted and the resulting net signal (ΔF) was used in subsequent analysis, performed in MATLAB. ΔF/F0 is defined as the baseline-subtracted net signal divided by the raw baseline signal.
For each time series, sweeps were defined by growing the ‘domain’ of each signal local maximum (i.e. peak) through preceding and succeeding time-points until another peak at least 75% as large as the original was reached in both directions. Ordered signal peaks were processed iteratively in this fashion, starting from the largest on down, and lesser peaks which were subsumed in the sweep domain of a larger one were removed from separate evaluation. Clusters of sweeps were used to define active phases; silent phases were defined by the span between active phases; cycles were defined as the sum of an active phase and subsequent silent phase.
Processing and quantification of confocal images.
To create high resolution, full-brain composite images, confocal stacks were digitally joined together using the Fiji (ImageJ) Pairwise Stitching52 plug-in.
Quantification of presynaptic sites:
Preparation of confocal images for analysis was performed in Fiji (ImageJ), in which individual color channels were merged into a single TIFF file. Analysis was performed on vaa3d53 by an analyzer blinded to genotype. Puncta associated with labeled cell processes were manually counted and sorted by cell morphological location (e.g. medulla layer). Manual counts for different cell types were cross-referenced with an automated feature detection algorithm to confirm count fidelity.
Counting Trpγ+ nuclei:
Three-dimensional binary masks of the half-brain and one optic lobe were manually generated for each confocal stack using Fiji (ImageJ). Labeled nuclei were segmented from confocal stacks using custom scripts written in MATLAB and were assigned to different regions of the brain using the masks; a function critical to this task was sourced from the MathWorks File Exchange repository (Tim Jerman (2021). Jerman Enhancement Filter (https://github.com/timjerman/JermanEnhancementFilter), GitHub.). The same segmentation approach was used to analyze the co-localization of glia and Trpγ+ nuclei (Extended Data Fig. 4c).
Statistical analysis
Statistical analysis was performed using RStudio. We used either unpaired, two-tailed Welch’s t-test following the Shapiro-Wilk test for normality, or Tukey’s post-hoc test following ANOVA to assess statistical significance of differences between groups. Bonferroni corrections were applied to multiple comparisons where appropriate. Population averages are given as mean ± standard deviation (SD). All measurements were taken from distinct samples.
Extended Data
Extended Data Figure 1. Trpγ is necessary for PSINA.
a. Raw values binned by hour for active phase signal amplitude, sweeps/cycle, cycles/hour, and cycle duration for control (black, n=19) and trpγ null (orange, n=31) pupae. Shaded areas, SD.
b. Active phase average amplitude (left) and sweeps/cycle (right) binned by hour and normalized to control activity during the turbulent stage, between 65 and 80 hAPF, for control (black, n=19), trpγ null (orange, n=31), and trpγ null with Trpγ-D expressed in Trpγ+ cells (cyan, n=4) pupae. Shaded areas, SD.
c. Cycle duration (left) and cycles/hour (right) binned by hour and normalized to control activity between 55 and 65 hAPF. Shaded areas, SD. Genotypes color-matched to B.
d. Representative traces of activity in control (black, n=19), trpγ/TrpγG4 (orange, n=5), trpγ/TrpγDropIn-TG4 (gray, n=5), trpγ/Df(2L)1102 (magenta, n=7), and trpγ/Df(2L)1109 pupae (green, n=7).
e. Average amplitude (left) and sweeps/cycle (right) binned by hour and normalized to control activity between 55 and 65 hAPF. Shaded areas, SD. Genotypes color-matched to D.
f. Active phase average amplitude (left) and sweeps/cycle (right) binned by hour and normalized to control activity during the periodic stage, between 55 and 65 hAPF, for control (black, n=10), trpγ null (orange, n=9), trp null (blue, n=10), and trp null + trpγ null (green, n=10). Shaded areas, SD.
g. Active phase average amplitude (left) and sweeps/cycle (right) binned by hour and normalized to control activity during the periodic stage, between 55 and 65 hAPF, for control (black, n=10), trpγ null (orange, n=10), trpL null (blue, n=10), and trpL null+ trpγ null (green, n=10). Shaded areas, SD.
Extended Data Figure 2. PSINA rescue in trpγ null background.
a. Schematic of Trpγ locus indicating locations of exons (orange rectangles), untranslated regions (gray rectangles), and introns (black lines between exons or untranslated regions) for each isoform. Scale bar, 500 bp.
b. Representative traces of activity in: Trpγ-D expression with TrpγG4 (blue, n=8), Trpγ-D expression with TrpγDropIn-TG4 (magenta, n=7), Trpγ-AB expression with TrpγG4 (green, n=9), Trpγ-AB and Trpγ-D expression with TrpγG4 (red, n=10), double Trpγ-D expression with TrpγG4 (cyan, n=4), control (black, n=19), and trpγ mutant (orange, n=31) pupae.
c. Active phase average amplitude (left) and sweeps/cycle (right) binned by hour and normalized to control activity between 55 and 65 hAPF. All plots contain data for control (black) and trpγ (orange). Shaded areas, SD. Genotypes color-matched to B.
d. Expression control of UAS-Trpγ-D with TARGET (i.e. GAL80ts). In the ‘all-on’ condition, flies are reared at 29°C. In the ‘all-off’ condition, flies are reared at 18°C.
e,g. Representative traces of activity in control pupae (black, n=3), trpγ null pupae (orange, n=3), and (E) all-off pupae (blue, n=3) or (G) all-on pupae (red, n=3).
f,h. Active phase average amplitude (left) and sweeps/cycle (right) binned by hour and normalized to control activity between 55 and 65 hAPF. Shaded areas, SD. Genotypes color-matched to E and G.
Extended Data Figure 3. Synapse formation in the visual system depends on PSINA.
a. Table comparing control synapse counts in cells with sparse synaptic density across EM and light microscopy studies. Values are mean synapse count ± SD, with sample size in parentheses.
b-g. Left: representative micrographs of R8 (B), L1 (C), L4 (D), L5 (E), Dm9 (F), and Tm9 (G) neurons in control (left set) and trpγ (right set) animals with cell membranes (myr::tdTOM, magenta in merged) and presynaptic sites (BRP-V5, cyan in merged) labeled. Right: Brp puncta counts by layer in heterozygous control (black, n=18–61 per cell type) and trpγ (orange, n=26–65 per cell type) animals. Points indicate individual cells. Box-and-whiskers mark 5th, 25th, 50th, 75th, and 95th percentiles. *, p<0.05; **, p<0.01; ***, p<0.001 by Welch’s t-test following Shapiro-Wilk test.
h. Brp puncta counts in Trpγ heterozygotes (black, n=18 for Dm9, n=30 for Tm9), trpγ nulls (orange, n=24 for Dm9, n=30 for Tm9), or trpγ nulls with Trpγ-D expressed in Trpγ+ cells (cyan, n=24 for Dm9, n=30 for Tm9). Boxplots as in B-G. *, p<0.05; **, p<0.01; ***, p<0.001 by Tukey’s post-hoc test following ANOVA for multiple groups.
i. Brp puncta counts in control (black, n = 24) or trpγ null (orange, n = 30) L5 clones generated by MARCM. Boxplots as in B-G. *, p<0.05; **, p<0.01; ***, p<0.001 by Welch’s t-test following Shapiro-Wilk test.
j. Average Brp puncta through development in control (black, n=64–88 per timepoint) or animals with PSINA blocked with pan-neuronally expressed TNT (magenta, n=35–68 per timepoint). Presynaptic sites assessed at 60, 72, and 84 hAPF. Error bars, SD.
Extended Data Figure 4. TrpγG4 drives expression in a dynamic neuronal population during development.
a. MIPs of half-brain confocal stacks from different times during pupal development and early adult life. Nuclei of mCherry-NLS expressing Trpγ+ neurons shown (cyan); reference marker is Ncad (magenta). Average, SD, and number of samples for each time point are printed top-right of panels; these values are plotted in Fig. 4A. Dashed yellow lines mark the median plane. CB, central brain. OL, optic lobe. Scale bar, 100μm.
b. Top: 13μm-thick MIP of a 72 hAPF brain stained for neuronal nuclei (anti-Elav, yellow), Trpγ+ nuclei (mCherry-NLS, cyan), and a reference marker (Ncad, magenta). Image derived from three stitched confocal stacks. Scale bar, 100μm. Bottom: Expanded views of two regions-of-interest (ROIs) boxed in top panel. Columns are neuronal, Trpγ+, and merged channels, left to right. All Trpγ+ nuclei fully captured in the MIP (red asterisks) co-localize with the neuronal stain. Scale bar, 20μm.
c. Top: 13μm-thick MIP of a 72 hAPF brain stained for glial nuclei (anti-Repo, yellow), Trpγ+ nuclei (mCherry-NLS, cyan), and a reference marker (Ncad, magenta). Image derived from three stitched confocal stacks. Scale bar, 100μm. Bottom-left: Histogram of average voxel intensities of segmented Repo+ and Trpγ+ nuclei measured in the anti-Repo channel of the top image. n=5055 (Repo+), 1464 (Trpγ+); half-brain complements analyzed. Inset shows where 9/1464 Trpγ+ cell intensities overlap with the dimmest Repo+ glia. Bottom-right: Histogram of minimum pairwise distance between centroids of 1464 segmented Trpγ+ and Repo+ nuclei. Inset shows all pairs of Trpγ+ and Repo+ nuclei are at least 1μm apart.
d. Representative traces of activity in control pupae (black), pan-neuronal control knockdown pupae (gray, n=2), pan-neuronal Trpγ knockdown (magenta, n=3; green, n =3), pan-glial Trpγ knockdown (red, n=2; blue, n=2) in heterozygous Trpγ background.
e. Active phase average amplitude (left) and sweeps/cycle (right) binned by hour and normalized to control activity between 55 and 65 hAPF. Shaded areas, SD. Genotypes color-matched to D.
Extended Data Figure 5. Trpγ+ neurons are a diverse population.
a-i. Top: 13μm-thick (A-C) or full (D-I) MIPs of 72 hAPF brains stained for neuronal class marker (yellow), Trpγ+ nuclei (mCherry-NLS or GFP-NLS, cyan), and a reference marker (Ncad, magenta). Images (A-C, E-H) derived from three stitched confocal stacks. Scale bar, 100μm. Bottom: Expanded view(s) of ROI(s) boxed in top panel. Columns (D, rows) are class marker, Trpγ+, and merged channels, left to right (D, top to bottom). Marked Trpγ+ nuclei (red asterisks) co-localize with the neuronal class marker. ROI 2 in (G) shows transient PDF-TRI cells (38). Scale bar, 20μm.
Extended Data Figure 6. SPARC3-Out-GAL80 reveals morphologies of individual Trpγ+ neurons.
a. Schematic of the SPARC3-Out-GAL80 cassette. PhiC31 recombines one of two competing attP target sequences with one attB target sequence. Rxn 1 leads to loss of the GAL80 ORF, disinhibiting GAL4-driven effector expression. Rxn 2 preserves Tubulin promoter driven GAL80 expression, maintaining GAL4 inhibition. Three progressively truncated variants for the first attP sequence were designed (25) to bias the recombination in favor of Rxn 2, resulting in frequent (Dense), sporadic (Intermediate), or rare (Sparse) loss of GAL80 and disinhibition of GAL4>UAS expression.
b. Map of pHD-3xP3-DsRed-ΔattP (a CRISPR-HDR-donor precursor) showing multiple cloning sites for homology arm insertion (right).
c. Map of pHD-3xP3-DsRed-ΔattP-CRISPR-donor (example includes homology arms targeting the Su(Hw)AttP5 region of the Drosophila genome).
d. Assembled SPARC3-Out-GAL80 cassette; see Materials and Methods for details. MCS, multiple cloning site. gRNA, guide RNA. HDVR, hepatitis delta virus ribozyme sequence.
e,g. Single Trpγ+ neuron (orange, manually segmented) in the context of others (cyan) labeled using SPARC. Neurons expressing myr::SM-V5. Reference marker (magenta), Ncad. Image MIP of stitched confocal stacks of 72 hAPF brain. Scale bar, 100μm.
f. Trpγ+ visual processing neurons identified in 72 hAPF brains using SPARC. We observed a given neuron up to three times in 30 sparsely labeled brains.
Extended Data Figure 7. Additional characterization of Trpγ+ neuron activity.
a. Representative autocorrelograms from pan-neuronal GCaMP6s in control (empty-GAL4, black), panN-GAL4>Kir2.1 (blue), and TrpγG4>Kir2.1 (orange) pupae.
b,c. Representative micrographs (B) and traces (C) from 2PM imaging of pan-neuronal GCaMP6s in control (empty-GAL4, black), panN-GAL4>Kir2.1 (blue), and TrpγG4>Kir2.1 (orange) pupae. Scale bar, 40μm.
d. Inset: expanded view showing fewer sweeps in panN-GAL4 and TrpγG4 conditions.
e. Representative traces for Trpγ+ neurons expressing GCaMP6s (cyan, n=10) and pan-neuronal expression of GCaMP6s (black, n=10) by wide-field imaging with a ROI encompassing the head.
f. Active phase average amplitude for Trpγ+ neurons expressing GCaMP6s (cyan) binned by hour and normalized to pan-neuronal expression of GCaMP6s (black). Shaded areas, SD.
g,h. AIP of pupae expressing pan-neuronal GCaMP6s (g). ROIs indicate regions used to calculate traces (h) from optic lobes. Scale bar, 200μm.
i. 0-lag correlation between traces in each optic lobe in control (empty-GAL4, black, n=4), and TrpγG4>Kir2.1 (orange, n=4) pupae. Round markers are values from individual time series, bars are averages for each genotype.
j. Correlogram between traces in each optic lobe in TrpγG4>Kir2.1 pupa.
k. Cell-type-specific Brp puncta counts in control (empty-GAL4>Kir2.1 pupae, black, n=35 per cell type), PanN-GAL4>Kir2.1 pupae (cyan, n=40 for Dm9, n=25 for Tm9) and in TrpγG4>Kir2.1 pupae (orange, n=40 cells for Dm9, n=35 cells for Tm9).
Extended Data Figure 8. Silencing Trpγ+ neurons in the central brain, but not the optic lobes, attenuates PSINA.
a. Schematic of spatially-targeted Kir2.1 expression. Both experimental genotypes carry two variants of tubP-GAL80: GAL80ts and one of two FLP-responsive conditional alleles. In the optic lobes, ey-FLP either turns on GAL80 expression by removing the interruption cassette (‘-STOP-’, top) or turns it off by locally excising the FRT-flanked ORF (bottom). Animals are reared at 18°C and shifted 29°C at 40 hAPF to unmask these differential GAL80 expression domains (blue) just prior to PSINA onset; GAL4-driven Kir2.1 expression is disinhibited in the complementary domains (yellow). CB, central brain. OL, optic lobe.
b,c. MIPs of half-brains (top) or optic lobes (bottom) at 60 hAPF in which TrpγG4 is driving Kir2.1 expression in the CB (B) or the OL (C). The OL condition also includes expression in the antennal lobes and a small number of CB neurons. Kir2.1 expression domain detected by staining against 3xHA tagged co-cistronic tdTOM. Scale bar, 100μm.
d,g. AIP of ~60 hAPF pupa expressing GCaMP6s pan-neuronally. CB (D) and OL (G) ROIs used for measuring PSINA outlined (cyan). Scale bar, 200μm.
e,h. PSINA traces from CB (E) and OL (H) for control (no Kir2.1, black, n=5), TrpγG4(CB)>Kir2.1 (red, n=3), and TrpγG4(OL)>Kir2.1 (blue, n=3) genotypes.
f,i. Average amplitude measured in CB (F) and OL (G) normalized to corresponding control activity. Shaded areas, SD. Genotypes color-matched to E.
Extended Data Figure 9. Trpγ+ neurons are necessary for PSINA.
a. Temporal expression control with TARGET; animals shifted from 18°C to 29°C at 40 hAPF.
b. PSINA traces from pan-neuronal GCaMP6s in control (empty-GAL4, black, n=3), panN-GAL4>hid, rpr (blue, n=3), and TrpγG4>hid, rpr (orange, n=3) pupae.
c. Average amplitude normalized to control activity between 55 and 75 hAPF. Shaded areas, SD. Genotypes color-matched to B.
d. PSINA traces from pan-neuronal GCaMP6s in control (empty-GAL4, black, n=7), panN-GAL4>TNT (blue, n=7), and TrpγG4>TNT (orange, n=8) pupae.
e. Average amplitude normalized to control activity between 55 and 75 hAPF. Shaded areas, SD. Genotypes color-matched to D.
f. Representative traces of pupae expressing pan-neuronal GCaMP6s, with TNT expressed in expression domains of the indicated neuronal class. n=4 tested for each genotype.
Extended Data Figure 10. Activation of Trpγ+ neurons increases brain-wide activity frequency.
a-b. Left: PSINA traces from pan-neuronal GCaMP6s in control (empty-GAL4, black, n=3), panN-GAL4>TrpA1 (blue, n=3), and TrpγG4>TrpA1 (orange, n=3) pupae at 18°C (A) or 29°C (B). Right: representative auto-correlograms calculated from the first trace shown for each genotype. Inset (B): expanded view of boxed region. Scale bar, 2min.
c. Activity from pan-neuronal GCaMP6s in control (empty-GAL4, black, n=6), panN-GAL4>TRpA1 (blue, n=6), VGlut-GAL4>TrpA1 (red, n=6), Gad1-GAL4 (green, n=5), TrpγG4>TrpA1 (orange, n=6) pupae at 60 hAPF. Pupae reared at 18°C and shifted to 29°C.
d. MIPs of 60 hAPF brains stained for a nuclear marker (Cherry-NLS, cyan) driven by Gad1- or Vglut-GAL4, and a reference marker (Ncad, magenta). Images derived from three stitched confocal stacks. Scale bar, 100μm.
e. Conceptual circuit organizations for coordinating and propagating PSINA. Metronomes indicate CPGs. Colored arrows indicate Trpγ+ and other relay neurons.
Supplementary Material
Acknowledgments
We thank S. Lawrence Zipursky for enthusiastic discussions of the science, for his unwavering support of the work, and for insightful feedback on the manuscript. For generously sharing fly lines and other reagents, we thank Craig Montell. We thank Thomas R. Clandinin for his support in generating the SPARC3-Out-GAL80 flies. We thank Jeffrey M. Donlea, Volker Hartenstein, David E. Krantz, and Ying Lin for sharing antibodies. On this point, we are especially grateful to Jan A. Veenstra for generously sending a treasure trove of neuropeptide antibodies. We thank Daisuke Hattori for the Kir2.1 flies, Aljoscha Nern and Gerald M. Rubin for the 29C07-FLP flies, the Banerjee Lab at UCLA for the UAS-rpr,-hid flies, Oguz Kanca and Hugo J. Bellen for the TrpγDropIn-TG4 flies, and Shinya Yamamoto and Toshiyuki Takano-Shimizu for the UAS-TRPC4 / TRPC5 flies. We thank members of the Zipursky lab for feedback and discussion.
Funding: B.T.B. is supported by NIH grants F30EY029952 and T32GM008042; OA is supported by NIH grant R01NS123376.
Footnotes
Competing Interests: The authors declare no competing interests.
Data Availability Statement:
The authors declare that all data supporting the findings of this study are available within the paper and its supplementary information files. Correspondence and requests for materials should be addressed to Orkun Akin (akin.orkun@gmail.com).
References
- 1.Blankenship AG & Feller MB Mechanisms underlying spontaneous patterned activity in developing neural circuits. Nat Rev Neurosci 11, 18–29 (2010). [DOI] [PMC free article] [PubMed] [Google Scholar]
- 2.Ackman JB & Crair MC Role of emergent neural activity in visual map development. Curr Opin Neurobiol 24, 166–175 (2014). [DOI] [PMC free article] [PubMed] [Google Scholar]
- 3.Akin O, Bajar BT, Keles MF, Frye MA & Zipursky SL Cell-type-Specific Patterned Stimulus-Independent Neuronal Activity in the Drosophila Visual System during Synapse Formation. Neuron 101, 894–904.e5 (2019). [DOI] [PMC free article] [PubMed] [Google Scholar]
- 4.Galli L & Maffei L Spontaneous impulse activity of rat retinal ganglion cells in prenatal life. Science 242, 90–91 (1988). [DOI] [PubMed] [Google Scholar]
- 5.Meister M, Wong RO, Baylor DA & Shatz CJ Synchronous bursts of action potentials in ganglion cells of the developing mammalian retina. Science 252, 939–943 (1991). [DOI] [PubMed] [Google Scholar]
- 6.Ackman JB, Burbridge TJ & Crair MC Retinal waves coordinate patterned activity throughout the developing visual system. Nature 490, 219–225 (2012). [DOI] [PMC free article] [PubMed] [Google Scholar]
- 7.Bansal A et al. Mice lacking specific nicotinic acetylcholine receptor subunits exhibit dramatically altered spontaneous activity patterns and reveal a limited role for retinal waves in forming ON and OFF circuits in the inner retina. J Neurosci 20, 7672–7681 (2000). [DOI] [PMC free article] [PubMed] [Google Scholar]
- 8.Burbridge TJ et al. Visual circuit development requires patterned activity mediated by retinal acetylcholine receptors. Neuron 84, 1049–1064 (2014). [DOI] [PMC free article] [PubMed] [Google Scholar]
- 9.McLaughlin T, Hindges R & O’Leary DD Regulation of axial patterning of the retina and its topographic mapping in the brain. Curr Opin Neurobiol 13, 57–69 (2003). [DOI] [PubMed] [Google Scholar]
- 10.Sugie A, Marchetti G & Tavosanis G Structural aspects of plasticity in the nervous system of Drosophila. Neural Dev 13, 14 (2018). [DOI] [PMC free article] [PubMed] [Google Scholar]
- 11.Hiesinger PR et al. Activity-independent prespecification of synaptic partners in the visual map of Drosophila. Curr Biol 16, 1835–1843 (2006). [DOI] [PMC free article] [PubMed] [Google Scholar]
- 12.Chen Y et al. Cell-type-specific labeling of synapses in vivo through synaptic tagging with recombination. Neuron 81, 280–293 (2014). [DOI] [PMC free article] [PubMed] [Google Scholar]
- 13.Muthukumar AK, Stork T & Freeman MR Activity-dependent regulation of astrocyte GAT levels during synaptogenesis. Nat Neurosci 17, 1340–1350 (2014). [DOI] [PMC free article] [PubMed] [Google Scholar]
- 14.Takemura SY et al. A visual motion detection circuit suggested by Drosophila connectomics. Nature 500, 175–181 (2013). [DOI] [PMC free article] [PubMed] [Google Scholar]
- 15.Venkatachalam K & Montell C TRP channels. Annu Rev Biochem 76, 387–417 (2007). [DOI] [PMC free article] [PubMed] [Google Scholar]
- 16.Chen TW et al. Ultrasensitive fluorescent proteins for imaging neuronal activity. Nature 499, 295–300 (2013). [DOI] [PMC free article] [PubMed] [Google Scholar]
- 17.Akitake B et al. Coordination and fine motor control depend on Drosophila TRPγ. Nat Commun 6, 7288 (2015). [DOI] [PMC free article] [PubMed] [Google Scholar]
- 18.Kanca O et al. An efficient CRISPR-based strategy to insert small and large fragments of DNA using short homology arms. Elife 8, (2019). [DOI] [PMC free article] [PubMed] [Google Scholar]
- 19.Xu XZ, Chien F, Butler A, Salkoff L & Montell C TRPgamma, a drosophila TRP-related subunit, forms a regulated cation channel with TRPL. Neuron 26, 647–657 (2000). [DOI] [PubMed] [Google Scholar]
- 20.Batut P & Gingeras TR RAMPAGE: promoter activity profiling by paired-end sequencing of 5’-complete cDNAs. Curr Protoc Mol Biol 104, Unit 25B.11 (2013). [DOI] [PMC free article] [PubMed] [Google Scholar]
- 21.McGuire SE, Le PT, Osborn AJ, Matsumoto K & Davis RL Spatiotemporal rescue of memory dysfunction in Drosophila. Science 302, 1765–1768 (2003). [DOI] [PubMed] [Google Scholar]
- 22.Akin O & Zipursky SL Frazzled promotes growth cone attachment at the source of a Netrin gradient in the. Elife 5, (2016). [DOI] [PMC free article] [PubMed] [Google Scholar]
- 23.Takemura SY, Lu Z & Meinertzhagen IA Synaptic circuits of the Drosophila optic lobe: the input terminals to the medulla. J Comp Neurol 509, 493–513 (2008). [DOI] [PMC free article] [PubMed] [Google Scholar]
- 24.Lee T & Luo L Mosaic analysis with a repressible cell marker for studies of gene function in neuronal morphogenesis. Neuron 22, 451–461 (1999). [DOI] [PubMed] [Google Scholar]
- 25.Kurmangaliyev YZ, Yoo J, Valdes-Aleman J, Sanfilippo P & Zipursky SL Transcriptional Programs of Circuit Assembly in the Drosophila Visual System. Neuron 108, 1045–1057.e6 (2020). [DOI] [PubMed] [Google Scholar]
- 26.Baines RA, Uhler JP, Thompson A, Sweeney ST & Bate M Altered electrical properties in Drosophila neurons developing without synaptic transmission. J Neurosci 21, 1523–1531 (2001). [DOI] [PMC free article] [PubMed] [Google Scholar]
- 27.Peng J et al. Drosophila Fezf coordinates laminar-specific connectivity through cell-intrinsic and cell-extrinsic mechanisms. Elife 7, (2018). [DOI] [PMC free article] [PubMed] [Google Scholar]
- 28.Isaacman-Beck J et al. SPARC enables genetic manipulation of precise proportions of cells. Nat Neurosci 23, 1168–1175 (2020). [DOI] [PMC free article] [PubMed] [Google Scholar]
- 29.Chiang AS et al. Three-dimensional reconstruction of brain-wide wiring networks in Drosophila at single-cell resolution. Curr Biol 21, 1–11 (2011). [DOI] [PubMed] [Google Scholar]
- 30.Dana H et al. Sensitive red protein calcium indicators for imaging neural activity. Elife 5, (2016). [DOI] [PMC free article] [PubMed] [Google Scholar]
- 31.Pulver SR, Pashkovski SL, Hornstein NJ, Garrity PA & Griffith LC Temporal dynamics of neuronal activation by Channelrhodopsin-2 and TRPA1 determine behavioral output in Drosophila larvae. J Neurophysiol 101, 3075–3088 (2009). [DOI] [PMC free article] [PubMed] [Google Scholar]
- 32.Crair MC Neuronal activity during development: permissive or instructive. Curr Opin Neurobiol 9, 88–93 (1999). [DOI] [PubMed] [Google Scholar]
- 33.Valdes-Aleman J et al. Comparative Connectomics Reveals How Partner Identity, Location, and Activity Specify Synaptic Connectivity in Drosophila. Neuron 109, 105–122.e7 (2021). [DOI] [PMC free article] [PubMed] [Google Scholar]
- 34.Mulloney B & Smarandache C Fifty Years of CPGs: Two Neuroethological Papers that Shaped the Course of Neuroscience. Front Behav Neurosci 4, (2010). [DOI] [PMC free article] [PubMed] [Google Scholar]
- 35.Tritsch NX, Yi E, Gale JE, Glowatzki E & Bergles DE The origin of spontaneous activity in the developing auditory system. Nature 450, 50–55 (2007). [DOI] [PubMed] [Google Scholar]
- 36.Wang HC et al. Spontaneous Activity of Cochlear Hair Cells Triggered by Fluid Secretion Mechanism in Adjacent Support Cells. Cell 163, 1348–1359 (2015). [DOI] [PMC free article] [PubMed] [Google Scholar]
- 37.Luhmann HJ et al. Spontaneous Neuronal Activity in Developing Neocortical Networks: From Single Cells to Large-Scale Interactions. Front Neural Circuits 10, 40 (2016). [DOI] [PMC free article] [PubMed] [Google Scholar]
- 38.Özel MN et al. Neuronal diversity and convergence in a visual system developmental atlas. Nature 589, 88–95 (2021). [DOI] [PMC free article] [PubMed] [Google Scholar]
- 39.Helfrich-Förster C Development of pigment-dispersing hormone-immunoreactive neurons in the nervous system of Drosophila melanogaster. J Comp Neurol 380, 335–354 (1997). [DOI] [PubMed] [Google Scholar]
- 40.Leong AT et al. Long-range projections coordinate distributed brain-wide neural activity with a specific spatiotemporal profile. Proc Natl Acad Sci U S A 113, E8306–E8315 (2016). [DOI] [PMC free article] [PubMed] [Google Scholar]
- 41.Fischbach KF & Dittrich APM The optic lobe of Drosophila melanogaster. 1. A Golgi analysis of wild-type structure. Cell and Tissue Research 258, 441–475 (1989). [Google Scholar]
- 42.Bainbridge SP & Bownes M Staging the metamorphosis of Drosophila melanogaster. J Embryol Exp Morphol 66, 57–80 (1981). [PubMed] [Google Scholar]
- 43.Brand AH & Perrimon N Targeted gene expression as a means of altering cell fates and generating dominant phenotypes. Development 118, 401–415 (1993). [DOI] [PubMed] [Google Scholar]
- 44.Lai SL & Lee T Genetic mosaic with dual binary transcriptional systems in Drosophila. Nat Neurosci 9, 703–709 (2006). [DOI] [PubMed] [Google Scholar]
- 45.Piper MD & Partridge L Protocols to Study Aging in Drosophila. Methods Mol Biol 1478, 291–302 (2016). [DOI] [PMC free article] [PubMed] [Google Scholar]
- 46.Schindelin J et al. Fiji: an open-source platform for biological-image analysis. Nat Methods 9, 676–682 (2012). [DOI] [PMC free article] [PubMed] [Google Scholar]
- 47.Daniels RW et al. Increased expression of the Drosophila vesicular glutamate transporter leads to excess glutamate release and a compensatory decrease in quantal content. J Neurosci 24, 10466–10474 (2004). [DOI] [PMC free article] [PubMed] [Google Scholar]
- 48.Fei H et al. Mutation of the Drosophila vesicular GABA transporter disrupts visual figure detection. J Exp Biol 213, 1717–1730 (2010). [DOI] [PMC free article] [PubMed] [Google Scholar]
- 49.Park D, Veenstra JA, Park JH & Taghert PH Mapping peptidergic cells in Drosophila: where DIMM fits in. PLoS One 3, e1896 (2008). [DOI] [PMC free article] [PubMed] [Google Scholar]
- 50.Cabrero P et al. The Dh gene of Drosophila melanogaster encodes a diuretic peptide that acts through cyclic AMP. J Exp Biol 205, 3799–3807 (2002). [DOI] [PubMed] [Google Scholar]
- 51.Terhzaz S, Rosay P, Goodwin SF & Veenstra JA The neuropeptide SIFamide modulates sexual behavior in Drosophila. Biochem Biophys Res Commun 352, 305–310 (2007). [DOI] [PubMed] [Google Scholar]
- 52.Preibisch S, Saalfeld S & Tomancak P Globally optimal stitching of tiled 3D microscopic image acquisitions. Bioinformatics 25, 1463–1465 (2009). [DOI] [PMC free article] [PubMed] [Google Scholar]
- 53.Peng H, Ruan Z, Long F, Simpson JH & Myers EW V3D enables real-time 3D visualization and quantitative analysis of large-scale biological image data sets. Nat Biotechnol 28, 348–353 (2010). [DOI] [PMC free article] [PubMed] [Google Scholar]
Associated Data
This section collects any data citations, data availability statements, or supplementary materials included in this article.
Supplementary Materials
Data Availability Statement
The authors declare that all data supporting the findings of this study are available within the paper and its supplementary information files. Correspondence and requests for materials should be addressed to Orkun Akin (akin.orkun@gmail.com).


