Abstract
Antimalarial resistance develops and spreads when spontaneously occurring mutant malaria parasites are selected by concentrations of antimalarial drug which are sufficient to eradicate the more sensitive parasites but not those with the resistance mutation(s). Mefloquine, a slowly eliminated quinoline-methanol compound, is the most widely used drug for the treatment of multidrug-resistant falciparum malaria. It has been used at doses ranging between 15 and 25 mg of base/kg of body weight. Resistance to mefloquine has developed rapidly on the borders of Thailand, where the drug has been deployed since 1984. Mathematical modeling with population pharmacokinetic and in vivo and in vitro pharmacodynamic data from this region confirms that, early in the evolution of resistance, conventional assessments of the therapeutic response ≤28 days after treatment underestimate considerably the level of resistance. Longer follow-up is required. The model indicates that initial deployment of a lower (15-mg/kg) dose of mefloquine provides a greater opportunity for the selection of resistant mutants and would be expected to lead more rapidly to resistance than de novo use of the higher (25-mg/kg) dose.
Malaria is the most important parasitic disease of humans. Malaria parasites infect a large proportion of the indigenous peoples of tropical countries, and the infection is estimated to cause between 0.5 million and 2.5 million deaths each year, mostly in sub-Saharan Africa. This heavy death toll is held in check by the widespread availability of cheap and effective antimalarial drugs. The malaria parasite, however, has evolved mechanisms of resistance to most of these available antimalarials, and morbidity and mortality rise as efficacy falls (18).
Resistance is thought to arise from spontaneous chromosomal mutations in malaria parasites which confer a selective survival advantage in the presence of antimalarial drugs. Selection of resistant mutants is most likely to occur when a large number of parasites encounter submaximal concentrations of the antimalarial drug in blood. At these concentrations drug-resistant parasites are more likely to have a significant survival advantage over drug-sensitive parasites, as most initial resistance mutations do not confer very large reductions in susceptibility (18). De novo mutation arises rarely. These mutants will spread only if they survive to be transmitted, and their resistance advantage outweighs any fitness disadvantage the resistance mutation may confer. Selection can occur with inadequate primary treatment or when a newly acquired infection encounters residual concentrations of antimalarials following treatment of a previous infection. In the latter case the chance of resistance selection is higher for antimalarial drugs with long terminal elimination half-lives, as, by definition, these exist in the blood at subtherapeutic concentrations longer (14). Once a resistant mutant parasite population has been selected in an individual, the probability and rate at which the mutants spread will depend on several factors including the degree of reduced susceptibility, the characteristics of the parasite population, and the pattern of drug use. The same factors which give rise to de novo selection will also facilitate spread, although for mutations which confer small reductions in susceptibility, preferential survival is initially more likely when newly acquired infections encounter residual levels in blood. Only when considerable resistance has developed can such parasites survive the much higher concentrations of antimalarial drugs in blood that follow immediately after treatment is given.
Mefloquine is an antimalarial drug used for the oral treatment of uncomplicated multidrug-resistant falciparum malaria. It has a terminal elimination half-life of 2 to 3 weeks in patients with malaria (16). The elimination phase of the drug is bi- or triexponential, with a slow decline in concentrations in blood in the terminal phase, which provides a considerable period during which blood mefloquine concentrations are associated with intermediate (e.g., 20 to 80%) inhibitory activity against Plasmodium falciparum. Thus, as for bacteria (8), an important factor that determines the propensity to develop resistance may be the time taken in vivo for drug concentrations to fall between approximately 80 and 20% of the concentrations at which they exhibit maximum inhibitory effects against the prevalent parasite populations (i.e., a combination of the pharmacokinetic and pharmacodynamic properties of the drug) (18).
This paper uses mathematical modeling based on in vivo and in vitro data to compare the development of resistance with the de novo use of the two most widely used antimalarial doses of mefloquine (15 and 25 mg/kg of body weight).
MATERIALS AND METHODS
Mathematical model.
The aim of this section is to find a mathematical equation that describes the change in total parasite burden with time, in the presence of drug.
For de novo selection of resistant mutants, if one malaria parasite in every 10x malaria parasites contains a mutation that confers a significant reduction in susceptibility to the drug being used, then the probability that a patient harbors such a resistant mutant is (1/10x) · Pt, where Pt is the number of parasites in a single patient at time t.
To find a mathematical equation that describes the change in total parasite burden over time in the presence of the drug, a slightly altered form of the mathematical model published by Hoshen et al. (3) has been used.
Pt is a balance between the average parasite multiplication rate and the proportion of parasites that are killed and cleared by the antimalarial and host defenses. Thus, the change in parasitemia can be described as (dP/dt) = a · P − f(C) · P − f(I) · P, where a is a parameter representing the growth rate constant of the parasite, f(C) is a function, dependent on the concentration of the drug (C), that represents the killing of the parasites; and f(I) is a function that represents the host's background immunity to malaria.
The host contribution, which reflects background immunity, contributes relatively little to the drug effect at high concentrations but becomes important at low drug concentrations. It will not be used further in this analysis, although in areas of high stable transmission where partially effective or ineffective drugs are used, it is the main determinant of therapeutic outcome. Thus, (dP/dt) = a · P − f(C) · P.
Killing is considered a first-order process which continues unchanged throughout the process of parasite elimination (1). It should be noted that malaria is exclusively an intravascular infection (extravascular forms are not pathogenic) and that the antimalarial activity is related to the concentrations of free (unbound) antimalarial drug in plasma.
Parasite killing can then be described by a sigmoid Emax model:
 |
where k1 is the first order rate constant of parasite killing, γ is the slope of the concentration-effect curve, C is the antimalarial drug concentration, and C50 is the drug concentration which kills 50% of the parasites. The plasma antimalarial drug concentration in vivo is not constant; it rises as the drug is absorbed and then declines over time as the drug distributes throughout the body and the drug is eventually eliminated. In the case of mefloquine, the elimination phase has been shown to be biexponential or triexponential (16). Assuming that the intermediate concentrations which are selective occur only during the terminal phase (at least at low or intermediate levels of resistance), a monoexponential elimination phase corresponding to the terminal elimination phase of the drug was used. Therefore, C = C0 · e−k · t where t is time (in days), k is the terminal elimination rate constant of mefloquine, and C0 is maximum concentration of mefloquine (i.e., Cmax).
Pt was determined by integrating (dP/dt) (see the Appendix). The following solution results:
 |
where P0 is the total parasite burden at time zero (i.e., before administration of mefloquine).
Parameter estimation and statistical analysis.
In nonimmune subjects, the multiplication rate of the asexual stages of P. falciparum in the blood averages 6-fold and can reach 20-fold per cycle (5, 6). For this simulation, a was calculated by assuming that a single asexual malaria parasite multiplies 10-fold every 2 days. This gives a growth rate constant a of 1.15 (ln 10/2). The terminal elimination rate constant (k) of the drug was assumed to be 0.036 (per day) (11) following administration of a treatment dose of mefloquine. The maximum parasite killing rate resulting from mefloquine was assumed to be 99% per cycle or 90%/day, which corresponds to a k1 of 3.45/day. This corresponds to a parasite reduction ratio (PRR) of 100, a relatively poor antimalarial effect, but one that has been documented and that is associated with mefloquine resistance (12, 18). Killing rates up to 99.9% per cycle may occur with mefloquine. The artemisinin derivatives have been shown to have the highest PRRs of all the antimalarial drugs: greater than 10,000, or a reduction of 99.99% parasites per 2-day asexual life cycle (17). As the mutational events which may confer resistance occur randomly, resistant mutants are more likely to occur in high-biomass infections. We have therefore chosen a worst-case scenario of a relatively high-biomass P. falciparum infection corresponding to a total parasite burden at time zero of 1012 parasites in an adult (which corresponds to a parasite count of approximately 100,000/μl, or 2% parasitemia). The parameter estimates chosen and presented above do not represent an average patient but, instead, represent a patient with a relatively high level of parasitemia from an area with existing mefloquine resistance.
For the parameter C0 the value of 1,200 ng/ml was chosen and was derived from population pharmacokinetic modeling of data for 24 patients treated with a single mefloquine dose of 25 mg/kg as monotherapy (11). The parameter estimates and their respective variances from the derived population pharmacokinetic model (Table 1) were also used to simulate 1,000 pharmacokinetic profiles. The distribution of the intersubject variability of the pharmacokinetic parameters was lognormal, while the residual error was normally distributed (Table 1). The intersubject variability values for the different pharmacokinetic parameters were assumed to be independent of each other. The 1,000 simulations were performed with the computing package QBASIC. These simulated profiles were used to obtain estimates of the lowest and highest mefloquine concentrations that would be achieved in a population.
TABLE 1.
Parameters used for simulation of pharmacokinetic profiles
| Parametera | Estimate (SE) | Estimateb |
|---|---|---|
| CL/F (liter/kg/day) | 0.733 (0.051) | 0.704 |
| V/F (liter/kg) | 20.37 (2.53) | 20.56 |
| ωCL/F | 0.15 | 0.16 |
| ωV/F | 0.56 | 0.55 |
| Residual additive error (ςɛ [ng/ml]) | 180.4 |
CL/F, clearance divided by the fraction of drug absorbed; V/F, total apparent volume of distribution divided by the fraction of drug absorbed; ωCL/F and ωV/F, intersubject variability in CL/F and V/F, respectively, modeled with multiplicative error models.
Estimates obtained from nonlinear mixed-effects modeling of the 1,000 simulated pharmacokinetic profiles.
We assumed that one schizont releases 10 potentially viable merozoites (approximately half of the average total number released), which means that the MIC at which the net parasite multiplication rate is unity corresponds approximately to the 90% effective concentration (EC90).
Now, if the MIC is the concentration at which the total parasite burden is not changing (i.e., a transient steady state), then (dP/dt) = a · P − f (MIC) · P = 0. Substituting for f(MIC),
 |
 |
Assuming that the MIC is approximately equal to EC90,
 |
The EC90 in vivo is unknown, but it must be related to the EC90 in vitro. However, because in vitro susceptibility assessments are conducted in the absence of plasma (to which mefloquine is reported to bind avidly), platelets, and white cells, the two are not equivalent. Unfortunately, because mefloquine also binds to laboratory ware, notably plastic, precise estimates of plasma protein binding are not available. Thus, EC90 (in vivo) is equal to m · EC90 (in vitro), where m is an unknown parameter. For this paper m was given the value of 10. This value was chosen empirically.
The EC90 (in vitro) was derived from modeling of in vitro concentration-effect curves, where the effect measure is inhibition of parasite uptake of [3H]hypoxanthine. It was assumed that the slope (γ) of the concentration-effect curve in vivo is the same as that observed in vitro.
For the parameters γ and EC90, population estimates were derived from nonlinear mixed-effect modeling of in vitro concentration-effect curves for mefloquine (7). Nonlinear mixed-effects models produce parameter estimates for the complete drug population and posterior estimates for each infecting isolate.
The data set contained a total of 415 in vitro concentration-effect curves for P. falciparum isolates collected by three different laboratories based in Thailand.
For in vitro susceptibility testing, all laboratories used a semiautomated dose-response assay as described by Desjardins et al. (2) and Webster et al. (15) and used the same beta counter. Growth of synchronous parasite isolates or cultures was estimated by using parasite uptake of a radioactive DNA precursor, [3H]hypoxanthine, as a measure. The percent growth at different mefloquine concentrations was calculated as the proportion of the counts in the drug-free wells. Background counts (unparasitized, drug-free wells) were subtracted from all counts.
The U.S. Armed Forces Research Institute of Medical Sciences, Bangkok, Thailand, measured 345 curves. The samples used in the dose-response assays were collected in field trials conducted throughout Thailand between 1990 and 1994.
The Wellcome Unit, Bangkok, measured 44 dose-response curves. The samples were collected during 1997 and 1998 from the Hospital for Tropical Diseases, Bangkok, and on the western border of Thailand.
The Shoklo Malaria Research Unit measured 26 dose-response curves. These were collected from refugee camps situated along the western border of Thailand. The mefloquine sensitivities of the 415 isolates cover a wide range, from fully sensitive to highly resistant, which allow estimates of the best and worst possible scenarios for γ and EC90.
The pharmacodynamic model fitted was the following sigmoid inhibitory effect model:
 |
This is a reparameterized version of the standard sigmoid inhibitory effect model, where EC50 equals EC90/91/γ. E represents the proportion of uptake of [3H]hypoxanthine in the nucleoprotein of the parasites in drug-free control wells corresponding to unrestrained growth in vitro. The maximum effect occurs when there is no uptake of [3H]hypoxanthine (no growth). E0 represents the minimum percent growth, Emax is the maximum percent growth, EC90 is the concentration of mefloquine required to inhibit 90% of the control parasites' hypoxanthine uptake, and γ is the slope of the curve. It should be noted that the exact relationship between inhibition of hypoxanthine uptake and growth inhibition has not been characterized.
Interstrain variabilities in Emax, E0, γ, and EC90 were modeled with multiplicative error models. Multiplicative error models ensure that the individual strain parameters (e.g., Emax,i) are greater than zero and that their distributions are skewed to the right. The models are as follows:
 |
 |
 |
 |
The interstrain variability (η) values for the four parameters listed above were assumed to be independent of each other.
The residual intrastrain error was modeled by using an additive error model since the error between the observed and predicted values was observed to be constant: Eij = Epij + ɛij. Emax,i, E0,i, γi, and EC90,i are the pharmacodynamic parameters for the isolate, and, Emax, E0, γ, and EC90 are the population means. ηiEmax, ηiE0, ηiγ, and ηiEC90 are random effects with zero mean and variances ς2Emax, ς2E0, ς2γ, and ς2EC90, respectively. They represent the interisolate variability for each of the parameters. The magnitude of this variability is expressed as a coefficient of variation. Eij is the jth measure of effect for the ith strain, and Epij is the jth predicted measure of effect for the ith strain. ɛij is the residual intrasubject error term and is assumed to be randomly and normally distributed with a mean of zero and a variance of ς2. The nonlinear mixed effects procedure (NLME) procedure (7) of the SPLUS data program (SPLUS 4.5 for Windows; Mathsoft, Inc.) was used to calculate estimates of the population pharmacodynamic parameters (Emax, E0, γ, EC90) and their respective interstrain variances (ηEmax, ηE0, ηγ, ηEC90). The program also provides estimates of the residual random intrastrain error (ɛ) and the variances of the interstrain error terms (ς2Emax, ς2E0, ς2 γ, ς2EC90). The goodness of fit of each model (e.g., models with different numbers of random effects) was determined by the change in the objective function (minus twice the log likelihood of the data). A significant drop in the objective function (with use of the χ2 distribution) determined the model that best described the data. The goodness of fit of each model was also determined by the precision of the parameter estimates and the examination of the scatter plot of residuals versus the predicted measure of effect.
RESULTS
In vitro concentration-effect curves.
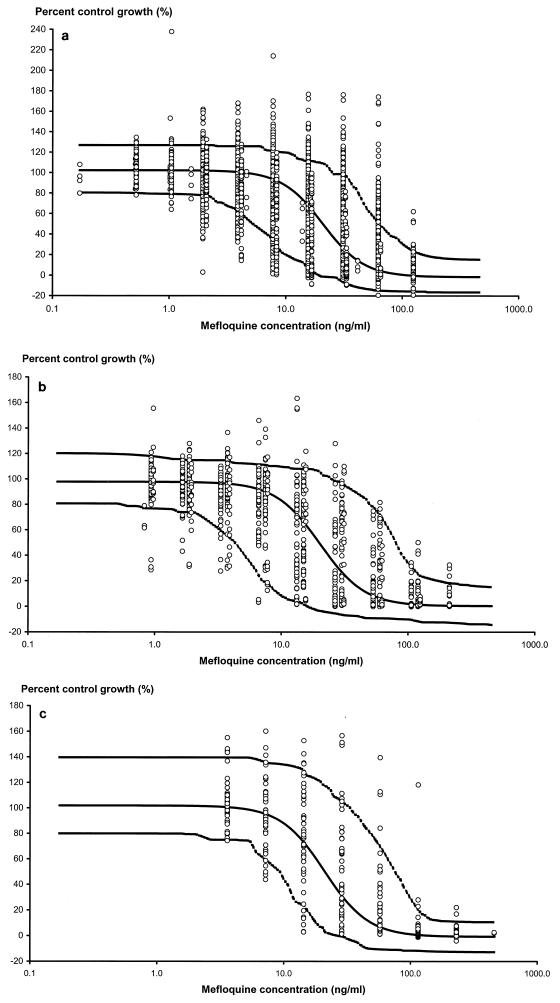
Data collected from three different laboratories in Thailand were modeled to estimate parameters that describe the in vitro concentration-effect relationships for mefloquine. The model that gave the best fit to the three different sources of data was the inhibitory sigmoid Emax effect model with Emax, EC90, and γ fitted as random effects. Fitting of E0 as a random effect did not significantly reduce the objective function. The mean population pharmacodynamic parameters of the final model for the isolates from the three laboratories were similar (Table 2). These data were then combined, and the sigmoid Emax model was fitted to all 415 isolates (Table 2). The population estimate of EC90 (population estimate, 50.4 ng/ml) had a 95% prediction interval (PI) from 213 ng/ml down to 12 ng/ml. The population estimate of the slope of the concentration-effect curve was 2.50, with a 95% PI of 1.22 to 5.13. The observed and population predicted effect measures (percent uptake of [3H]hypoxanthine) versus mefloquine concentrations for the three laboratories are shown in Fig. 1a, b, and c.
TABLE 2.
Population pharmacodynamic parameters derived from nonlinear mixed-effects modeling of the in vitro mefloquine susceptibility data
| Parametera | AFRIMSb | Wellcome Unit | SMRUc | All 415 strains |
|---|---|---|---|---|
| EC90 (ng/ml) | 51.08 (2.20)d | 49.00 (6.64) | 53.88 (7.49) | 50.43 (1.98) |
| 95% PI for EC90 (ng/ml) | 12.55–207.84 | 8.89–270.15 | 13.93–208.34 | 11.96–212.56 |
| γ | 2.44 (0.06) | 2.47 (0.18) | 3.19 (0.22) | 2.50 (0.06) |
| 95% PI for γ | 1.21–4.92 | 1.03–5.93 | 1.85–5.49 | 1.22–5.13 |
| Emax (%) | 102.30 (0.69) | 97.85 (1.59) | 103.96 (3.38) | 101.89 (0.64) |
| E0 (%) | −1.56 (0.46) | 0.36 (0.63) | 2.24 (0.69) | −0.76 (0.35) |
| ωECmax | 0.106 | 0.097 | 0.158 | 0.110 |
| ωEC90 | 0.716 | 0.871 | 0.690 | 0.734 |
| ωγ | 0.358 | 0.447 | 0.277 | 0.367 |
| ςɛ (% residual error) | 10.85 | 8.64 | 6.76 | 10.31 |
ωECmax, ωEC90, and ωγ, interstrain variability for Emax, EC90, and γ. PI, prediction interval.
AFRIMS, U.S. Armed Forces Research Institute of Medical Sciences.
SMRU, Shoklo Malaria Research Unit.
Standard errors are given in parentheses.
FIG. 1.
Percent uptake of [3H]hypoxanthine compared to that in drug-free control wells for various mefloquine concentrations. The solid line shows the fit of the data and represents the predicted concentration-time profile for the population mean. The outer, dashed lines represent the 90% prediction intervals. The three panels show the fits for the following data sets: U.S. Armed Forces Research Institute of Medical Sciences (a), Wellcome Unit, Bangkok (b), and the Shoklo Malaria Research Unit (c).
Pharmacokinetics of mefloquine.
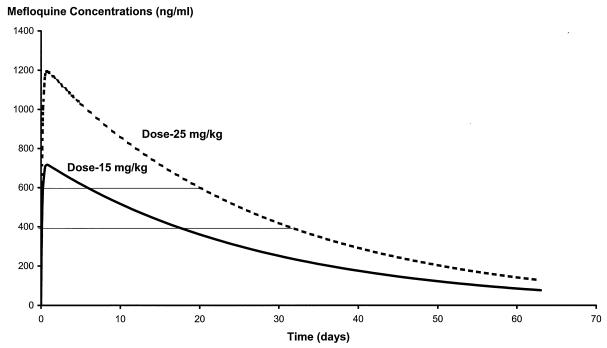
The terminal elimination rate constant is dose independent, and so the time over which the infecting parasite population is exposed to intermediate (20 to 80%) inhibitory concentrations is unrelated to the dose. In the case of mefloquine this is approximately 11 days (Fig. 2). An important factor driving the selection of resistance, however, is the number of parasites (Pt) exposed to these drug levels which give submaximal effects. The concentration range in whole blood that gave intermediate levels of growth inhibition was chosen as 400 to 600 ng/ml. As the precise relationship between in vivo and in vitro concentration-effect relations is not known, this range cannot be defined precisely. This range was chosen because in 1990, when mefloquine resistance was first detected in Thailand, the mean (95% CI) concentration in serum at the time of first recrudescence was 638 ng/ml (546 to 730 ng/ml) (9). This represented a concentration capable of sustaining growth in the parasites infecting 29% of patients. We chose a slightly lower concentration range to reflect an earlier stage of resistance. These parasites exposed to “selective” levels of mefloquine in blood are derived from two sources: (i) those remaining from the initial infection, which, in turn, depends on the starting biomass and susceptibility, and (ii) the frequency with which newly acquired infections would emerge during this period.
FIG. 2.
Simulated pharmacokinetic profiles for the two standard mefloquine doses, 15 and 25 mg/kg, obtained with the parameter estimates given in Table 1.
Predicting therapeutic outcomes.
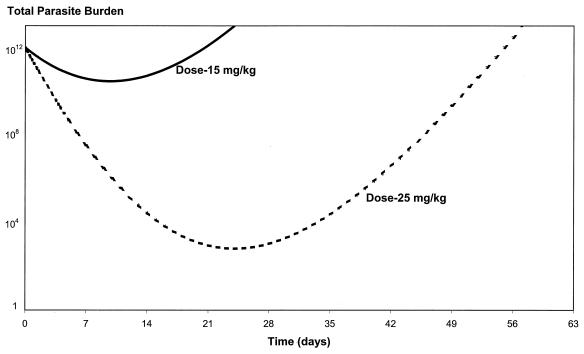
Figure 3 shows the model simulations of the total parasite numbers versus time for the two commonly used mefloquine doses of 15 and 25 mg/kg, based on the parameter estimates in Table 3. The estimate for C50 is derived from the population estimates of EC90 and γ. Both EC90 and γ are the population estimates from nonlinear mixed-effects modeling of the in vitro data for isolates from Thailand.
FIG. 3.
Total malaria parasite burden versus time for the two standard mefloquine doses, 15 and 25 mg/kg, based on the PK/PD parameter estimate in Table 3. The initial parasite burden corresponds to a parasite count of approximately 100,000/μl, or 2% parasitemia, in an adult with falciparum malaria.
TABLE 3.
Parameter estimates derived from population pharmacokinetic (C0 and k) and pharmacodynamic (γ and C50) modeling and a previously published article (a and k1)a
| Parameter | Estimate |
|---|---|
| P0 | 1012 |
| a | 1.15/day |
| k | 0.036/day |
| k1 | 3.45/day |
| C0 | 1,200 ng/ml (single dose of 25 mg/kg) |
| C0 | 717 ng/ml (single dose of 15 mg/kg) |
| γ | 2.50 |
| C50 | 665.4 ng/ml [m · 50.43 · (2)1/2.5]b |
Article of White (17).
Where m is equal to 10 and EC90 is equal to 50.43 ng/ml.
With the lower dose there are more parasites at all times (including during the period of intermediate or selective mefloquine concentrations) compared to the number of parasites with the higher dose of 25 mg/kg. If the parasite populations are all more drug sensitive than those given in the example, then the differential advantage of the higher dose is smaller. Thus, as resistant mutants are selected, the differential advantage increases, accelerating the apparent emergence of resistance. Furthermore, it is apparent that with the starting parameters chosen for the model in this case (which represented a worse-case scenario and which were consistent with a significant level of resistance), the patient will not be cured with a dose of 15 mg/kg for any total parasite burden on admission since a nonimmune person is cured of malaria only if the total parasite burden falls below one parasite. The same patient would be cured with a dose of 25 mg/kg if the total burden on admission did not exceed 109 parasites. With lower levels of mefloquine resistance (or greater background immunity), an increasing proportion of patients treated with 15 mg/kg would be cured.
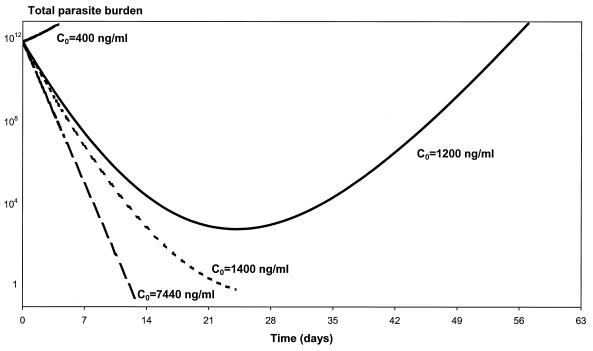
Other factors besides the dosage can affect the maximum concentration achieved. Acute malaria may affect absorption of drugs because of reduced food intake, vomiting, reduced gastric motility and visceral blood flow and change the apparent volume of distribution. Figure 4 depicts the parasite-time profiles for the population mean Cmax following the administration of 25 mg of mefloquine per kg (defined as C0 in our paper) and for the minimum and maximum Cmax values for the 1,000 simulated pharmacokinetic profiles. With a dose of 25 mg/kg the mean Cmax was 1,200 ng/ml, with a range from 400 to 7,440 ng/ml. With the starting parameters of the model, the absolute minimum Cmax required to cure an adult patient with an admission parasitemia of 2% is 1,400 ng/ml. Nonlinear mixed-effects modeling of the 1,000 simulated pharmacokinetic profiles produced parameter and variance estimates similar to those used in the original simulation of the 1,000 profiles (Table 1).
FIG. 4.
Relationship between parasite clearance over time and maximum mefloquine concentration (C0) in blood. In this example, P0 is 1012, a is 1.15/day, k is 0.036/day, k1 is 3.45/day, γ is 2.5, and C50 is 665.4 ng/ml.
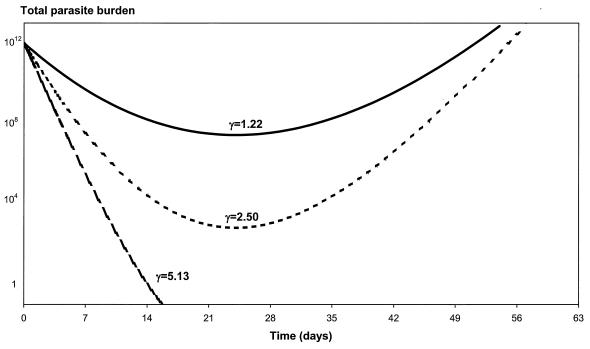
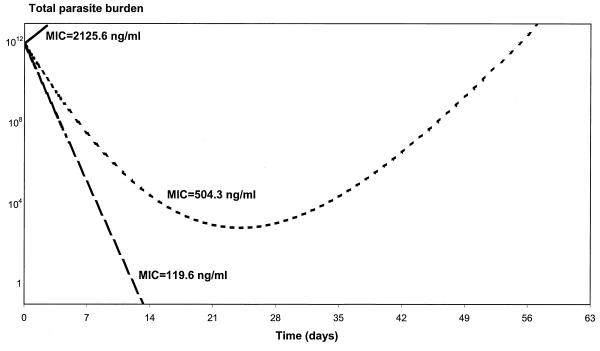
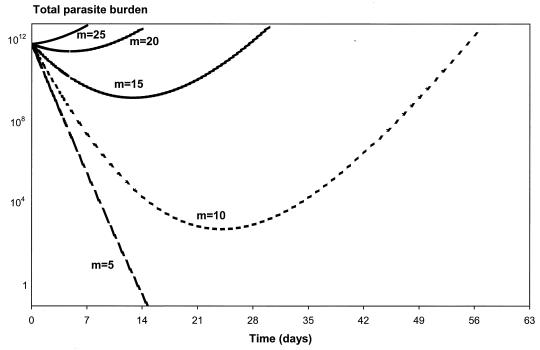
The effects of varying the values of the parameters γ, MIC in vivo, and m on the parasite number-versus-time profiles are shown in Fig. 5, 6, and 7. The flatter the slope of the concentration-effect curve, the more likely the patient will suffer a subsequent recrudescence of the infection (Fig. 5). For the lower limit (γ = 1.22) and the population mean estimate (γ = 2.50), the parasites never cleared and their numbers started to rise again about 3 weeks following treatment. Patients will start to fail treatment with mefloquine if the slope of the concentration-effect curve drops below 3.5. Increases in the in vivo MIC will also increase the risk of treatment failure (Fig. 6). For example, if the in vivo MIC is 120 ng/ml, all the parasites are cleared from the body in less than 2 weeks. If the MIC in vivo increases to 2,126 ng/ml (the upper limit of the 95% PI of the population estimate), then the level of parasitemia will continue to rise following treatment (R3 resistance). If the MIC in vivo is fivefold the EC90 in vitro (i.e., m = 5), then all the parasites are cleared from the body at 2 weeks (Fig. 7). However, if the MIC in vivo is at least 20 times larger than the EC90 in vitro (i.e., m = 20), the level of parasitemia keeps rising following treatment. For m equal to 10 and 15, the parasites never clear and their numbers start to rise again at about 3 and 2 weeks, respectively.
FIG. 5.
Relationship between parasite clearance over time and the slope of the concentration-effect curve (γ). In this example, P0 is 1012, a is 1.15/day, k is 0.036/day, C0 is 1,200 ng/ml, k1 is 3.45/day, and C50 is 665.4 ng/ml.
FIG. 6.
Relationship between parasite clearance over time and the MIC in vivo. In this example, P0 is 1012, a is 1.15/day, k is 0.036/day, C0 is 1,200 ng/ml, k1 is 3.45/day, and γ is 2.5.
FIG. 7.
Relationship between parasite clearance over time and m (scalar value relating EC90 in vitro to MIC in vivo). In this example, P0 is 1012, a is 1.15/day, k is 0.036/day, C0 is 1,200 ng/ml, k1 is 3.45/day, γ is 2.5, and EC90 in vitro is 50.43 ng/ml.
Ratio of Cmax to MIC in vivo.
The ratio of the Cmax to the MIC, a widely used parameter in anti-infective drug pharmacodynamic modeling, is probably an important determinant of outcome in the case of antimalarial treatment with mefloquine.
The function Pt can be rewritten as
 |
where R is equal to C0/MIC. R will decrease with increasing resistance in areas where the treatment dose is fixed, and R will remain constant if the treatment dose is increased commensurate with the increase in resistance.
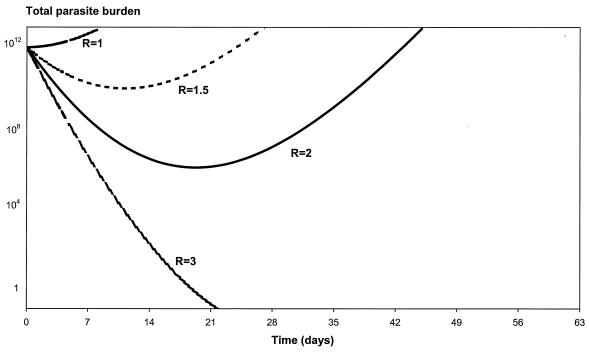
Figure 8 shows the in vivo parasite number-time profiles for R equal to 1, 1.5, 2, and 3. If the Cmax is three times greater than the MIC, the patient will be cured of malaria (all the asexual-stage parasites will be cleared from the body within 3 weeks). The infection will recrudesce if the Cmax achieved is only twofold the in vivo MIC.
FIG. 8.
Relationship between parasite clearance over time and the ratio of maximum mefloquine C0 to MIC (R). In this example, P0 is 1012, a is 1.15/day, k is 0.036/day, k1 is 3.45/day, and γ is 2.5.
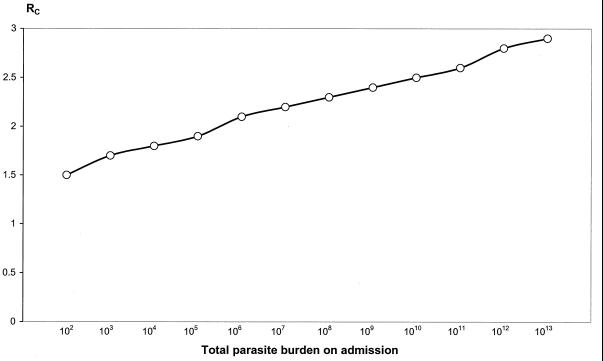
We can define RC as the minimum value of R at which the patient will still be cured of malaria. Rc occurs when the minimum value of Pt is less than or equal to 1. To find the minimum value of Pt, the derivative (dP/dt) is set equal to zero and the equation is solved for t. This gives the time when the minimum parasitemia (tmin) occurs: tmin = loge(R1/k). Substitution of tmin into Pt gives the following equation:
 |
The above equation cannot be solved analytically; therefore, RC is derived numerically.
Figure 9 plots RC over the full range of possible parasite burdens.
FIG. 9.
Relationship between the minimum value of C0 to MIC ratio (RC) required to clear all parasites and the total body parasite burden on admission. In this example, a is 1.15/day, k is 0.036/day, k1 is 3.45/day, and γ is 2.5.
Benefit of a mefloquine dose of 25 mg/kg over a dose of 15 mg/kg.
As stated earlier, for patients with comparable infections, the total parasite burden exposed to submaximally effective blood concentrations is greater for those patients receiving 15 mg/kg than for those patients receiving the larger dose of 25 mg/kg.
If we assume that when the whole-blood mefloquine concentration falls below 600 ng/ml the patient is exposed to drug levels which give submaximal effects (i.e., 600 ng/ml represents the minimal parasiticidal concentration), then blood mefloquine levels fall below the minimal parasiticidal concentration on day 6 for those patients receiving 15 mg/kg and on day 20 for those receiving 25 mg/kg. On these days the total parasite burden predicted for patients receiving 15 mg of mefloquine per kg in the earlier example was 4.87 × 10¹⁰ parasites, and for those receiving 25 mg/kg it was only 1,152 parasites; this equates to a 4.23 × 10⁷-fold difference. If the selective range is lower, all the parasites will have been eliminated by mefloquine before concentrations decline to the selective range if 25 mg/kg is given initially.
Time to recrudescence.
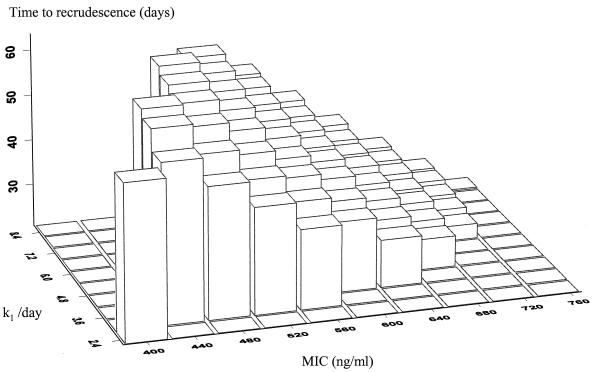
The interval between administration of mefloquine antimalarial treatment and recrudescence of the patient's infection depends on the killing rate of the drug and the level of resistance of the parasites. Figure 10 is a three-dimensional plot illustrating the relationship between three parameters: the time of recrudescence, k1, and the in vivo MIC. To create Fig. 10, parasite number-versus-time curves were simulated for patients receiving the high dose of mefloquine (25 mg/kg). The pharmacokinetic parameters used were the mean parameter estimates from the population pharmacokinetic modeling of mefloquine monotherapy conducted in northwestern Thailand: Cmax = 1,200 ng/ml and k = 0.036 /day (11). Those curves in which the level of parasitemia fell below the level of detection (defined as 50 parasites/μl, or 5 × 10⁸ parasites in the body) before day 7 were selected. If k was ≤1.2 and the MIC was ≤360 ng/ml, the parasitemia does not clear by day 7 (R2 or R3 resistance). The time of recrudescence is the time at which the parasites can be detected again microscopically. As k1 increases, that is, the drug has a higher PRR or greater parasiticidal activity, cure rates will increase, but for those few failures which do occur, the interval from treatment to recrudescence occurs later. With higher levels of resistance (i.e., a high MIC), the patients' infections will recrudesce earlier. The time to recrudescence was normally distributed with a mean ± standard deviation of 42 ± 11 days, with a range from 20 up to 64 days. Table 4 presents the distribution of times to recrudescence for different levels of resistance (i.e., various MICs in vivo).
FIG. 10.
Time to recrudescence following treatment with mefloquine at 25 mg/kg as a function of MIC in vivo and killing rates (k1). The z axis is the time to recrudescence, the y axis is the killing rate of mefloquine (k1), and the x axis is the MIC in vivo. The pharmacokinetic parameters used in the simulation were the population mean values as described previously from studies in northwestern Thailand (11). Nonraised rectangles represent two possible scenarios: either the patient is cured or at day 7 the parasites are still detectable. This illustrates that for relatively drug-sensitive parasites (MIC, < 500 ng/ml) the infections are all cured with high killing rates and that with low killing rates recrudescences occur long after the conventional follow-up period of 28 days. Conversely, with highly resistant parasites, long follow-up (i.e., >42 days) is not necessary.
TABLE 4.
Distribution of time to recrudescence for varying levels of resistance
| MIC in vivo (ng/ml) | Time to recrudescence (days)
|
|
|---|---|---|
| Mean (SD) | Range | |
| 500 | 56.0 (6.2) | 45–64 |
| 525 | 52.0 (5.5) | 42–59 |
| 550 | 47.4 (4.9) | 38–53 |
| 575 | 44.0 (3.8) | 37–49 |
| 600 | 40.0 (3.2) | 34–44 |
| 625 | 36.4 (2.8) | 31–40 |
| 650 | 33.0 (2.3) | 29–36 |
| 675 | 30.0 (1.7) | 27–32 |
| 700 | 26.8 (1.3) | 25–28 |
DISCUSSION
The development of resistance to antimalarial drugs is a major threat to the health of people living in tropical countries. The speed at which resistance develops is affected considerably by the pattern of antimalarial drug use. Uncontrolled self-medication with inadequate treatment courses provides a particularly potent selection pressure to the development of resistance as it exposes a large number of parasites to partially effective antimalarial drug concentrations. In this study the effects of two different systematic antimalarial treatment strategies are examined by using mefloquine as an example. This is a particularly relevant example, as resistance to mefloquine has developed rapidly on the eastern and western borders of Thailand and the adjacent areas and is now emerging separately in Vietnam. This could have been delayed or perhaps prevented. When new drugs are introduced, dose-ranging studies are performed to determine the optimum dose and treatment schedule on the basis of the therapeutic ratio. For most anti-infective drugs, with the notable exception of antituberculous and antiretroviral drugs, the prevention of resistance is usually not considered in this assessment. This conventional therapeutic appraisal usually leads to the conclusion that the smallest dose that gives an “acceptable” cure rate should be deployed initially. For slowly eliminated antimalarial drugs, such as mefloquine, this will lead more rapidly to resistance than if a higher dose were deployed de novo. There are two reasons for this. First, the lower dose chosen initially, which for mefloquine was 15 mg of base/kg, provides a greater opportunity for the de novo selection of genetic mutants, such as those containing increased numbers of copies of the pfmdr 1 gene, with significantly reduced susceptibility (10). This is because there is a greater probability of failing to achieve concentrations which would kill a mutant parasite and its progeny. Second, once these mutants have arisen and have been transmitted, provided they are highly mefloquine resistant (see below), they will be more likely to survive low-dose treatment in subsequent hosts. This increased survival probability results in an increase in the proportion of resistant mutant parasites. Thus, resistance is selected more efficiently by the general use of a lower dose (15 mg/kg) than a higher dose (25 mg/kg). It should be noted that we simulated the situation in an area of low transmission where background immunity is low or absent (such as much of Southeast Asia and South America). In areas of high stable transmission, host immunity may be sufficient to clear infections with resistant parasites. In addition, a significant proportion of infections are transmitted from individuals who do not receive antimalarials. These two factors reduce the selection of resistant mutants and retard the evolution of drug resistance.
In the pharmacokinetic-pharmacodynamic models presented here, we have assumed dose linearity for mefloquine, but recent studies indicate that acute malaria reduces oral mefloquine bioavailability (11). If the higher dose of mefloquine is split (15 mg/kg and then 10 mg/kg), the second part of the dose is associated with a disproportionate increase in the blood drug level and a 50% increase in the area under the concentration-time curve. Thus, the 66% higher dose has greater bioavailability and would be even less likely to select for resistance.
The relationship between EC90 (in vivo) and EC90 (in vitro) for mefloquine is unknown. The in vivo concentration-effect curve is shifted to the right of the in vitro concentration-effect curve because of binding to proteins and other factors. Plasma or whole blood drug levels measured in vivo include free (unbound) drug and protein-bound drug. Only the drug that is not bound in plasma is capable of crossing membranes and killing the malaria parasites. The correlation between in vitro and in vivo susceptibility is often poor. In vitro attempts to assess mefloquine plasma protein binding are also confounded by its tendency to stick to plastics and other laboratory ware. The level of protein binding is generally considered to be very high, approximately 98% (4). Concentrations in plasma are slightly lower than whole-blood mefloquine concentrations; the mean (95% confidence interval) ratio of the concentration in whole blood to the concentration in plasma for this population was 1.15 (1.03 to 1.29) (13). The EC90 (in vitro) was derived from modeling of in vitro concentration-effect curves in which the effect measure is inhibition of parasite uptake of [3H]hypoxanthine. This inhibition of purine uptake is a measure that correlates with growth inhibition of multiplication, but it does not equate with it.
Mefloquine resistance that leads to treatment failure results in the preferential transmission of mefloquine-resistant malaria parasites. This accelerates the spread of resistant strains and may increase the incidence of malaria. In the case of mefloquine, this could have been delayed by deploying a higher dose initially, although this would have had significant cost implications. The benefits derived from deployment of a higher initial dose of mefloquine cannot necessarily be extrapolated to other antimalarial drugs. If resistance arises through single mutations which give very large decreases in susceptibility (e.g., greater than fivefold), then these mutants would require an equivalent increase in dose to ensure adequate cure rates. Atovaquone is an example in which the initial dose may not be important in the selection of resistance. Resistance is associated with mutants which are up to 10,000 times less susceptible. An increase in the drug dose will have no impact on these parasites. However, when resistance increases in small increments, as for the arylaminoalcohol antimalarials, and also the initial dihydrotolate reductase mutations that confer pyrimethamine resistance, then the principles derived here should apply. Recent studies in Africa indicate frequent underdosing with pyrimethamine-sulfadoxine in children (F. ter Kuile, personal communication). This, together with underdosing through self-medication, acts as an important pressure driving drug resistance.
The level of antimalarial drug resistance is commonly underestimated. When in vivo drug assessments are performed, patients are usually monitored for between 1 and 4 weeks. This is insufficient for mefloquine. The models presented here explain that recrudescences may occur well after 1 month following treatment. Furthermore, early in the evolution of resistance, when there are few recrudescences, a greater proportion of recrudescences occurs after 28 days. Thus, the degree to which mefloquine resistance is underestimated (number of treatment failures in ≥28 days divided by total failure rate) is greater at low levels of drug resistance. These models provide estimates of these values.
Cost is a very important factor in the determination of antimalarial drug use. If an antimalarial drug treatment costs 60% more (as would be the case for the high versus the low dose of mefloquine), this could impose a significant financial burden on developing countries. However, this must be balanced by the costs of resistance in terms of both morbidity and perhaps mortality and also the need to fund newer and usually more expensive alternative drugs. The data and modeling predictions presented here provide a framework for such a pharmacoeconomic assessment. There is increasing acceptance that existing antimalarial drugs should be combined with an artemisinin derivative as protection from the development of resistance (18). The extrapolations from the models presented in this paper still pertain to combination treatment, except that the numbers of parasites exposed to subtherapeutic drug concentrations in a patient population are reduced by many orders of magnitude. The differential benefit of the higher mefloquine dose is retained, however. For the optimum prevention of resistance, mefloquine should be deployed initially at a dose of 25 mg/kg, not a dose of 15 mg/kg, and should be combined with an artemisinin derivative.
ACKNOWLEDGMENTS
We thank Stephen Duffull for assistance in programming and helpful comments, Alan Brockman for providing the in vitro data from the Shoklo Malaria Research Unit, and the efforts of Prasit Sookto and Theera Wimonwattrawatee in providing the in vitro drug susceptibility data from the U.S. Armed Forces Research Institute of Medical Sciences. We thank the dean of the Faculty of Tropical Medicine, Sornchai Looarrsuwan for his support.
This study was part of the Wellcome-Mahidol University Oxford Tropical Medicine Research Programme, supported by the Wellcome Trust of Great Britain.
Appendix
To find Pt integrate dP/dt:
 |
Substitute
 |
Thus,
 |
 |
(since C is a function of time and a, k1, γ, and C50 are constants).
Using the separation-of-variables method to integrate
 |
 |
where
 |
 |
 |
REFERENCES
- 1.Day N P J, Diep P T, Ly P T, Sinh D X, Loc P P, Chuong L V, Chau T T H, Mai N T H, Bethell D B, Phu N H, Hien T T, White N J. Clearance kinetics of parasites and pigment-containing leukocytes in severe malaria. Blood. 1996;88:4694–4700. [PubMed] [Google Scholar]
- 2.Desjardins R E, Canfield C J, Haynes J D, Chulay J D. Quantitative assessment of antimalarial activity in vitro by a semiautomated microdilution technique. Antimicrob Agents Chemother. 1979;16:710–718. doi: 10.1128/aac.16.6.710. [DOI] [PMC free article] [PubMed] [Google Scholar]
- 3.Hoshen M B, Stein W D, Ginsburg H. Modelling the chloroquine chemotherapy of falciparum malaria: the value of spacing a split dose. Parasitology. 1998;116:407–416. doi: 10.1017/s0031182098002480. [DOI] [PubMed] [Google Scholar]
- 4.Karbwang J, White N J. Clinical pharmacokinetics of mefloquine. Clin Pharmacokinet. 1990;19:264–279. doi: 10.2165/00003088-199019040-00002. [DOI] [PubMed] [Google Scholar]
- 5.Kitchen S F. The infection in the intermediate host: symptomatology, falciparum malaria. In: Moulton F R, editor. A symposium on human malaria. Washington, D.C.: American Association for the Advancement of Science; 1941. pp. 196–207. [Google Scholar]
- 6.Kitchen S F. Falciparum malaria. In: Boyd M F, editor. Malariology. Philadelphia, Pa: The W. B. Saunders Co.; 1949. pp. 966–1045. [Google Scholar]
- 7.Lindstrom M J, Bates D M. Nonlinear mixed effects models for repeated measures data. Biometrics. 1990;46:673–687. [PubMed] [Google Scholar]
- 8.Lipsitch M, Levin B R. The population dynamics of antimicrobial chemotherapy. Antimicrob Agents Chemother. 1997;41:363–373. doi: 10.1128/aac.41.2.363. [DOI] [PMC free article] [PubMed] [Google Scholar]
- 9.Nosten F, ter Kuile F, Chongsuphajaisiddhi T, Luxemburger C, Webster H K, Edstein M, Phaipun L, Thew K L, White N J. Mefloquine-resistant falciparum malaria on the Thai-Burmese border. Lancet. 1991;337:1140–1143. doi: 10.1016/0140-6736(91)92798-7. [DOI] [PubMed] [Google Scholar]
- 10.Price R N, Cassar C, Brockman A, Duraisingh M, van Vught M, White N J, Nosten F, Krishna S. The pfmdr1 gene is associated with a multidrug-resistant phenotype in Plasmodium falciparum from the western border of Thailand. Antimicrob Agents Chemother. 1999;43:2943–2949. doi: 10.1128/aac.43.12.2943. [DOI] [PMC free article] [PubMed] [Google Scholar]
- 11.Simpson J A, Price R N, ter Kuile F, Teja-Isavatharm P, Nosten F, Aarons L, Chongsuphajaisiddhi T, Looareesuwan S, White N J. Population pharmacokinetics of mefloquine in patients with acute falciparum malaria. Clin Pharmacol Ther. 1999;66:472–484. doi: 10.1016/S0009-9236(99)70010-X. [DOI] [PubMed] [Google Scholar]
- 12.ter Kuile F O, Nosten F, Thieren M, Luxemburger C, Edstein M D, Chonsuphajaisiddhi T, Phaipun L, Webster H K, White N J. High dose mefloquine in the treatment of multidrug resistant falciparum malaria. J Infect Dis. 1992;166:1393–1400. doi: 10.1093/infdis/166.6.1393. [DOI] [PubMed] [Google Scholar]
- 13.ter Kuile F O, Teja-Isavatharm P, Edstein M D, Keeratithakul D, Dolan G, Nosten F, Phaipun L, Webster H K, White N J. Comparison of capillary whole blood, venous whole blood, and plasma concentrations of mefloquine, halofantrine, and desbutyl-halofantrine measured by high-performance liquid chromatography. Am J Trop Med Hyg. 1994;51:778–784. doi: 10.4269/ajtmh.1994.51.778. [DOI] [PubMed] [Google Scholar]
- 14.Watkins W M, Mosobo M. Treatment of Plasmodium falciparum malaria with pyrimethamine-sulfadoxine: selective pressure for resistance is a function of long elimination half life. Trans R Soc Trop Med Hyg. 1993;87:75–78. doi: 10.1016/0035-9203(93)90431-o. [DOI] [PubMed] [Google Scholar]
- 15.Webster H K, Boudreau E F, Pavanand K, Yongvanitchit K, Pang L W. Antimalarial drug susceptibility testing of Plasmodium falciparum in Thailand using a microdilution radioisotope method. Am J Trop Med Hyg. 1985;34:228–235. doi: 10.4269/ajtmh.1985.34.228. [DOI] [PubMed] [Google Scholar]
- 16.White N J. Antimalarial pharmacokinetics and treatment regimens. Br J Clin Pharmacol. 1992;34:1–10. doi: 10.1111/j.1365-2125.1992.tb04100.x. [DOI] [PMC free article] [PubMed] [Google Scholar]
- 17.White N J. Assessment of the pharmacodynamic properties of antimalarial drugs in vivo. Antimicrob Agents Chemother. 1997;41:1413–1422. doi: 10.1128/aac.41.7.1413. [DOI] [PMC free article] [PubMed] [Google Scholar]
- 18.White N J. Antimalarial drug resistance and combination chemotherapy. Philos Trans R Soc London B. 1999;354:739–749. doi: 10.1098/rstb.1999.0426. [DOI] [PMC free article] [PubMed] [Google Scholar]


