Abstract
Objective
Diabetic hepatocellular carcinoma (HCC) patients have high mortality and metastasis rates. Diabetic conditions promote neutrophil extracellular traps (NETs) generation, which mediates HCC metastasis and invasion. However, whether and how diabetes‐induced NETs trigger HCC invasion is largely unknown. Here, we aimed to observe the effects of diabetes‐induced NETs on HCC invasion and investigate mechanisms relevant to a DNA sensor cyclic GMP‐AMP synthase (cGAS).
Methods
Serum from diabetic patients and healthy individuals was collected. Human neutrophil‐derived NETs were isolated for stimulating HCC cell invasion. Data from the SEER and TCGA databases were used for bioinformatics analysis. In HCC cells and allograft models, NETs‐triggered invasion was observed.
Results
Diabetic HCC patients had poorer survival than non‐diabetic ones. Either diabetic serum or extracted NETs caused HCC invasion. Induction of diabetes or NETosis elicited HCC allograft invasion in nude mice. HCC cell invasion was attenuated by the treatment with DNase1. In TCGA_LIHC, an extracellular DNase DNASE1L3 was downregulated in tumor tissues, while function terms (the endocytic vesicle membrane, the NF‐κB pathway and extracellular matrix disassembly) were enriched. DNASE1L3 knockdown in LO2 hepatocytes or H22 cell‐derived allografts facilitated HCC invasion in NETotic or diabetic nude mice. Moreover, exposure of HCC cells to NETs upregulated cGAS and the non‐canonical NF‐κB pathway and induced expression of metastasis genes (MMP9 and SPP1). Both cGAS inhibitor and NF‐κB RELB knockdown diminished HCC invasion caused by NETs DNA. Also, cGAS inhibitor was able to retard translocation of NF‐κB RELB.
Conclusion
Defective DNASE1L3 aggravates NETs DNA‐triggered HCC invasion on diabetic conditions via cGAS and the non‐canonical NF‐κB pathway.
Keywords: cyclic GMP‐AMP synthase, diabetes, hepatocellular carcinoma, metastasis, neutrophil extracellular traps, non‐canonical NF‐κB pathway
In this study, we found that diabetes‐induced NETs release was significant for hepatocellular carcinoma invasion. Non‐canonical NF‐κB pathway‐mediated MMP9 and SPP1 expression was involved in this process. DNA sensor cyclic GMP‐AMP synthase was a key mediator for activating the above pathway.

Introduction
Primary liver cancer is an increasing global health challenge with higher mortality and limited treatment options. Hepatocellular carcinoma (HCC) is the most common type of primary liver cancer and accounts for ~90% of cases. 1 Intrahepatic invasion and distant metastases are the major cause of HCC‐related deaths. 2 Recent studies have demonstrated that neutrophils were able to promote HCC metastasis through forming neutrophil extracellular traps (NETs) during the process of NETosis. 3 , 4 However, detailed molecular mechanisms underlying NETs‐induced metastasis of HCC cells remain largely unknown.
Neutrophils usually undergo NETosis under multiple pathological conditions, such as pathogen infections, 5 and pathophysiological states including diabetes mellitus (DM) 6 , 7 , 8 , 9 and surgical stress. 4 A growing body of evidence supports the notion that diabetic HCC patients had significantly higher rates of postoperative recurrence, metastasis and mortality than those non‐diabetic HCC ones. 10 , 11 , 12 , 13 , 14 , 15 , 16 , 17 Nevertheless, it is not clear whether diabetes‐related HCC invasion or metastasis is affected by excessive NETs. As known, the secreted NETs consist of multiple components, such as granule proteins, like neutrophil elastase (NE) and myeloperoxidase (MPO), as well as chromatin double‐stranded DNA (dsDNA). It was demonstrated that these extracellular NETs were able to trap tumor cells in the lungs and liver to fuel their distant metastasis 18 , 19 and that such effects partially depended on dsDNA. 3 However, whether dsDNA in extracellular NETs is responsible for diabetes‐related HCC invasion or metastasis is rarely reported. Normally, there is only a trace amount of free dsDNA in the body and it is precisely maintained at a relatively stable level by DNases in/out the cells. A recent analysis of the TCGA and GEO databases surprisingly showed that expression of DNASE1L3, an extracellular DNase, is very low in HCC tissues, 20 which may create a NETs DNA‐rich microenvironment, thereby promoting invasion and/or metastasis.
In the cytosol, DNA can be sensed by pattern recognition receptors, among which cyclic GMP‐AMP synthase (cGAS) is a key member. Once binding dsDNA, cGAS will be activated and synthesise the second messenger cyclic guanosine monophosphate‐adenosine monophosphate (cGAMP). 21 Activation of cGAS can initiate two distinctive effects: anti‐inflammation/anti‐cancer effect depending on stimulator of interferon genes (STING) and interferon, 22 as well as pro‐metastasis effect associated with the non‐canonical NF‐κB pathway. 23 Hence, it is still necessary to elucidate whether and how cGAS is involved in NETs DNA‐induced HCC invasion on diabetic conditions.
In the present study, we observed the effects of diabetes‐induced NETosis on HCC invasion. With bioinformatics analysis and molecular biology assays, we investigated the mechanisms underlying NETs DNA‐induced HCC invasion.
Results
Diabetic conditions foster HCC cell invasion
Survival statistics of SEER*Stat showed that the survival rate of diabetic HCC patients was decreased when compared with that of non‐diabetic HCC patients (Figure 1a). Since metastasis is a prominent cause of death in HCC patients, we speculated that diabetic conditions probably induced HCC cell metastasis or local invasion. In the transwell assay, it was found that treatment of HCC SMMC7721 cells with diabetic serum dramatically promoted invasion (P < 0.01), while remarkable invasion was not observed in the cells treated with healthy serum (Figure 1b). In addition, the effect of diabetic serum on invasion of LO2 hepatocytes was weaker than that on HCC SMMC7721 cells (Figure 1c). Moreover, we established a diabetic nude mouse model, which was verified by high blood glucose levels (14.8 ± 4.2 vs. 7.6 ± 0.6 mm, P < 0.01, Figure 1d). In the two groups of nude mice, mouse HCC H22 cells were engrafted. After a 14‐day growth of the allografts, the mice were sacrificed, and then the body and the allografts were weighed. As shown in Figure 1e, the body weight of diabetic nude mice was significantly elevated (P < 0.01). Importantly, the weight of HCC allografts in diabetic nude mice was also increased as compared with that in control nude mice (P < 0.05, Figure 1f and g). These data suggest that diabetic conditions can enhance HCC cell invasion.
Figure 1.
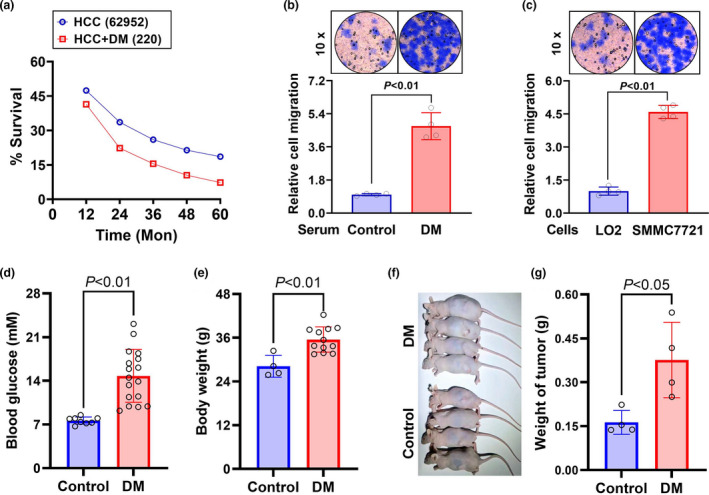
Effects of diabetes on HCC cell invasion. (a) Analysis of survival rate of 62 952 HCC patients and 220 diabetic HCC patients diagnosed from 2008 to 2017 in the SEER*Stat 8.3 program. (b, c) HCC SMMC7721 cells were treated with the serum from diabetic patients or healthy individuals (b) and, HCC SMMC7721 cells or LO2 hepatocytes were treated with the diabetic serum (c) for 48 h. The cell invasion was observed with the transwell assay. A diabetic model of nude mice was established through a high‐fat and carbohydrate diet combined with an intraperitoneal streptozotocin injection. (d) Blood glucose of the diabetic (n = 17) and control (n = 8) mice was tested. (e) Body weight of the diabetic (n = 12) and control (n = 4) mice was measured. (f, g) Four allografts in either group were observed and weighed. Data are shown as mean ± SD.
DNA mediates NETs‐induced HCC cell invasion
Given that diabetic conditions can increase NETs content, it was expected that the aforementioned enhancement of HCC invasion may be attributed to NETs generation. A cellular model of NETosis was established by treating human peripheral blood neutrophils with PMA. As shown in Figure 2, the treatment with 20 nm PMA for 2 h released a massive amount of net‐like structure from the neutrophils, which was verified to be DNA by staining with Hoechst (Figure 2a) and PicoGreen (Figure 2b). The release of NETs from neutrophils is shown in the schematic diagram (Figure 2c). Granule proteins (MPO, MMP9 and NE) in the NETs were found to be raised in the supernatant from PMA‐treated cells (Figure 2d and e), indicating that the extracted nets possessed some key features of endogenous NETs. With these extracted NETs, HCC SMMC7721 cells or LO2 hepatocytes were treated. As shown in Figure 2f, the intermediate level of NETs significantly boosted the invasion of SMMC7721 cells (P < 0.01), while higher concentrations of NETs appeared to suppress invasion. Similar to the effects of diabetic serum (Figure 1c), the NETs showed stronger effects on SMMC7721 cells (P < 0.01) than on LO2 hepatocytes (Figure 2g). Furthermore, to understand whether the invasion induced by NETs or diabetic serum was DNA‐dependent, DNase1 was applied for scavenging extracellular DNA. As presented in Figure 2h and i, the application of 1.5 U DNase1 significantly attenuated the cell invasion caused by NETs or diabetic serum. The results suggest that extracellular DNA is involved in diabetes‐ or NETs‐induced HCC cell invasion.
Figure 2.
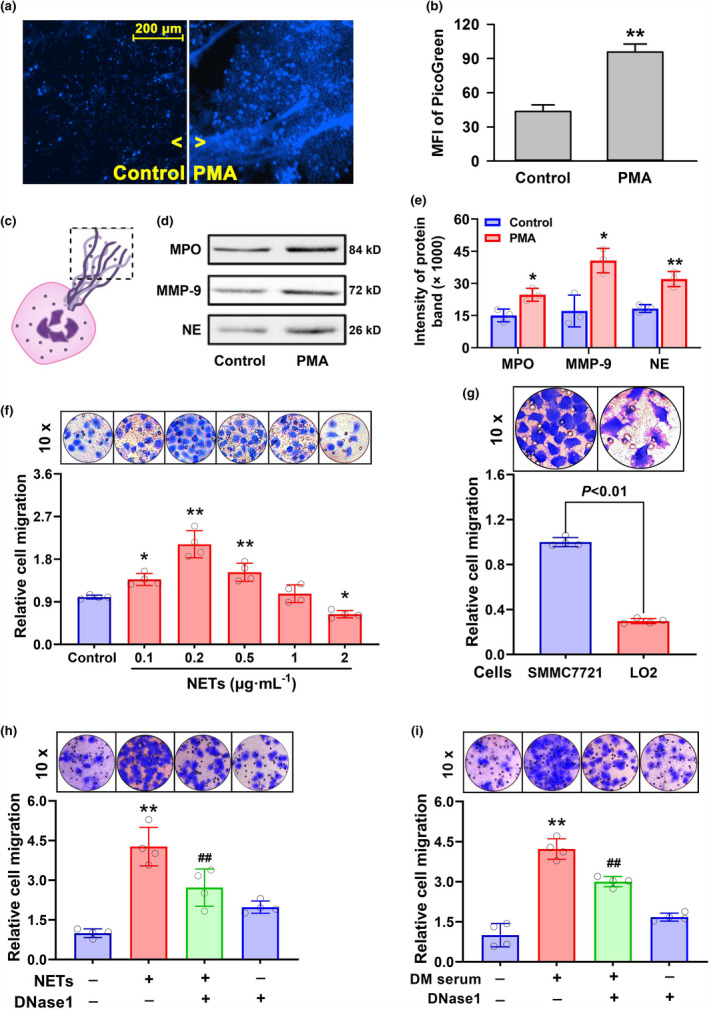
Roles of extracellular DNA in NETs‐induced HCC cell invasion. (a–e) Neutrophils isolated from human peripheral blood were treated with 20 nm PMA for 2 h. DNA was labelled using Hoechst 33324 staining followed by fluorescence photography (a). Extracellular DNA was collected and quantified with a fluorescence microplate reader following PicoGreen staining (b). A schematic diagram showing NETs release from neutrophils (c). Granule proteins (MPO, MMP9 and NE) in the nets from PMA‐treated or control cell supernatant were measured by Western blot assay after total proteins were quantified with a BCA kit (d), and the band intensity was quantified with the ImageJ software (e). (f–i) HCC SMMC7721 cells were stimulated with increasing concentrations of NETs (f). SMMC7721 cells or LO2 hepatocytes were treated with 0.2 μg mL−1 NETs (g). SMMC7721 cells were treated with 0.2 μg mL−1 NETs (h) or diabetic serum (i) in the absence or presence of 1.5 U DNase1. The cell invasion was observed with the transwell assay (mean ± SD, n = 4). *P < 0.05, **P < 0.01 vs. Control group. ## P < 0.01 vs. DNase1‐free group.
Deficient DNASE1L3 facilitates NETs DNA‐induced HCC cell invasion
To understand why HCC SMMC7721 cells were sensitive to NETs DNA or diabetic serum, we firstly investigated gene expression of various DNA‐degrading enzymes in the TCGA_LIHC cohort. Among intracellular DNA‐degrading enzymes (DNASE1L1, DNASE2, DNASE2B, DFFA, DFFB, TATDN1, TATDN2, TATDN3, TREX1 and FEN1), remarkable changes in gene expression were not observed (Figure 3a). Among extracellular DNA‐degrading enzymes, the expression of ENDOD1, DNASE1 and DNASE1L2 was also not markedly different between HCC and normal tissues (Figure 3b–d). Additionally, the survival could not be predicted or stratified by the expression of these enzymes (Figure 3e–g).
Figure 3.
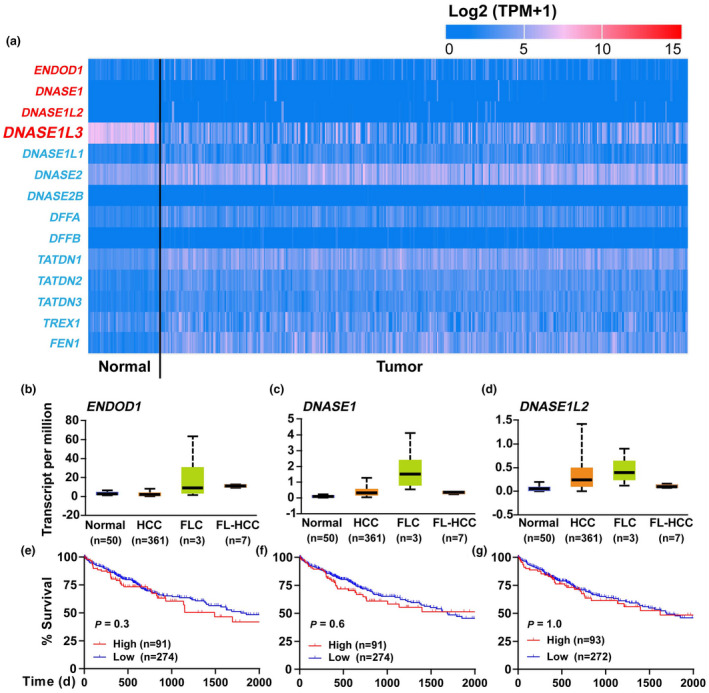
Expression of DNA‐degrading enzymes in HCC tissues. (a) Gene expression of extracellular (red) and intracellular (blue) DNA‐degrading enzymes between HCC and adjacent normal tissues is displayed in the heat plot. (b–d) RNA levels of three extracellular DNA‐degrading enzymes (ENDOD1, DNASE1 and DNASE1L2) in the TCGA_LIHC cohort. (e–g) Effects of the three enzymes on survival of HCC patients.
In various TCGA cancers, the expression of DNASE1L3 was downregulated in tumor tissues (Figure 4a and b). From the TCGA_LIHC cohort, it could be seen that the 5‐year survival of HCC patients with low DNASE1L3 was dramatically poor (P < 0.0001, Figure 4c). The ROC curve of DNASE1L3 showed that the AUC score was 95%, indicating good performance in distinguishing HCC from normal tissues (Figure 4d). The examination of protein levels showed that DNase1l3 was also downregulated in HCC SMMC7721 cells as compared with LO2 hepatocytes (Figure 4e). Additionally, such downregulation was observed in SMMC7721 cell supernatant (Supplementary figure 1). Importantly, after knocking down DNASE1L3 in LO2 hepatocytes (Figure 4f), NETs DNA‐induced invasion was significantly enhanced (P < 0.01, Figure 4g). The results indicate that deficient DNASE1L3 in HCC tissues can exacerbate tumor invasion by reducing extracellular DNA degradation.
Figure 4.
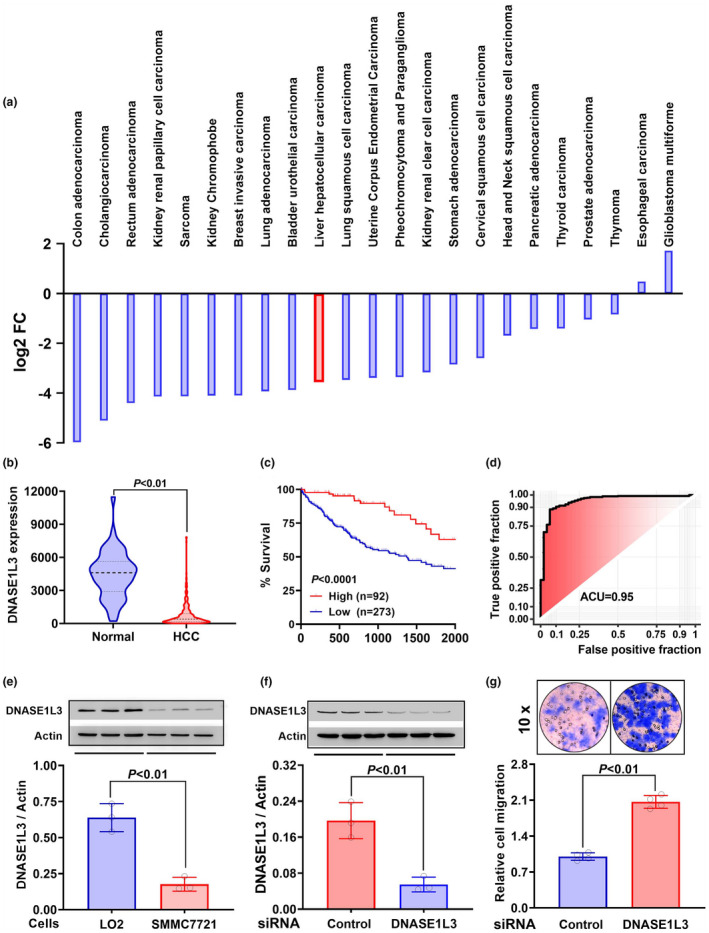
Roles of DNA‐degrading enzyme DNASE1L3 in HCC cell invasion. (a) Expression of DNASE1L3 in various TCGA cancers. Data are shown as log2 (tumor median/normal median). (b) Expression of DNASE1L3 in HCC (n = 371) and adjacent normal tissues (n = 50) in the TCGA_LIHC cohort. Data are shown as median ± quartile in the violin plot. (c) Survival analysis of HCC patients between high and low DNASE1L3 expression groups. (d) Receiver operating characteristic (ROC) curve showing false‐positive fraction and true‐positive fraction of DNASE1L3 expression in the TCGA_LIHC cohort. The AUC is reported. (e) Expression of DNASE1L3 in LO2 hepatocytes and HCC SMMC7721 cells was measured by Western blot assay (n = 3). (f) RNA interference was applied to knock down the expression of DNASE1L3 in LO2 hepatocytes (n = 3). (g) Observation of NETs DNA‐induced invasion between DNASE1L3 knockdown and LO2 hepatocytes (n = 4). Data are shown as mean ± SD ( e–g ).
In the nude mice, induction of NETosis with LPS was able to significantly promote the development of mouse HCC H22 cell‐derived allografts (P < 0.01). The knockdown of DNASE1L3 in H22 cells (Supplementary figure 2) was able to facilitate the effects of NETosis (P < 0.01) (Figure 5a–c). In the diabetic nude mice, the levels of NETs DNA were increased (P < 0.01) (Figure 5d). Similarly, the knockdown of DNASE1L3 in H22 cells promoted the invasive growth of the allografts (Figure 5e and f).
Figure 5.
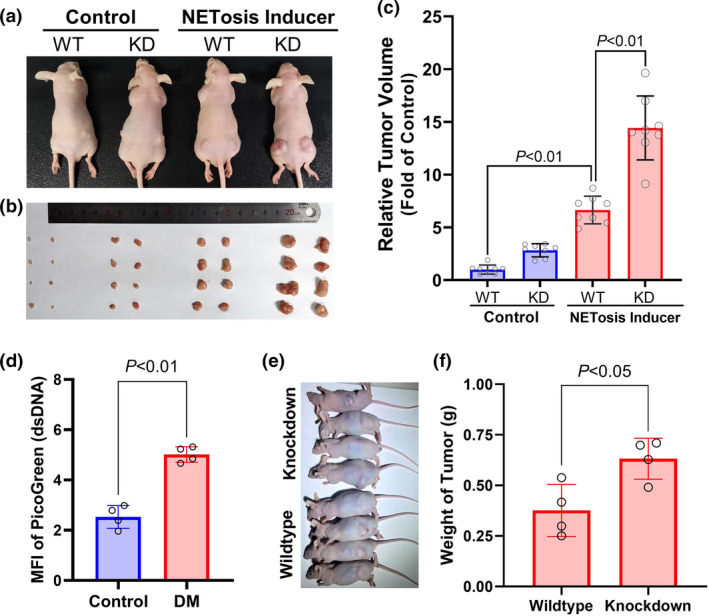
Downregulation of DNASE1L3 promoted invasive growth of allografts in diabetic nude mice. (a–c) Nude mice were injected intraperitoneally with 1 mg kg−1 lipopolysaccharide to induce NETosis. DNASE1L3 knockdown (KD) and wild‐type (WT) H22 cells were engrafted subcutaneously. Invasive growth of the allografts was monitored for 3 weeks. Before the mice were sacrificed, animal pictures were taken (a). Two allografts (b) were taken out from the nude mice in four groups and measured (c) (mean ± SD, n = 8). (d) Four of diabetic (DM) or control nude mice were sacrificed, and their serum was isolated for measuring NETs DNA. (e) DNASE1L3 knockdown and wildtype H22 cells were subcutaneously engrafted in the diabetic nude mice and underwent a 3‐week growth. The pictures of animals with allografts were taken. (f) Four mice in either group were sacrificed, and the allografts were isolated for weighing. Data are shown as mean ± SD.
Bioinformatics analysis of differentially expressed genes and functional enrichment in tumor tissues of HCC patients
To dissect the possible mechanism underlying NETs DNA‐induced HCC invasion, the TCGA_LIHC cohort was downloaded and analysed for differential gene expression. As shown in Figure 6a, under a criteria of P < 0.001 and fold of change (FC) > 1.8 (i.e. log2FC > 0.85), 2270 upregulated genes were identified. Under a criteria of P < 0.001 and log2FC < −0.85, 917 downregulated genes were found. The roles of upregulated genes in HCC development were investigated through screening enriched terms, which were shown in the bubble plot (Figure 6b). These terms (endocytic vesicle membrane, NF‐κB signal pathway and extracellular matrix disassembly) were enriched in HCC tissues, indicating that deficient DNASE1L3 is likely to reduce extracellular DNA degradation. Once the accumulated DNA is endocytosed by HCC cells, the NF‐κB signal will be activated and extracellular matrix will decompose, thereby boosting tumor invasion.
Figure 6.
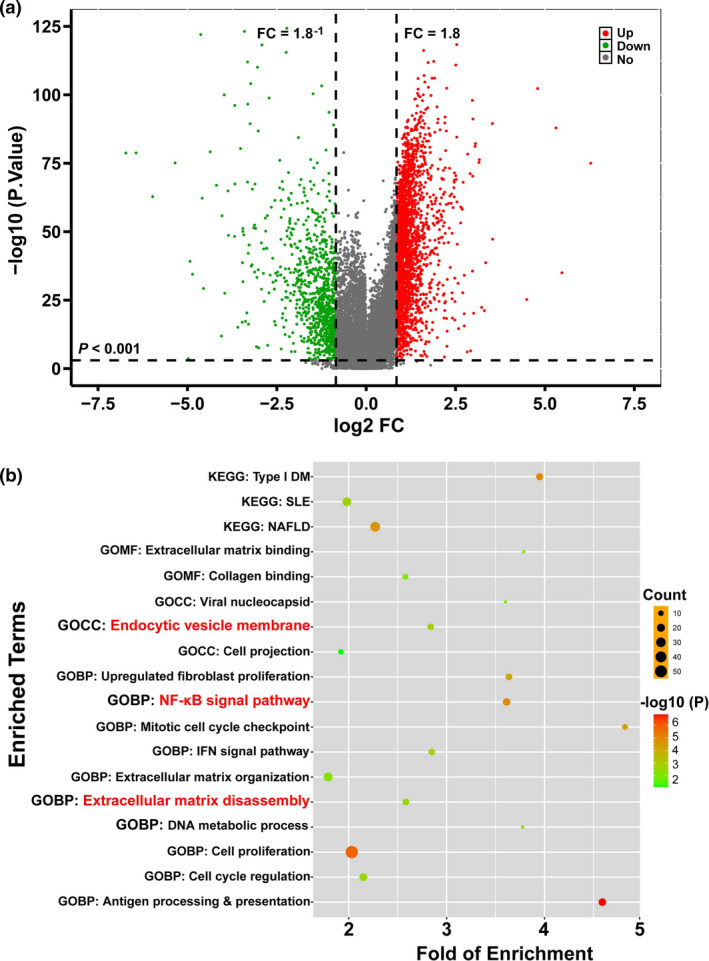
Investigation of linkage between DNASE1L3 and HCC cell invasion. The TCGA_LIHC dataset was downloaded using the TCGAbiolinks R package and analysed for differential gene expression with the limma R package. (a) A volcano plot was built using the ggplot2 R package. Dots in the upper right quadrant stand for upregulated genes and the ones in the upper left quadrant stand for downregulated genes. (b) Functional enrichment analysis was conducted by drawing a bubble plot with the ggplot2 R package. KEGG, signalling pathway analysis; GO, gene ontology analysis; BP, biological process; CC, cellular component; MF, molecular function.
Non‐canonical NF‐κB pathway‐induced MMP9 and SPP1 expression is responsible for NETs DNA‐mediated HCC invasion
To verify the roles of the NF‐κB pathway in HCC invasion, the analysis of differentially expressed genes was performed. Firstly, the genes coding the NF‐κB pathway subunits (NFKB2 and RELB) were found to be upregulated (Figure 7a and c). Additional survival analysis showed that the HCC patients with higher levels of NFKB2 or RELB had poorer survival status (Figure 7b and d). Furthermore, the in vitro experiments manifested that the exposure of HCC SMMC7721 cells to NETs DNA significantly enhanced the nuclear translocation of RelB proteins (Figure 7e and f). After knocking down the RELB gene (Figure 7g), NETs DNA‐induced cell invasion was remarkably attenuated (P < 0.01) (Figure 7h). The results support the notion that the upregulation of the non‐canonical NF‐κB pathway is detrimental to HCC patients’ survival and metastasis may be a potential cause.
Figure 7.
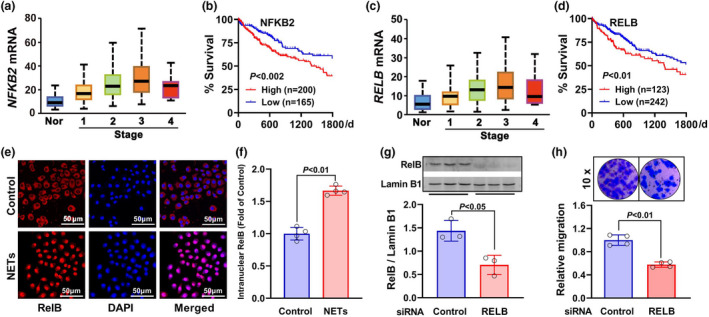
Roles of the non‐canonical NF‐κB pathway in HCC cell invasion. (a–d) Gene expression of NF‐κB pathway subunits NFKB2 (a) and RELB (c) in various HCC stages and adjacent normal tissues (Nor). Influence of these genes on the survival of HCC patients in the TCGA_LIHC cohort (b, d). (e, f) NETs DNA‐induced nuclear translocation of RelB in HCC SMMC7721 cells was observed with immunofluorescence imaging under a confocal microscope (n = 4). (g) RNA interference was applied to knock down RELB expression in SMMC7721 cells (n = 3). (h) NETs DNA‐induced invasion was observed between RELB‐downregulated and control SMMC7721 cells (n = 4). Data are shown as mean ± SD.
Next, we looked into how the non‐canonical NF‐κB pathway facilitated HCC invasion. Further analysis of the relationship between the non‐canonical NF‐κB pathway and extracellular matrix disassembly suggested that NFKB2 and RELB interacted with the extracellular matrix disassembly members. In the interaction network, MMP9 was a bottleneck hub gene (Figure 8a). Moreover, during various stages of HCC, the expression of MMP9 was upregulated and the patients with higher MMP9 expression had a relatively lower survival rate (P < 0.0001) (Figure 8b and c). In the network, SPP1 was found to be closely related to MMP9 (Figure 8a). Moreover, its expression and effects on survival were similar to MMP9 (Figure 8d and e). Importantly, the treatment with NETs DNA significantly raised MMP9 (Figure 8f) and SPP1 (Figure 8g) protein expression in HCC SMMC7721 cells. Further in vivo study showed that the allografts in NETotic mice had higher MMP9 and SPP1 expression than that in control nude mice. Notably, these effects of NETosis were fostered by the knockdown of DNASE1L3 (Figure 8h).
Figure 8.
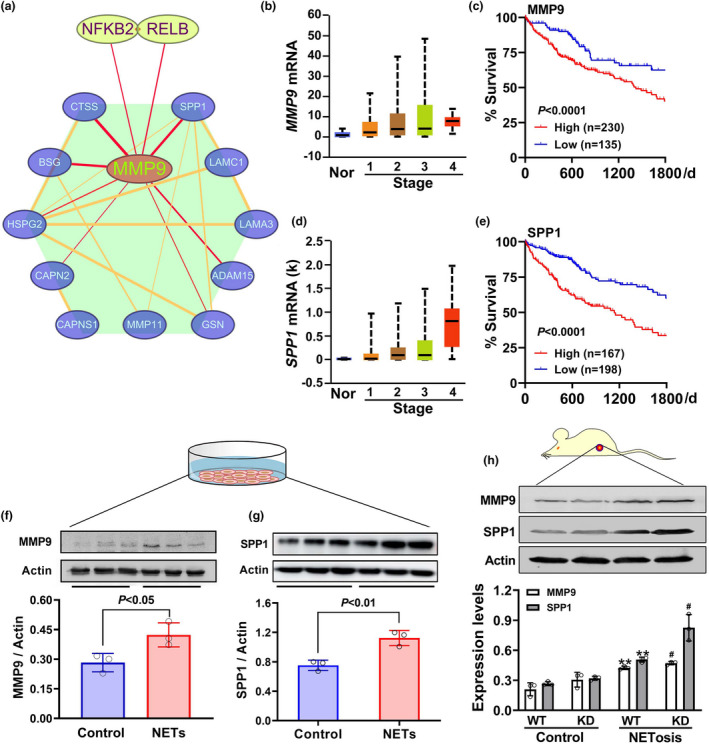
Roles of MMP9 and SPP1 in non‐canonical NF‐κB‐mediated HCC invasion. (a) The PPI network was constructed to reveal the target genes of the non‐canonical NF‐κB pathway using the STRING online tool. (b–e) In the TCGA_LIHC cohort, gene expression of MMP9 (b) and SPP1 (d) in various HCC stages was quantified, and their influence on survival was analysed (c, e). (f, g) After treatment of HCC SMMC7721 cells with 0.25 μg mL−1 NETs DNA for 48 h, intracellular MMP9 and SPP1 were tested by Western blot assay (n = 3). (h) In the NETotic and control nude mice, DNASE1L3 knockdown (KD) and wild‐type (WT) H22 cells were subcutaneously engrafted, respectively. Three weeks later, the expression of MMP9 and SPP1 was measured by Western blot assay (n = 3). Data are shown as mean ± SD. **P < 0.01 vs. WT in control group. # P < 0.05 vs. WT in NETotic group.
cGAS as a DNA sensor mediates NETs DNA‐induced HCC invasion
To uncover how NETs DNA activated the non‐canonical NF‐κB pathway and promoted MMP9 and SPP1 expression, intracellular DNA sensor cGAS was investigated. The analysis of the TCGA_LIHC cohort indicated that HCC patients with higher cGAS levels had a poorer survival outcome (P < 0.004) (Figure 9a). The treatment of HCC SMMC7721 cells with NETs DNA elevated intracellular cGAMP content in a time‐dependent manner (Figure 9b). In addition, this treatment caused the perinuclear translocation of STING protein (Figure 9c). Importantly, the inhibition of cGAS with 20 μg mL−1 RU521, a cGAS inhibitor, was able to suppress NETs DNA‐induced activation of the non‐canonical NF‐κB pathway, characterised by the reduced RelB nuclear translocation (Figure 9d), as well as HCC cell invasion (Figure 9e). Notably, in the diabetic nude mice, the administration of cGAS inhibitor could also prevent the allografts from invading (Figure 9f and g). These findings suggest that cGAS is a potential mediator in NETs DNA‐induced HCC invasion.
Figure 9.
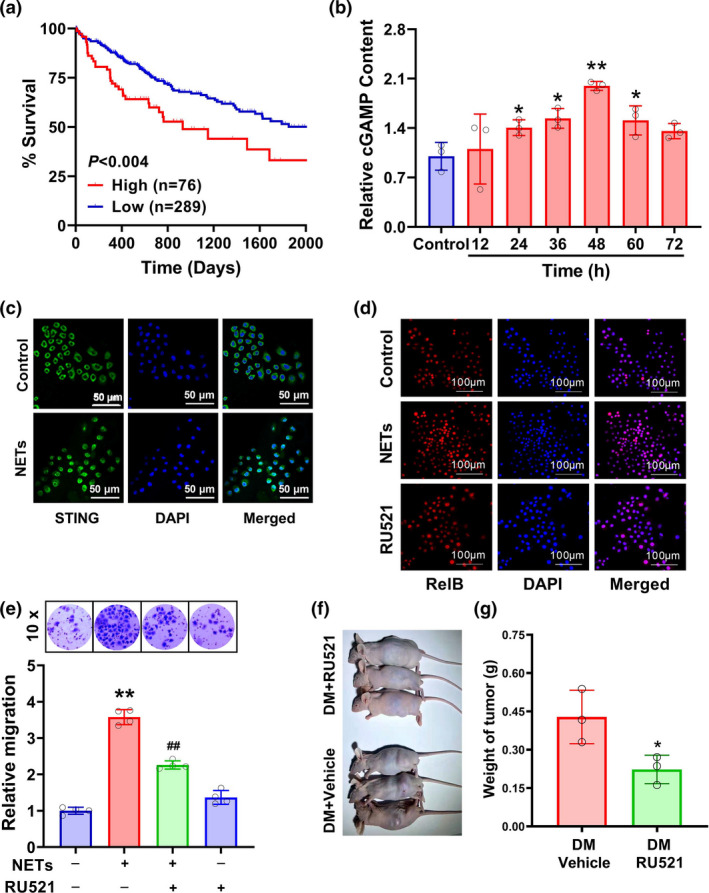
Roles of cGAS in NETs DNA‐triggered HCC invasion. (a) Effects of cGAS on the survival of HCC patients in the TCGA_LIHC cohort. (b) HCC SMMC7721 cells were treated with 0.25 μg mL−1 NETs DNA various times, and then, the content of intracellular cGAMP was measured with a commercial ELISA kit (n = 3). (c) SMMC7721 cells were stimulated with 0.25 μg mL−1 NETs DNA for 48 h, and the location of STING proteins was observed under a confocal microscope. After the exposure of SMMC7721 cells to 0.25 μg mL−1 NETs DNA with/without 20 μg mL−1 RU521 (a cGAS inhibitor), (d) RelB nuclear translocation and (e) cell invasion (n = 4) were observed. (f, g) The diabetic nude mice were administrated with RU521 or vehicle control. After a 3‐week growth, H22 cell allografts were captured (f) and weighed (g). Data are shown as mean ± SD. *P < 0.05, **P < 0.01 vs. Control group. ## P < 0.01 vs. NETs alone group.
Discussion
In the present study, we found that diabetes‐induced neutrophil NETosis boosted HCC invasion in a NETs DNA‐dependent manner. The deficient DNASE1L3 expression in tumor tissues is a key cause for the impairment of NETs DNA degradation. The resultant accumulation of NETs DNA primed HCC cells to invade by activating the cGAS‐ncNF‐κB signalling pathway.
In diabetic rodent models, the increased NETs DNA has been demonstrated to promote HCC development. 24 With the SEER*Stat database, the present study shows that diabetic HCC patients have poorer survival than non‐diabetic HCC patients. It is surmised that such poor survival is probably attributed to tumor cell metastasis and/or local invasion elicited by diabetic conditions. Using cellular and mouse experiment models, it was found that the invasive growth of HCC cells was indeed enhanced under diabetic conditions. Actually, these findings can be supported by a variety of original articles or data analyses. 10 , 12 , 13 , 14 , 15 , 25
The previous studies showed that diabetic conditions prime neutrophils to undergo NETosis, thereby releasing DNA‐containing NETs. 6 , 7 , 8 In this study, we found that scavenging DNA dramatically suppressed the pro‐invasive effects of diabetic serum. It is thus believed that the DNA ingredient is necessary for NETs‐induced HCC invasion. The treatment of HCC cells with the extracted NETs was also able to induce cell invasion. Therefore, DNA in NETs is necessary and significant during HCC invasion induced by diabetic conditions. A recent study from Song and colleagues also suggested that the high NETs DNA level was a risk for cancer metastasis including HCC. 18
Under normal circumstances, extracellular DNA can be degraded to keep balance in the body. However, presently, in HCC tissues one of the extracellular DNA‐degrading enzymes, DNASE1L3, was dramatically downregulated. Such downregulation is likely to attenuate DNA degradation, thereby creating a NETs DNA‐rich microenvironment. 20 Interestingly, the knockdown of DNASE1L3 was able to promote invasive growth of HCC allografts both in diabetic and NETotic nude mice. In the cellular experiment, this knockdown was also found to enhance the invasion. Therefore, the present evidence indicates that the effects of NETs DNA will be amplified, when endogenous DNA‐degrading enzymes, like DNASE1L3, are defective, for example, in some HCC tissues. Nevertheless, this study did not provide evidence to demonstrate whether diabetes could affect the expression of DNASE1L3, which should be focused on in future studies.
Using the TCGA_LIHC database, we investigated the mechanisms underlying NETs DNA‐triggered HCC cell invasion. The functional analysis of differentially expressed genes showed that DNA metabolism, endocytic vesicle membrane and extracellular matrix disassembly were enriched. Such enrichment indicates that DNA degradation is defective and that the accumulated DNA may be endocytosed by tumor cells, thereby disassembling the extracellular matrix. Additionally, the NF‐κB signal pathway was enriched in HCC tissues and the high expression of non‐canonical NF‐κB could predict poor survival. In the cell imaging assay, the RelB subunit was translocated to the nucleus after exposure to NETs DNA. Furthermore, the knockdown of RELB attenuated NETs DNA‐stimulated cell invasion. The findings provide evidence for the mediation of the non‐canonical NF‐κB pathway in NETs DNA‐induced HCC invasion. 23 , 26 , 27 Furthermore, the interaction network between the non‐canonical NF‐κB pathway and extracellular matrix disassembly term revealed that cancer migration genes (MMP9 and SPP1) were involved in NETs DNA‐induced invasive growth. 28 , 29
Last but not least, to figure out how NETs DNA promoted HCC invasion, DNA sensors, pattern recognition receptors (PRRs) 30 were investigated. As an important member of PRRs, cGAS is traditionally thought to suppress inflammation and cancer by activating dendritic cells. 31 , 32 , 33 However, in this study, the survival analysis indicated that HCC patients with higher cGAS had poorer survival. The treatment of HCC cells with NETs DNA raised cGAMP generation and STING protein translocation around the nuclei. Importantly, the inhibition of cGAS attenuated NETs DNA‐induced HCC invasion and allograft growth in the diabetic nude mice. These findings appear not to be consistent with those recent reports. 32 , 33 , 34 Actually, other researchers have also pointed out that chronic or sustained activation of cGAS in cancer cells, instead of dendritic cells, could induce inflammation and tumor metastasis. 23 , 27 , 35 It was reported that chronic induction of nuclear DNA leakage into the cytosol activated STING‐dependent cytokine production and tumorigenesis. The knockout of STING was almost completely resistant to 7,12‐dimethylbenz[a]anthracene (DMBA)‐induced skin carcinogenesis, 36 which supports the present findings. Therefore, we believe that diabetes‐induced NETs DNA could constantly activate cGAS and induce perinuclear translocation of STING in HCC cells, thereby promoting local invasion and/or metastasis. Therefore, in future immunotherapy of HCC patients, activating cGAS‐STING in dendritic cells should be carefully handled to avoid arousing tumor cells nearby. 37
In summary, diabetes‐induced NETs release is an important cause for HCC invasion. Such effects depend on non‐canonical NF‐κB pathway‐mediated MMP9 and SPP1 expression. The activation of DNA sensor cGAS induced by deficient DNASE1L3 is involved in the above process. This study provides a significant clue for the treatment of HCC metastasis in diabetic patients.
Methods
Human blood samples
Blood samples were drawn from four clinically diagnosed diabetic patients and four healthy individuals, who were enrolled from the 2nd Affiliated Hospital of Guangzhou Medical University. Serum was separated from the blood samples by centrifugation at 1800 g for 3 min. The experimental operation was approved by the Medical Ethics Committee of Guangzhou Medical University.
Isolation of neutrophils and purification of NETs
Neutrophils were isolated using Histopaque 11119 (Sigma‐Aldrich, St Louis, MO, USA) and Percoll® Plus Density Gradient Media, as described previously. 6 , 8 The isolated neutrophils were incubated with 25 nm phorbol‐12‐myristate‐13‐acetate (PMA) (Sigma‐Aldrich) for 2 h to induce NETosis. 8 After incubation with PMA, the cell culture supernatant of neutrophils was collected. The dish bottoms were rinsed with Ca2+/Mg2+‐free PBS. The collected supernatant and the rinsed PBS were transferred into a centrifuge tube for centrifugation at low speed (450 g, 10 min, 4°C). The supernatant was collected and then suffered from further centrifugation at high speed (20 000 g, 20 min, 4°C), and the pellet was collected. TE buffer was used to re‐suspend the pellet, and the content of NETs DNA was quantified using NanoDrop™ 2000. The NETs solution was stored at −20°C for the following experiments. The protocol was approved by the Ethics Committee of Guangzhou Medical University, China.
Detection of NETs DNA content
NETs DNA was measured as described previously. 8 Briefly, after treatment with 20 nm PMA for 2 h, the neutrophils in 24‐well plate were stained with Hoechst 33324 followed by photofluorography. The released DNA in cell culture supernatant was tested with Quant‐iT™ PicoGreen™ dsDNA Assay Kits (Invitrogen, MD, USA). The fluorescence intensity was measured with a fluorescent microplate reader (Thermo, MA, USA).
Animal experiments
Six‐week‐old nude mice were bought from Nanjing Biomedical Research Institute (Nanjing, China) and maintained under SPF conditions. All experiments were performed under the approval of the Animal Ethics Committee of Guangzhou Medical University.
After a 1‐week adaptation, 80 nude mice were randomly divided into four groups. Half of the mice were treated intraperitoneally with 1 mg kg−1 lipopolysaccharide (Sigma‐Aldrich) and the other half were given normal saline (NE). When serum NETs DNA was increased in the lipopolysaccharide group, DNASE1L3 knockdown or wild‐type mouse HCC H22 cells (1 × 10⁶ cells/side/mice) were subcutaneously transplanted. These cells have highly proliferative and invasive abilities. After 3 weeks, all of the mice were sacrificed, and the allografts and protein expression were measured.
Diabetic animal models were established as described previously. 17 , 38 Firstly, the nude mice were randomly divided into two groups: diabetes mellitus (DM, n = 30) and control (n = 10). In the DM group, the mice were fed a high‐fat and carbohydrate diet for a week, followed by a combination of a single intraperitoneal injection of streptozotocin (1% w/v solution in fresh cold sodium citrate buffer, pH 4.4) at a dose of 150 mg kg−1. Before the administration, the mice were deprived of food for 12 h. The control mice were injected with sodium citrate buffer. Glucose levels were detected 3 days after streptozotocin injection using blood samples collected from the tail vein. Blood glucose > 9.5 mm was considered diabetic, and such mice were eligible for further experiments. One week after the onset of hyperglycaemia, four mice were randomly selected from either group for testing blood NETs. The rest of the diabetic nude mice were divided into three groups: in two groups, DNASE1L3 knocked‐down H22 cells (1 × 10⁶ cells/side/mice) were subcutaneously transplanted, and the other group and control group just received wild‐type H22 cells. Four days later, the mice in one of the DNASE1L3 knocked‐down groups were treated with RU521 (1.5 mg kg−1) by intraperitoneal injection every day, 39 and those in the other group were given normal saline. Three weeks later, all the mice were sacrificed, and the allografts were measured.
Data collection and analysis
The survival data of 62 952 HCC patients and 220 diabetic HCC patients were downloaded and analysed using SEER*Stat 8.3.8 software. For the Cancer Genome Atlas (TCGA) data, the heat map of genes was obtained from UALCAN (http://ualcan.path.uab.edu/analysis.html). The analysis of differentially expressed genes was performed using the TCGAbiolinks R package. The protein–protein interaction (PPI) was analysed with STRING v11.0 (https://string‐db.org/), and the network of core genes was constructed using the Cytoscape software.
Cell culture
Human HCC SMMC7721 cells were purchased from Cell Bank of Type Culture Collection of Chinese Academy of Sciences (Shanghai, China). Human LO2 hepatocytes were supplied by Alexan Biotechnology Company (Guangzhou, China). Mouse HCC H22 cells were bought from Procell Life Science & Technology Company (Wuhan, China). The cells were maintained in RPMI‐1640 medium supplemented with 10% GemCell™ foetal bovine serum (Gemini, Woodland, USA) at 37°C under an atmosphere of 5% CO2 and 95% air. They were passaged and harvested with 0.25% trypsin.
Gene knockdown
Small interfering RNAs (siRNA) against DNASE1L3 or RELB were synthesised by Santa Cruz Biotechnology, Inc. (TX, USA). SMMC7721 cells or LO2 hepatocytes were seeded into 6‐well plates at a density of 2 × 10⁵ cells/well and cultured overnight. The constructed siRNA‐DNASE1L3, siRNA‐RelB or siRNA‐control was transferred into the cells using Lipofectamine 2000 (Invitrogen). To raise transfection efficiency, the cells were incubated with 20 nm siRNA for 6 h followed by a 24‐h culture. In mouse HCC H22 cells, lentivirus‐mediated shRNA delivery system was used to knock down DNASE1L3 gene. Briefly, H22 cells were seeded into 6‐well plates at a density of 2 × 10⁵ cells/well to culture overnight, and then, the medium containing the lentiviral particles (GeneChem Co., Ltd, Shanghai, China) was supplemented. After a 12‐h infection, the viral medium was replaced with a fresh medium followed by a 72‐h growth. Subsequently, the cells were selected with 1.5 μg mL−1 puromycin for 48 h. The interference efficiency was evaluated by Western blot assay.
Cell invasion assay
The cell invasion was observed with a transwell assay according to a previous report. 40 Briefly, 200 μL of SMMC7721 or LO2 hepatocyte suspension was placed in the upper chambers coated with matrigel (1:7 with cell medium). Into the lower chambers, 800 μL of medium containing NETs or diabetic serum was added as a chemo‐attractant. After a 48‐h culture, the upper chambers were washed with Ca2+‐free PBS, fixed in methanol for 30 min and stained with 0.1% crystal violet for 30 min. The cells remaining on the membrane were carefully wiped off with cotton swabs. The cells that migrated through the membranes were counted and captured under a microscope in four random visual fields.
Western blot assays for protein expression
Western blot assays were performed to analyse the expression of proteins in the cultured cells or allografts. 8 After the indicated treatments, the cells or grafts were collected and split at 4°C, and the protein concentration was quantitated with a BCA kit. Equal protein content in each sample was loaded on 10% SDS‐PAGE gels. After the electrophoresis, proteins in the gels were transferred to PVDF membranes. The membranes were blocked with 5% fat‐free milk in Tris‐base buffered saline containing 0.1% Tween‐20 for 1 h at room temperature and incubated with primary antibody against RelB (No. AF6380; Affinity Biosciences, OH, USA), DNASE1L3 (No. 36420; Signalway Antibody LLC, MD, USA), SPP1 (No. 25715‐1‐AP) or MMP9 (No. 10375‐2‐AP; ProteinTech, Chicago, IL, USA) with gentle agitation overnight at 4°C. After three washes, horseradish peroxidase‐conjugated secondary antibodies were applied and incubated for 1.5 h. The signals were visualised with an enhanced chemiluminescence detection system. The band intensity was quantified with ImageJ software.
Enzyme‐linked immunosorbent assay
SMMC7721 cells were treated with 0.25 μg mL−1 NETs DNA for the indicated times. The content of intracellular cGAMP was measured with a commercial ELISA kit provided by AmyJet Scientific Inc. (Wuhan, China) and followed the manufacturer’s protocol. The value of optical density was probed with a microplate reader (Thermo) at 450 nm.
Immunofluorescence
SMMC7721 cells were exposed to 0.25 μg mL−1 NETs DNA for 48 h. The cells were fixed in ice‐cold methanol for 15 min and soaked in 0.3% Triton X‐100 for 10 min. After three washes with PBS, the cells were blocked with 5% BSA in PBS for 1 h, incubated with primary antibody against STING (No. 19851‐1‐AP; ProteinTech, Chicago, IL, USA), or RelB (No. AF6380; Affinity Biosciences, OH, USA) overnight at 4°C. After washes, the corresponding horseradish peroxidase‐conjugated secondary antibodies were applied and incubated for 1 h. The cell nuclei were counterstained with DAPI. The cells were viewed and captured under a confocal microscope (Leica, Wetzlar, Germany).
Statistical analysis
The experiment data are presented as mean ± standard deviation (SD). Significance between groups was evaluated by one‐way analysis of variance followed by the Student–Newman–Keuls test using the GraphPad Prism 8 software (San Diego, CA, USA). A probability < 0.05 was considered to be statistically significant.
Conflict of interest
The authors declare no conflict of interest.
Supporting information
Supplementary figure 1
Supplementary figure 2
Acknowledgments
This work was supported by the Natural Science Foundation of Guangdong Province (2021A1515011365 and 2017A030313495), Guangzhou Education Bureau Key Medical Discipline Construction Project (201851839) and National Natural Science Foundation of China (81201919). We thank the patients and healthy donors for supporting the present work. We also thank the reviewers for their careful and valuable work.
Author contributions
Na Li: Investigation; Methodology; Validation. Xue Zheng: Data curation; Methodology; Visualization. Mianrong Chen: Data curation; Investigation. Li Huang: Funding acquisition; Writing – review & editing. Li Chen: Methodology; Visualization. Rui Huo: Investigation; Methodology. Xiaotong Li: Data curation; Investigation; Software. Mingwen Sun: Investigation; Methodology. Suiqing Mai: Data curation; Visualization. Zhuoyi Wu: Data curation; Software; Visualization. Hui Zhang: Data curation; Methodology. Jinbao Liu: Funding acquisition; Investigation; Writing – review & editing. Chun‐tao Yang: Funding acquisition; Project administration; Supervision; Writing – review & editing.
Contributor Information
Jinbao Liu, Email: jliu@gzhmu.edu.cn.
Chun‐tao Yang, Email: cyang@gzhmu.edu.cn.
References
- 1. Llovet JM, Kelley RK, Villanueva A et al. Hepatocellular carcinoma. Nat Rev Dis Primers 2021; 7: 6. [DOI] [PubMed] [Google Scholar]
- 2. Yang JD, Hainaut P, Gores GJ, Amadou A, Plymoth A, Roberts LR. A global view of hepatocellular carcinoma: trends, risk, prevention and management. Nat Rev Gastroenterol Hepatol 2019; 16: 589–604. [DOI] [PMC free article] [PubMed] [Google Scholar]
- 3. Yang LY, Luo Q, Lu L et al. Increased neutrophil extracellular traps promote metastasis potential of hepatocellular carcinoma via provoking tumorous inflammatory response. J Hematol Oncol 2020; 13: 3. [DOI] [PMC free article] [PubMed] [Google Scholar]
- 4. Tohme S, Yazdani HO, Al‐Khafaji AB et al. Neutrophil extracellular traps promote the development and progression of liver metastases after surgical stress. Cancer Res 2016; 76: 1367–1380. [DOI] [PMC free article] [PubMed] [Google Scholar]
- 5. Brinkmann V, Reichard U, Goosmann C et al. Neutrophil extracellular traps kill bacteria. Science 2004; 303: 1532–1535. [DOI] [PubMed] [Google Scholar]
- 6. Wong SL, Demers M, Martinod K et al. Diabetes primes neutrophils to undergo NETosis, which impairs wound healing. Nat Med 2015; 21: 815–819. [DOI] [PMC free article] [PubMed] [Google Scholar]
- 7. Fadini GP, Menegazzo L, Rigato M et al. NETosis delays diabetic wound healing in mice and humans. Diabetes 2016; 65: 1061–1071. [DOI] [PubMed] [Google Scholar]
- 8. Yang CT, Chen L, Chen WL et al. Hydrogen sulfide primes diabetic wound to close through inhibition of NETosis. Mol Cell Endocrinol 2019; 480: 74–82. [DOI] [PubMed] [Google Scholar]
- 9. Wang L, Zhou X, Yin Y, Mai Y, Wang D, Zhang X. Hyperglycemia induces neutrophil extracellular traps formation through an NADPH oxidase‐dependent pathway in diabetic retinopathy. Front Immunol 2018; 9: 3076. [DOI] [PMC free article] [PubMed] [Google Scholar]
- 10. Mantovani A, Targher G. Type 2 diabetes mellitus and risk of hepatocellular carcinoma: spotlight on nonalcoholic fatty liver disease. Ann Transl Med 2017; 5: 270. [DOI] [PMC free article] [PubMed] [Google Scholar]
- 11. Singh MK, Das BK, Choudhary S, Gupta D, Patil UK. Diabetes and hepatocellular carcinoma: a pathophysiological link and pharmacological management. Biomed Pharmacother 2018; 106: 991–1002. [DOI] [PubMed] [Google Scholar]
- 12. Connolly GC, Safadjou S, Chen R et al. Diabetes mellitus is associated with the presence of metastatic spread at disease presentation in hepatocellular carcinoma. Cancer Invest 2012; 30: 698–702. [DOI] [PubMed] [Google Scholar]
- 13. Shau WY, Shao YY, Yeh YC et al. Diabetes mellitus is associated with increased mortality in patients receiving curative therapy for hepatocellular carcinoma. Oncologist 2012; 17: 856–862. [DOI] [PMC free article] [PubMed] [Google Scholar]
- 14. El‐Serag HB, Tran T, Everhart JE. Diabetes increases the risk of chronic liver disease and hepatocellular carcinoma. Gastroenterology 2004; 126: 460–468. [DOI] [PubMed] [Google Scholar]
- 15. Davila JA, Morgan RO, Shaib Y, McGlynn KA, El‐Serag HB. Diabetes increases the risk of hepatocellular carcinoma in the United States: a population based case control study. Gut 2005; 54: 533–539. [DOI] [PMC free article] [PubMed] [Google Scholar]
- 16. Ikeda Y, Shimada M, Hasegawa H et al. Prognosis of hepatocellular carcinoma with diabetes mellitus after hepatic resection. Hepatology 1998; 27: 1567–1571. [DOI] [PubMed] [Google Scholar]
- 17. Wu DI, Hu DI, Chen H et al. Glucose‐regulated phosphorylation of TET2 by AMPK reveals a pathway linking diabetes to cancer. Nature 2018; 559: 637–641. [DOI] [PMC free article] [PubMed] [Google Scholar]
- 18. Yang L, Liu Q, Zhang X et al. DNA of neutrophil extracellular traps promotes cancer metastasis via CCDC25. Nature 2020; 583: 133–138. [DOI] [PubMed] [Google Scholar]
- 19. Masucci MT, Minopoli M, Del Vecchio S, Carriero MV. The emerging role of neutrophil extracellular traps (NETs) in tumor progression and metastasis. Front Immunol 2020; 11: 1749. [DOI] [PMC free article] [PubMed] [Google Scholar]
- 20. Wang S, Ma H, Li X et al. DNASE1L3 as an indicator of favorable survival in hepatocellular carcinoma patients following resection. Aging (Albany NY) 2020; 12: 1171–1185. [DOI] [PMC free article] [PubMed] [Google Scholar]
- 21. Sun L, Wu J, Du F, Chen X, Chen ZJ. Cyclic GMP‐AMP synthase is a cytosolic DNA sensor that activates the type I interferon pathway. Science 2013; 339: 786–791. [DOI] [PMC free article] [PubMed] [Google Scholar]
- 22. Deng L, Liang H, Xu M et al. STING‐dependent cytosolic DNA sensing promotes radiation‐induced type I interferon‐dependent antitumor immunity in immunogenic tumors. Immunity 2014; 41: 843–852. [DOI] [PMC free article] [PubMed] [Google Scholar]
- 23. Kwon J, Bakhoum SF. The cytosolic DNA‐sensing cGAS‐STING pathway in cancer. Cancer Discov 2020; 10: 26–39. [DOI] [PMC free article] [PubMed] [Google Scholar]
- 24. van der Windt DJ, Sud V, Zhang H et al. Neutrophil extracellular traps promote inflammation and development of hepatocellular carcinoma in nonalcoholic steatohepatitis. Hepatology 2018; 68: 1347–1360. [DOI] [PMC free article] [PubMed] [Google Scholar]
- 25. Wang P, Kang D, Cao W, Wang Y, Liu Z. Diabetes mellitus and risk of hepatocellular carcinoma: a systematic review and meta‐analysis. Diabetes Metab Res Rev 2012; 28: 109–122. [DOI] [PubMed] [Google Scholar]
- 26. Sun SC. The non‐canonical NF‐kappaB pathway in immunity and inflammation. Nat Rev Immunol 2017; 17: 545–558. [DOI] [PMC free article] [PubMed] [Google Scholar]
- 27. Bakhoum SF, Ngo B, Laughney AM et al. Chromosomal instability drives metastasis through a cytosolic DNA response. Nature 2018; 553: 467–472. [DOI] [PMC free article] [PubMed] [Google Scholar]
- 28. Shah K, Patel S, Mirza S, Rawal RM. Unravelling the link between embryogenesis and cancer metastasis. Gene 2018; 642: 447–452. [DOI] [PubMed] [Google Scholar]
- 29. Tu Y, Chen C, Fan G. Association between the expression of secreted phosphoprotein‐related genes and prognosis of human cancer. BMC Cancer 2019; 19: 1230. [DOI] [PMC free article] [PubMed] [Google Scholar]
- 30. Kawasaki T, Kawai T, Akira S. Recognition of nucleic acids by pattern‐recognition receptors and its relevance in autoimmunity. Immunol Rev 2011; 243: 61–73. [DOI] [PMC free article] [PubMed] [Google Scholar]
- 31. Xia P, Wang S, Gao P, Gao G, Fan Z. DNA sensor cGAS‐mediated immune recognition. Protein Cell 2016; 7: 777–791. [DOI] [PMC free article] [PubMed] [Google Scholar]
- 32. Wang H, Hu S, Chen X et al. cGAS is essential for the antitumor effect of immune checkpoint blockade. Proc Natl Acad Sci USA 2017; 114: 1637–1642. [DOI] [PMC free article] [PubMed] [Google Scholar]
- 33. Thomsen MK, Skouboe MK, Boularan C et al. The cGAS‐STING pathway is a therapeutic target in a preclinical model of hepatocellular carcinoma. Oncogene 2019; 39: 1652–1664. [DOI] [PubMed] [Google Scholar]
- 34. Li A, Yi M, Qin S, Song Y, Chu Q, Wu K. Activating cGAS‐STING pathway for the optimal effect of cancer immunotherapy. J Hematol Oncol 2019; 12: 35. [DOI] [PMC free article] [PubMed] [Google Scholar]
- 35. Liu H, Zhang H, Wu X et al. Nuclear cGAS suppresses DNA repair and promotes tumorigenesis. Nature 2018; 563: 131–136. [DOI] [PubMed] [Google Scholar]
- 36. Ahn J, Xia T, Konno H, Konno K, Ruiz P, Barber GN. Inflammation‐driven carcinogenesis is mediated through STING. Nat Commun 2014; 5: 5166. [DOI] [PMC free article] [PubMed] [Google Scholar]
- 37. Bakhoum SF, Cantley LC. The multifaceted role of chromosomal instability in cancer and its microenvironment. Cell 2018; 174: 1347–1360. [DOI] [PMC free article] [PubMed] [Google Scholar]
- 38. Gvazava IG, Kosykh AV, Rogovaya OS et al. A simplified streptozotocin‐induced diabetes model in nude mice. Acta Naturae 2020; 12: 98–104. [DOI] [PMC free article] [PubMed] [Google Scholar]
- 39. Zhou W, Whiteley AT, de Oliveira Mann CC et al. Structure of the human cGAS‐DNA complex reveals enhanced control of immune surveillance. Cell 2018; 174: 300–311 e311. [DOI] [PMC free article] [PubMed] [Google Scholar]
- 40. Wang J, Li Y, Li S et al. Anti‐tumor synergistic effect of a dual cancer‐specific recombinant adenovirus and paclitaxel on breast cancer. Front Oncol 2020; 10: 244. [DOI] [PMC free article] [PubMed] [Google Scholar]
Associated Data
This section collects any data citations, data availability statements, or supplementary materials included in this article.
Supplementary Materials
Supplementary figure 1
Supplementary figure 2


