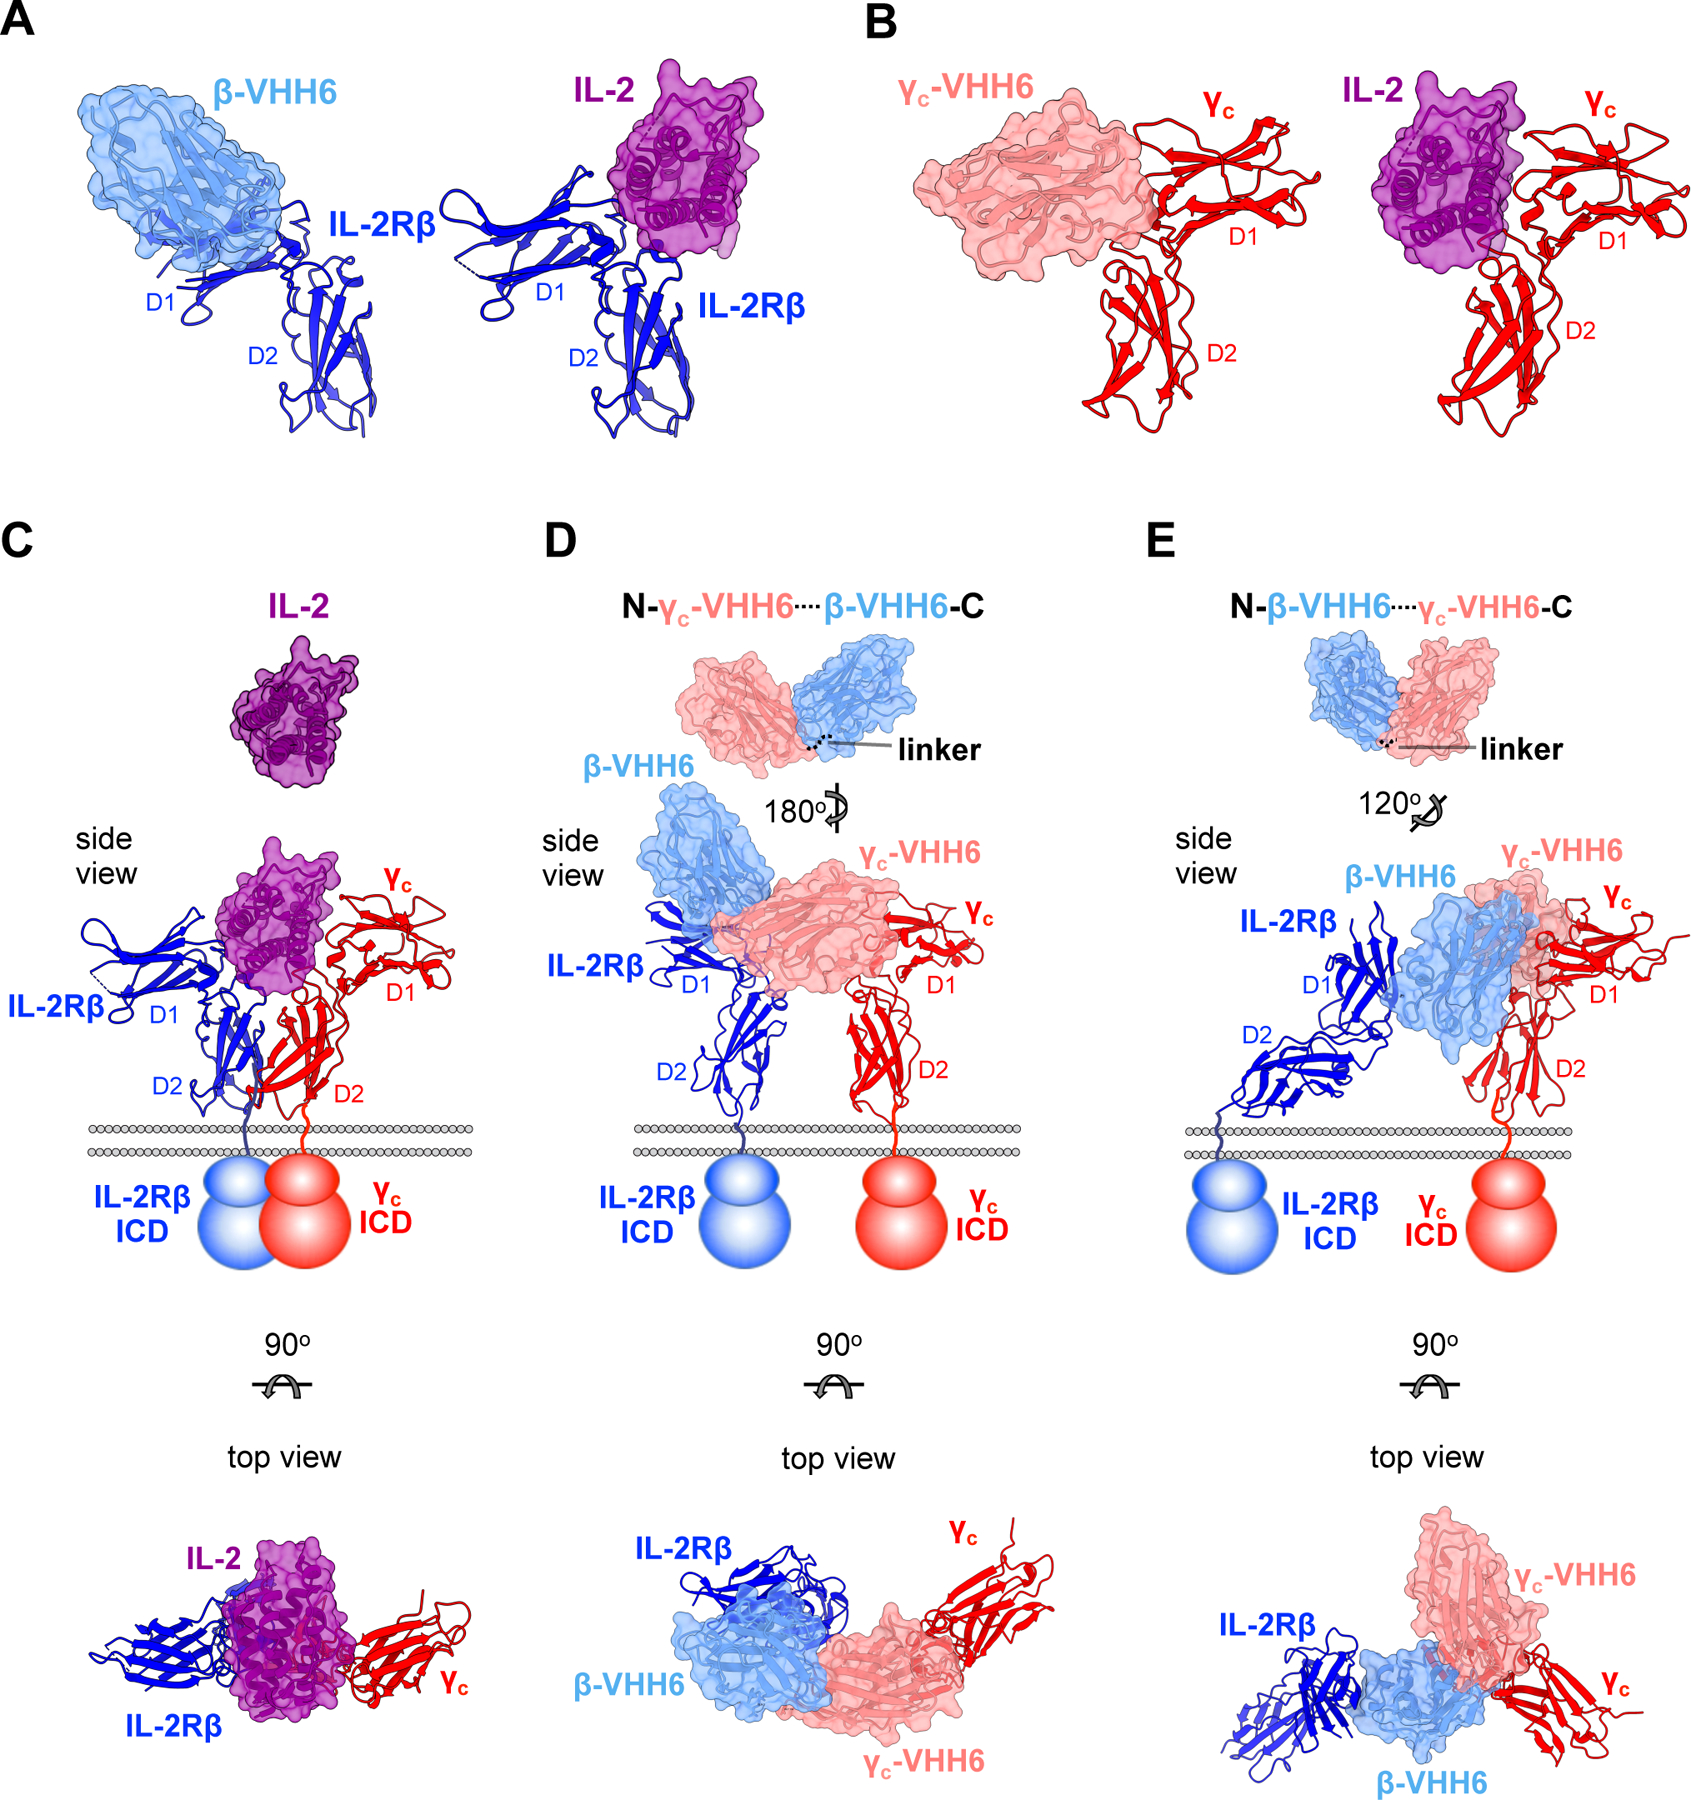
Figure 3. Dimeric geometries from crystal structures of IL-2Rβ:VHH and γc:VHH complexes.

(A) Side view comparisons between the human IL-2:IL-2Rβ binary complex (PDB: 2B5I) (Wang et al., 2005) and β-VHH6:IL-2Rβ binary complex. Surface representations of IL-2 and β-VHH6 are colored in purple and light blue, respectively, while IL-2Rβ is shown in ribbon representation in navy. (B) Side view comparisons of IL-2:γC and γC-VHH6:γC receptor complexes. γC-VHH6 is shown in pink, with γC colored in red (C) Crystal structure of the human IL-2:IL-2Rβ:γC ternary complex (PDB: 2B5I) (Wang et al., 2005). Side view with membrane bilayer and schematic representation of receptor transmembrane and intracellular domains (ICD) is shown at middle. Top view (below) is related to the side view by a 90° rotation about the horizontal axis. (D) Model of γC-VHH6–β-VHH6 bound to its receptors. Structures of the γC-VHH6:γC and IL-2Rβ:β-VHH6 were determined separately. The γC-VHH6–β-VHH6 linker distance was modeled in and represented by a dotted line (top), with a side and top views of receptor-bound model shown underneath. (E) Model of β-VHH6–γC-VHH6 bound to its receptors. The VHH–VHH linker was modeled as in (D).
See also Table S1.
